Table 1. Suggested components related to lipid metabolism the levels of which were altered in the kidney of male SelenBP1-KO mice by metabolomics analysis.
Representative components altered in mice
sample increased decreased
SelenBP1(-) vs Control
dihydrolipoic acid glycerol
leukotriene F4 24,25-dihydrolanosterol
7-dehydrodesmosterol stearic acid
5-hydroxyeicosatetraenoate (5-HETE)
14-demethyllanosterol 6-phosphogluconate
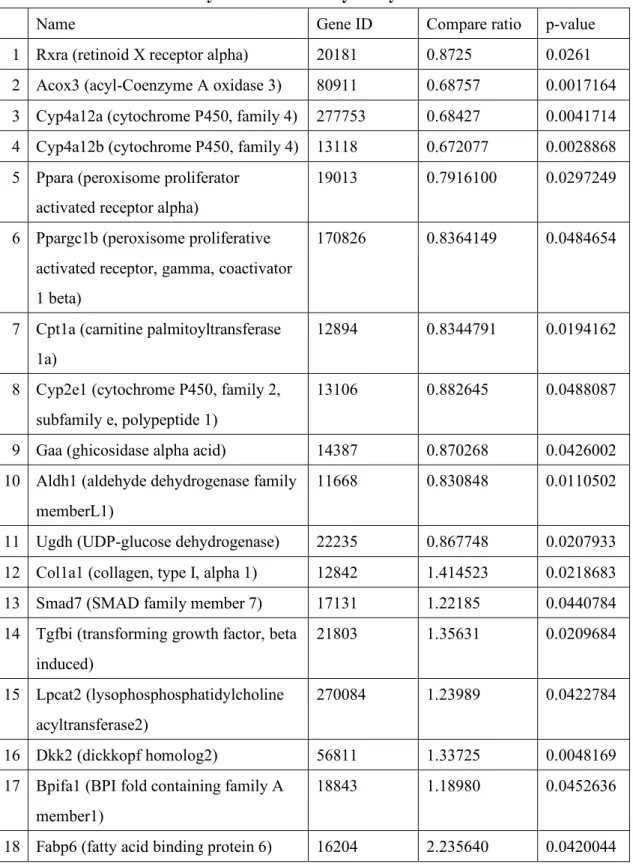
Table 2. Suggested genes related to lipid/glucose metabolism significantly altered with ablation of SelenBP1 by DNA microarray analysis
Name Gene ID Compare ratio p-value
1 Rxra (retinoid X receptor alpha) 20181 0.8725 0.0261 2 Acox3 (acyl-Coenzyme A oxidase 3) 80911 0.68757 0.0017164 3 Cyp4a12a (cytochrome P450, family 4) 277753 0.68427 0.0041714 4 Cyp4a12b (cytochrome P450, family 4) 13118 0.672077 0.0028868 5 Ppara (peroxisome proliferator
activated receptor alpha)
19013 0.7916100 0.0297249
6 Ppargc1b (peroxisome proliferative activated receptor, gamma, coactivator 1 beta)
170826 0.8364149 0.0484654
7 Cpt1a (carnitine palmitoyltransferase 1a)
12894 0.8344791 0.0194162
8 Cyp2e1 (cytochrome P450, family 2, subfamily e, polypeptide 1)
13106 0.882645 0.0488087
9 Gaa (ghicosidase alpha acid) 14387 0.870268 0.0426002 10 Aldh1 (aldehyde dehydrogenase family
memberL1)
11668 0.830848 0.0110502
11 Ugdh (UDP-glucose dehydrogenase) 22235 0.867748 0.0207933 12 Col1a1 (collagen, type I, alpha 1) 12842 1.414523 0.0218683 13 Smad7 (SMAD family member 7) 17131 1.22185 0.0440784 14 Tgfbi (transforming growth factor, beta
induced)
21803 1.35631 0.0209684
15 Lpcat2 (lysophosphosphatidylcholine acyltransferase2)
270084 1.23989 0.0422784
16 Dkk2 (dickkopf homolog2) 56811 1.33725 0.0048169 17 Bpifa1 (BPI fold containing family A
member1)
18843 1.18980 0.0452636
18 Fabp6 (fatty acid binding protein 6) 16204 2.235640 0.0420044