Contents 1. Introduction 2. Literature Review
3. Downscoping of Japanese Firms and its Impact: Hypotheses and Methods 4. Results and Discussion
Keywords : Diversification, R&D, Downscoping, Synergy effect, Market share
1. Introduction
There are a good number of prior studies on diversification strategy and its synergistic effect on profitability and/or market share (cf. Ansoff, 1965; Rumelt, 1974; Wernerfelt, 1984). The traditional view is that a related diversified firm can enjoy a synergistic effect through sharing resources among its divisions. However, many Japanese firms have been struggling with their diversification strategies even though the major type of their strategies was “related diversification strategy”, and some of them are exiting from some business areas to improve their profitability.
To fill the gap between the theory and the reality, we firstly think about the question why the Japanese firms have not got to enjoy the synergetic effects looking at the relationships between diversification strategy and performance. Performance here means profitability and market share.
And we secondly look into the effectiveness of the downscoping strategies they are now undertaking by examining the impacts on the performance, that is more important for the aim of this study. This study concludes by showing results by what extent downscoping strategy has influence on a firmʼs performance.
This paper has three parts. First, we conduct literature review. Second, we show hypotheses about
Downscoping Strategy and Performance:
Analyses on Diversified Firms in Japan
Yu ISHIMITSU* 1 Masatoshi FUJIWARA* 2
*1
Faculty of Bussiness Administration, Kyoto Sangyo University
*2
Graduate School of Commerce and Management, Hitotsubashi University
the impacts of their strategies, construct a dataset, and show our models. And third, we draw some conclusions from our analyses.
2. Literature Review
1The relationships among resource, diversification strategy, and firmsʼ performance have been discussed in the field of RBV (Resource-Based View) of the firm. The researchers on RBV are mainly interested in the profitability of diversification strategy. The first researcher who stimulated many RBV researchers is Ansoff (1965). He showed one of the merits which diversified firms can enjoy, and termed it “synergy”. He pointed out four types of synergy, that are sales synergy, operating synergy, investment synergy, and management synergy. His argument is that diversified firms are able to enjoy these merits because they can share some resources.
After Ansoffʼs initiative research, Rumelt (1974) and Berry (1975) examined the profitability of diversified firms. They showed that the financial performance of related business firms are better than that of unrelated business firms. They explained its difference by using the concept of synergy, and many researchers have supported this explanation (see Bettis, 1981; Montgomery and Wernerfelt, 1988; Singh and Montgomery, 1987). For instance, Montgomery and Wernerfelt (1988) used Tobinʼs q to show the merit of related business firms. This difference between relatedly diversified firms and unrelatedly diversified firms can be recognized not only in USA, but also in Japan. Yoshihara, Sakuma, Itami, and Kagono (1981), and Hakota (1986) found the same result as in USA. Especially, Yoshihara (1981) insisted that informational resources played a very important role to make a difference among diversified firms.
On the contrary, we can also find some researchers who cast doubts on these results mentioned above. They argued that their results did not find an evidence to prove the significant difference in terms of performance. They insist that this confrontation against former researches is caused by the confusion of the definition of “relatedness” (Pitts and Hopkins, 1982; Fan and Lang, 2000).
Regarding the reason why the prior researches are inconsistent with each other, Markides and Williamson (1994) insists two points as follows: Firstly, most researchers failed to measure the relatedness in a right way, because the traditional method of measuring them did not reflect the strategically important diversification. Secondly, they failed to grasp the dynamic benefits of synergy that are essential ones of diversification behaviors because most researchers examine the benefits only statically. Most researchers only record a snapshot of diversified firms and they divide the firms into some groups by seeing the technologies they have at the time.
Certainly, static analysis of diversified firms discussed above has some merits. It stimulates the
research to figure out what kind of resources can make profit, what kind of resources firms have to
contain, and what kind of common character good resources have in common, and so on. To answer these questions, many researchers tend to follow these three steps: First, they pick up some excellent companies. Second, they specify the resources which bring profit. And finally, they analyze the specific character of those resources. Due to its operational convenience, static analysis of RBV had been accelerated, whereas dynamic approach been forgotten.
It is interesting that the approach of specifying the character of resources becomes very similar to Porterʼs structural framework (Porter, 1979; 1980). Porter focused on industrial structure and suggested five forces to explain firmsʼ performance. Researchers on RBV applied his structural framework to their studies. They thought some resources can be traded through market, but some cannot be traded easily because the market structure is not so severe: potential competitors are quite few and the threat of replacing is also weak. Static researches have developed in this way and a dynamic research has been almost untouched.
To develop dynamic researches, there are three possible fields to dynamic approach. The first field is to study the utilizing process of resources because the resources never create value itself and it needs organizational behavior to utilize them. Earlier works have exclusively focused on physical factors such as technology and/or patent themselves which produce value. By focusing on the side of organisational behavior, we will be able to make researches on RBV more dynamic.
Second field is to have a holistic view and cover all aspects of accumulating and utilizing resources.
Yoshihara (1981) and Wernerfelt (1984) looked into a causal chain of resource accumulation and utilization. They explained that resources which are accumulated after diversification strategy can be a driving force for the next diversification behavior. These researches developed a dynamic approach to understand the process of resource accumulation and utilization. Itami (1987) termed the dynamic process of resource accumulation in a division and utilization in another division “dynamic synergy”.
He suggested that a firm should recognize and realize a dynamic synergy for further corporate growth.
And finally, the third way is to study how a firm maintains its competitive advantage in each existing business field after diversification. It is not so easy for firms to keep their competitive advantages in their existing fields for a long time and some firms decide to sell some unprofitable businesses. By exiting from such unprofitable markets, the firm gets to put its resources into its refocused businesses and expects to develop its strategic performance in these markets. Such a downscoping strategy can have some positive effects on market performance and innovation activities (Hoskisson and Hitt, 1994).
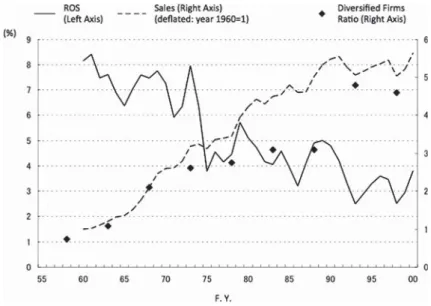
Our aim of this paper is to think about this last issue. Japanese firms were expanding their
business scope whereas their profitability was coming down as shown in Figure 1. And after the
bubble economy burst, they exited from some poor markets and they have been trying to recover their profitability as will be shown in the next section.
3. Downscoping of Japanese Firms and its Impact: Hypotheses and Methods
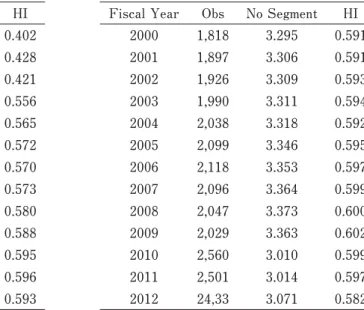
To understand the Japanese firms diversification strategies and downscoping strategies, we first look at the number of segments of Japanese firms, which is summarized in the Table 1. The mean value as of 1987 is 5.543 and the maximum number is 15 segments. There is a wide gap about the mean from 1989 to 1990. The Japanese standard setter publicly started requiring firms to report segment information from 1990 and there might be some institutional change about reporting the number of segments. After the bubble economy collapsed, the mean declined to 3.170 in 1996 as Japanese Yen got stronger which harmed Japanese firms performance. In 2010, the mean discontinuously went down to 3.009 from 3.361 in 2009. This is probably due to the regulation change about reporting their segments to reflect their strategic perspectives. Another measure of diversification in the Table 1 is the degree of business concentration (HI), which considers the size of segment businesses using the idea of Herfindahl Index.
Figure 1: Diversification and Declining Profitability
Note: Diversified Firm Ratio is calculated as follows: 1 - (the number of single business or dominant-vertical firms) / (the total
number of the firms observed)
is the set of business segment ( ) at fiscal year and is the sales share of each business segment. Higher HI indicates that the business structure of a diversified firm is more concentrated.
In this case, the change of HI and that of the number of the segments go in the opposite direction. As shown in the Table 1, the average HI gradually increases from 1990 to 2009. It means that there is a downscoping tendency among Japanese diversified firms in this period.
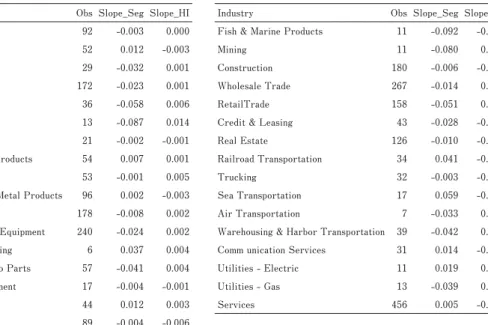
This tendency is observed in many industries. Table 2 shows the mean values of the regression coefficients on fiscal year by industry; (the dependent variable is the number of segments (or HI) and the independent variable is fiscal year (1987-2012)). Out of 33 industries, the 22 (19 in the case of HI) industries have the downscoping tendency and 11 (14 in the case of HI) industries have the tendency of diversification. According to the change of HI, Petroleum (0.014) has been downscoping most radically. Conversely, Communication Services (-0.007) has been diversifying most aggressively.
Sea Transportation (-0.004) shows the tendency of downscoping, which partially coincides with the findings of Ishimitsu and Fujiwara (2008).
Table 1: Average Number of segments and HI by year
Fiscal Year Obs No Segment HI Fiscal Year Obs No Segment HI
1987 137 5.562 0.402 2000 1,818 3.295 0.591
1988 804 4.754 0.428 2001 1,897 3.306 0.591
1989 863 4.805 0.421 2002 1,926 3.309 0.593
1990 910 3.257 0.556 2003 1,990 3.311 0.594
1991 934 3.214 0.565 2004 2,038 3.318 0.592
1992 966 3.203 0.572 2005 2,099 3.346 0.595
1993 1,124 3.198 0.570 2006 2,118 3.353 0.597
1994 1,261 3.201 0.573 2007 2,096 3.364 0.599
1995 1,328 3.203 0.580 2008 2,047 3.373 0.600
1996 1,334 3.173 0.588 2009 2,029 3.363 0.602
1997 1,385 3.177 0.595 2010 2,560 3.010 0.599
1998 1,487 3.206 0.596 2011 2,501 3.014 0.597
1999 1,730 3.263 0.593 2012 24,33 3.071 0.582
Source:
When a firm reduces its business fields, it is normally considered that they exit from some poor markets and stay in more profitable markets (Hoskisson and Hitt, 1994). It means that there is a positive relationship between the reduction of segments and profitability. Not only increasing profitability, the firm will be able to put the slack resources into the refocused businesses; that develops market share as well. Thus, the first and basic hypothesis of our study is formulated as follows:
As a variable to see diversification and downscoping behavior of a firm, we measured the degree of downscoping during 5 years. Firstly, we calculated the concentration of business structures using Herfindahl Index. And we conducted regression using 5-year data to get coefficients which indicate the changes of the , and we call the coefficient ( reflects by what extent each firm increases or decreases the scope of business. In this setting, if a firm exits from poor businesses and concentrates their resource on other business segments, becomes positive. As we have argued that downscoping strategy will contribute to a firmʼs performance, it is hypothesized that there is a positive relationship between and business performance.
In terms of business performance, profitability is illustrated as Return on Asset ( ). We calculated the change of ROA (ΔROA=ROA -ROA ) using the Nikkei financial quest data. The reason why we look at ROA only from 2008 to 2010 is exclusively due to the data constraints about
Table 2: Mean coefficients by industry (fy1987-fy2012)
Industry Obs Slope̲Seg Slope̲HI Industry Obs Slope̲Seg Slope̲HI
Foods 92 -0.003 0.000 Fish & Marine Products 11 -0.092 -0.001
Textile Products 52 0.012 -0.003 Mining 11 -0.080 0.004
Pulp & Paper 29 -0.032 0.001 Construction 180 -0.006 -0.002
Chemicals 172 -0.023 0.001 Wholesale Trade 267 -0.014 0.000
Drugs 36 -0.058 0.006 RetailTrade 158 -0.051 0.004
Petroleum 13 -0.087 0.014 Credit & Leasing 43 -0.028 -0.001
Rubber Products 21 -0.002 -0.001 Real Estate 126 -0.010 -0.002
Stone, Clay & Glass Products 54 0.007 0.001 Railroad Transportation 34 0.041 -0.005
Iron & Steel 53 -0.001 0.005 Trucking 32 -0.003 -0.003
Non ferrous Metal & Metal Products 96 0.002 -0.003 Sea Transportation 17 0.059 -0.004
Machinery 178 -0.008 0.002 Air Transportation 7 -0.033 0.001
Electric & Electronic Equipment 240 -0.024 0.002 Warehousing & Harbor Transportation 39 -0.042 0.005
Shipbuilding & Repairing 6 0.037 0.004 Comm unication Services 31 0.014 -0.007
Motor Vehicles & Auto Parts 57 -0.041 0.004 Utilities - Electric 11 0.019 0.002
Transportation Equipment 17 -0.004 -0.001 Utilities - Gas 13 -0.039 0.012
Precision Equipment 44 0.012 0.003 Services 456 0.005 -0.002
Other Manufacturing 89 -0.004 -0.006
market share. Market share is also calculated by looking at its average change of market share in the businesses from 2008 to 2010 (ΔMS=avg(MS -MS )). The data source is
(Yano Keizai Kenkyusho, 2012).
As in the study of diversification strategy where R&D intensity works as a moderating factor (Miller, 2004; 2006), there may be some moderating factors in our model as well. Likewise the prior studies on diversification strategy, we look at R&D ratio to sales as a moderating factor to more clearly understand the relationships between the change of number of businesses and its impacts on profitability. A diversified firm which is downscoping but maintaining the R&D ratio can put more R&D resources into its existing businesses and introduce a new product or service into the markets.
Conversely, A diversified firm which is downscoping and decreasing its R&D ratio at the same time will not be able to radically improve its power to introduce a new product or service. Thus, the hypothesis 2 is formalized as below:
These two hypotheses are illustrated in Figure 2 and the outline of the model is shown as follows:
α α α
α
is the percentage of R&D expenditures to sales, five-year average. Again, we have two different proxy variables; profitability and market share as the dependent variable. Thus, we have two different models for each hypothesis. As Control variables, we add and
.
The last issue that this study is going to find out is about time lag effect between the dependent variables (Δ and Δ ) and the independent variables ( and
Figure 2: Diagram of Hypotheses
). It is common to take a time lag effect into consideration in a model; but it is still unclear that how many years we should take as a period of the time lag. To assess the time lag impact on business performance associated with the independent variables, we consider three different models depending on the period of the time lag: year t-1, t-2, and t-3. In sum, we have the two different dependent variables looking at the three different time lag effects, that shows we test the six models.
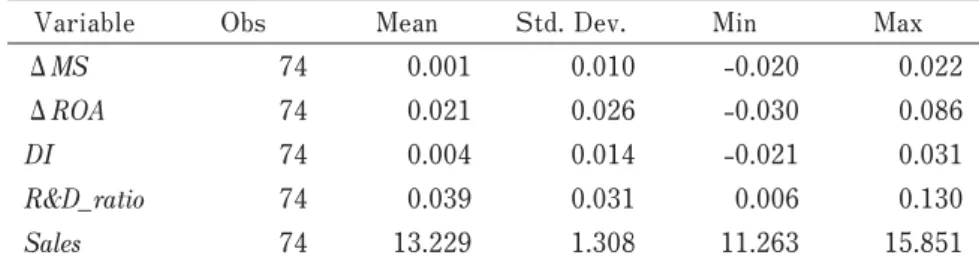
Table 3 shows the descriptive statistics of the variables and Table 4 shows the correlation matrix of them. There are no statistically significant correlations among variables. The descriptive statistics in Table 3 and 4 use the data set of year t-2 (fy2002-fy2006) and the correlations matrix of the variables of year t-2 (fy2002-fy2006) is shown in table 3. The data t-1 (fy2003-fy2007) and t-3 (fy2001-fy2005) have similar distributions with the data t-2.
4. Results and Discussion
The results of our regression analyses are shown in Table 5. Hypothesis 1 is not supported. All the coefficients of DI except for the model 4 are positive as we hypothesized, but not significant. We regress without interaction term DI* R&D ratio, and the sign on DI is positive but not significant either. This result means that DI itself does not have any influence on business performance both in market share and profitability.
Hypothesis 2 is not supported, either. Contrary to our expectations, the interaction effects of Table 3: Descriptive Statistics of dataset (t-2: fy2002-fy2012)
Variable Obs Mean Std. Dev. Min Max
Δ 74 0.001 0.010 -0.020 0.022
Δ 74 0.021 0.026 -0.030 0.086
74 0.004 0.014 -0.021 0.031
74 0.039 0.031 0.006 0.130
74 13.229 1.308 11.263 15.851
Table 4: Correlation of Variables (t-2:fy2002-fy2012)
ΔMS ΔROA DI R&D̲ratio Sales
Δ 1.000
Δ 0.129 1.000
-0.091 -0.133 1.000
-0.020 -0.012 0.238 1.000
0.038 0.155 -0.040 0.200 1.000
R&D ratio and the change of business concentration (DI) are significantly negative on market share in model 2 and 3. It means that a firm shrinking its business fields with high R&D ratio decreases the profitability. There are two reasons for this result. The first reason is that R&D contributes to business performance if it is invested in more various fields. R&D investment into more business fields can bring a firm more various sources for developing new products or services with R&D synergy effects. The second reason is simple: It may be because time lag is too short to examine it.
Finally, the Adjusted R
2is highest in the model 2. It implies that it might be better to take 2 years as time lag. But we need to be careful because all the R
2s are rather low.
This paper has some limitations. The first is that the R
2s are low and our model might not work well. There are two reasons. One reason is that the sample size is rather small and we need to expand the size. Our study looks at profitability only from 2008 to 2010 due to the data constraints of market share. If we collect more market share data, we can expand the profitability data as well. The other reason is that the variables our study relies on might not be good enough. If that is the case, we need to reconsider what variables we should take in our study. In this sense, our study looks still preliminary and it needs to be improved in many aspects in the future.
Note
1 This section is written based on Fujiwara (2007).
Table 5: Results of Regression Analyses
Market Share ROA
model 1 time-lag effect
(t-3)
model 2 time-lag effect
(t-2)
model 3 time-lag effect
(t-1)
model 4 time-lag effect
(t-3)
model 5 time-lag effect
(t-2)
model 6 time-lag effect
(t-1)
0.026 0.157 0.169 -0.116 0.174 0.196
[0.17] [0.97] [1.24] [-0.29] [0.41] [0.59]
0.032 0.065 0.054 0.169 0.252 0.185
[0.41] [0.85] [0.76] [0.84] [1.26] [1.05]
-2.813 -5.351** -3.875* -4.289 -8.400 -2.115
[-1.48] [-2.12] [-1.75] [-0.87] [-1.26] [-0.39]
0.000 0.001 0.001 -0.001 0.000 -0.001
[0.18] [0.64] [0.76] [-0.46] [-0.14] [-0.29]
included included included included included included
0.019 0.010 0.009 0.058 0.042 0.049
[1.09] [0.61] [0.5] [1.3] [0.92] [1.12]
0.069 0.089 0.04 0.013 0.003 0.016
74 74 74 74 74 74
** and * denote significance at the 0.05 and 0.10 level, respectively.
References
Abernathy, W. J. and K. B. Clark, “Innovation: Mapping the Winds of Creative Destruction,” , Vol.
14, No. 1, 1985, pp. 3-22.
Anderson, P. and M. L. Tushman, “Technological Discontinuities and Dominant Designs: A Cyclical Model of Technological Change,” , Vol. 35, No. 4, 1990, pp. 604-633.
Ansoff, H. I. , McGraw-Hill,
1965.
Barney, J. B., “Strategic Factor Markets: Expectation, Luck and Business Strategy,” Vol.
32, No. 10, 1986, pp. 1231-1241.
Berry, C. H., , Princeton, NJ: Princeton University Press, 1975.
Bettis, R. A., “Performance Differences in Related and Unrelated Diversified Firms,”
, Vol. 2, No. 4, 1981, pp. 379-393.
Christensen, C. M., , Cambridge, MA:
HBS Press, 1997.
Christensen, C. M. and J. L. Bower, “Customer Power, Strategic Investment, and the Failure of Leading Firms,”
, Vol. 17, No. 3, 1996, pp. 197-218.
Dierickx, I. and K. Cool, “Asset Stock Accumulation and the Sustainability of Competitive Advantage,”
Vol. 35, No. 12, 1989, pp. 1504-1511.
Fan, J. P. and L. H. P. Lang, “The Measurement of Relatedness: An Application to Corporate Diversification,”
, Vol. 73, Issue 4, 2000, pp. 629-660.
Fujiwara, M., “Ambidextrous Capability: The Case of Japanese Enterprises,” Peter Li (ed.),
, 2013, pp. 199-217.
Fujiwara, M., “Innovation by Defining Failures under Environmental and Competitive Pressures: A Case Study of the Laundry Detergent Market in Japan,” , Issue 37, 2011.
Fujiwara, M., “Technological Innovation through Transferring Process Technologies,” PhD Dissertation, 2005.
Fujiwara, M., “Toward the Research on Innovation Mechanism of Diversified Firm: Integrating Resource-Based- View and Innovation Research,” , Issue 24, 2007, pp. 139-150.
Graham, J. R., M. L. Lemmon and J. G. Wolf, “Does Corporate Diversification Destroy Value?”
, Vol. 57, No. 2, 2002, pp. 695-720.
Hakota, S., , Kinki Daigaku Sekai
Keizai Kenkyujo Kenkyu Ronsho, 1986 (in Japanese).
Henderson, R. M., “Underinvestment and incompetence as responses to radical innovation: evidence from the photolithographic alignment equipment industry,” , Vol. 24, No. 2, 1993, pp. 248- 270.
Henderson, R. M. and K. B. Clark, “Architectural Innovation: The Reconfiguration of Existing Product Technologies and the Failure of Established Firms,” , Vol. 35, 1990, pp. 9-30.
Hoskisson, R. E. and M. A. Hitt, , Oxford University Press, 1994.
Ishimitsu, Y. and M. Fujiwara, “Zaimu Data de Miru Kaiun Ni-Sha no Senryaku-Bunseki (Comparing the top two
Japanese Shipping Agentsʼ Strategies by their Accounting Data),” , Vol. 14, 2008,
pp. 155-176 (in Japanese).
Itami, H. (with T. W. Roehl), , Harvard University Press, 1987.
Iwasaki, K. and A. Ohtsuki, “Jigyo no Saikochiku: Senryaku Pattern no ʻTokyochoʼ to ʻJireiʼ,” Itami Hiroyuki,
Itami Kenkyushitsu (eds), , Toyo Keizai
Shinposha, 2002, pp. 192-226 (in Japanese).
Leonard-Barton, D., “Core Capabilities and Core Rigidities: A Paradox in Managing New Product Development,”
, Vol. 13, 1992, pp. 111-125.
Lippman, S. A. and R. P. Rumelt, “Uncertain imitability: an analysis of interfirm differences in efficiency under
competition,” Vol. 13, No. 2, 1982, pp. 418-438.
Markides, C. C., “Corporate Refocusing,” , Vol. 4, No. 1, 1993, pp. 1-15.
Miller, D. J., “Firmsʼ Technological Resources and the Performance Effects of Diversification: A Longitudinal
Study,” , Vol. 25, 2004, pp. 1097-1119.
Miller, D. J., “Technological Diversity, Related Diversification, and Firm Performance,”
, Vol. 27, No. 7, 2006, pp. 601-619.
Montgomery, C. A. and B. Wernerfelt, “Diversification, Ricardian Rents, and Tobinʼs q,”
, Vol. 19, No. 4, 1988, pp. 623-632.
Peteraf, M. A., “The Cornerstones of Competitive Advantage,” , Vol. 14, 1993, pp.
179-188.
Pitts, Robert A. and H. D. Hopkins, “Firm Diversity: Conceptualization and Measurement,”
, Vol. 7, No. 4, 1982, pp. 620-629.
Porter, M. E., “The Structure within Industries and Companiesʼ Performance,”
, Vol. 61, No. 2, 1979, pp. 214-227.
Porter, M. E., , Free Press, 1980.
Prahalad, C. K. and G. Hamel, “The Core Competence of the Corporation,” . Vol. 66, 1990, pp. 71-91.
Rumelt, R. P., , Boston: HBS Press, 1974.
Sahal, D., “Technological Guideposts and Innovation Avenues,” , Vol. 14, Issue 2, 1985, pp. 61-82.
Tushman, M. L. and P. Anderson, “Technological Discontinuities and Organizational Environments,”
, Vol. 31, 1986, pp. 439-465.
Wernerfelt, B., “A Resource-Based View of the Firm,” . Vol. 5, 1984, pp. 171-180.
Yano Keizai Kenkyusho, , 2012.
Yoshihara, H., A. Sakuma, H. Itami, and T. Kagono, ,
Nihon Keizai Shinbunsha, 1981 (in Japanese).
目 次
1.イントロダクション 2.先行研究レビュー
3.ダウンスコーピング企業とその影響:仮説と検証方法 4.結果とディスカッション
キーワード:多角化,研究開発,ダウンスコーピング,シナジー効果,マーケットシェア
ダウンスコーピング戦略と企業業績:
日本における多角化企業の分析
平成 26 年 5 月 7 日受付