• 検索結果がありません。

B l o o d P i c t u r e o f N a g a s a k i A t o m i c B o m b S u r v i v o r s * 1 N a o m i K A G E U R A , S h i r o O S A J I M A A N D M a s a n o b u T O M O N A G A * 2 S e c o n d D e p a r t m e n t o f I n t e r n a l M e d i c i n e , N a g a

N/A
N/A
Protected

Academic year: 2021

シェア "B l o o d P i c t u r e o f N a g a s a k i A t o m i c B o m b S u r v i v o r s * 1 N a o m i K A G E U R A , S h i r o O S A J I M A A N D M a s a n o b u T O M O N A G A * 2 S e c o n d D e p a r t m e n t o f I n t e r n a l M e d i c i n e , N a g a"

Copied!
12
0
0

読み込み中.... (全文を見る)

全文

(1)

Acta med. nagasaki. 5 : 1 - 12 (1960)

Blood Picture of Nagasaki Atomic Bomb Survivors *1

Naomi KAGEURA, Shiro OSAJIMA AND Masanobu TOMONAGA *2 Second Department of Internal Medicine, Nagasaki University

School of Medicine, Nagasaki, Japan

Received for publication February 8, 1960

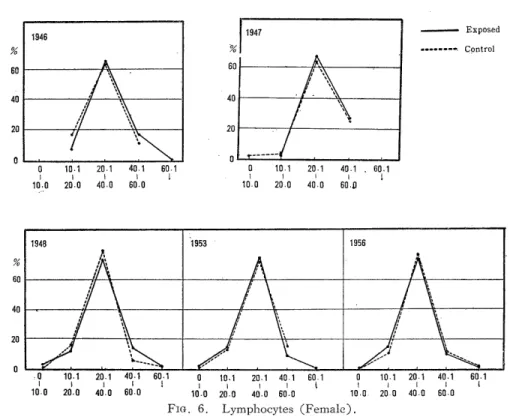
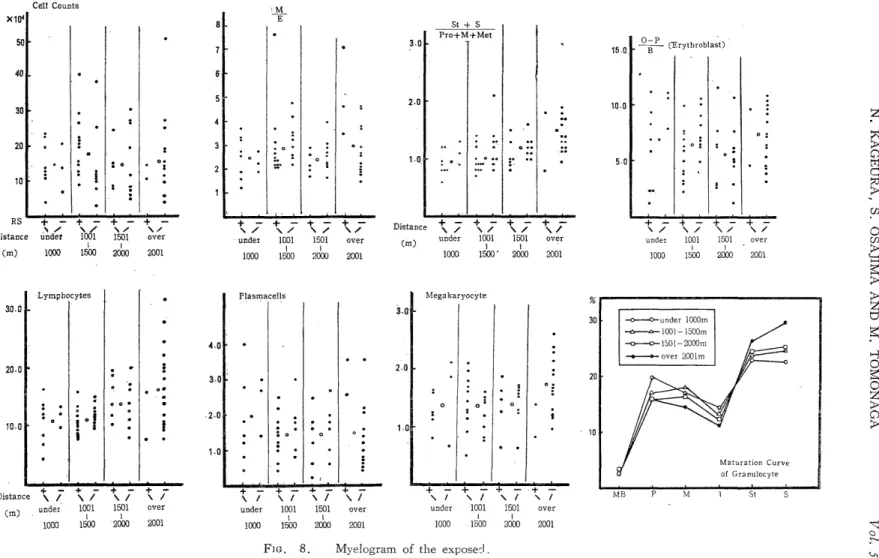
The results of hematological studies in Nagasaki on atomic bomb (A-bomb) survivors which were carried out at Second Department of Internal Medicine from 1946 to 1956 have been brought for summary. 1) Anemic and leukopenic tendency revealed in the exposed in 1946 and 1947 has recovered as time went on, no difference being noticed in 1948 in cases of leukopenia and in 1956 in cases of anemia comparing with the control. 2) The incidence of eosin- ophilia in the exposed showed a characteristic variation from 1947 to 1953, which may be related to the A-bomb radiation. However, in 1956, no diffe- rence was noticed between the exposed and control. 3) In general, the tend- ency of restoring to normal values was extremely strong in the exposed in each item of investigation. Accordingly, so far as concerned with peripheral blood, no significant difference was observed between the exposed and con- trol in 1956. 4) However, the clinical investigation of bone marrow in the exposed performed in 1956, still suggested a possibility of maturation arre- st of granulocytic and megakaryocytic series in the short distance exposed.

5) Three cases of chronic myelocytic leukemia were found in these mass survey, two of them being in an early stage of the disease.

The immediate and acute effects of A-bomb radiation on human beings, especi- ally the injuries to hematopoietic organs, were clarified to a large extent by many studies. So it has become very important to determine whether such injuries have recovered or continued, that is, if there could be any delayed, longterm, or chronic

effects many years after A-bomb explosion.

Several blood surveys of the Nagasaki A-bomb survivors exposed within 2000m from the hypocenter have been carried out by various staff members of Second

Department of Internal Medicine for over ten years. Findings from these investiga- tions have been brought up-to-date for summary.

MATERIALS AND METHODS

Hematological examination (hemoglobin, WBC count and differential) of the survivors exposed within 2000m from the hypocenter of the atomic bombing in Nagasaki were performed, in 1946, 1947, 1948, 1953 and 1956. The number of the survivors examined were 94, 61, 77, 2927 and 3234 respectively and that of the controls who were simultaneously examined were 69, 33, 110, 361 and 1607.

They were classified as illustrated in Table 1 into A, B and C, according to presen- ce or abscence of acute radiation symptoms (epilatiian, hemorrhagic tendency, stom- atitis) and were further divided in 18 smaller groups by sex and age. Although

*L Presented at the 19th General Meeting of the Japan Hematological Society. Tokyo, Japan. April 3, 1957.

紹 影 浦 尚 視 ・籏 島 四 郎 ・朝 長 正 允

(2)

TABLE 1.

The Number of Survivors Examined 1946

Sex F T

Age Y

1. Y~ Group

_ ~' ~

A 89 5 0 94

C 60 9 0 69

T 149 I 14 0 163

Total 163

1947

Sex F T

Age

Group Y.1 Y2 Y

A 55 6 0 61

C 28 5 0 33

T 83 11 0 94

Total 94

1948

Sex F T

Age Y

7 Y2 Ys Group

A 13 15 2 30

B 18 22 7 47

C 88 22 0 110

T 119 59 9 187

Total 187

Remarks :

A Exposed under 2000m with major radiation symtoms.

B Exposed under 2000m without major radiation symptoms

C Control.

T : Total, Y1 8-23 years.

Yz 24-58 years, Y3 58 years and over.

1953

Sex M F T

~~Age

Y1 Ya ` Ys Y1 ` Y2 ` Yae

Group \. _

A 125 248 44 132 484 54 1,087

B 221 307 111 346 767 127 1,885

C 78 91 22 80 83 7 361

T 430 646 177 558 1,334 188

Total 1,263 2,080 3,333

1956

Sex M F T

Age Y

Y Y2 Ys Y 1 Y2 Ys Group

A 102 505 86 I 132 576 76 1,477

B 307 472 97 310 485 86 1,757

C 185 416 146 205 522 133 1,607

T 594 1,393 329 647 1,583 295

Total ~ 2,316 --- 2,525 4,841

-

(3)

three early surveys were concerned with a small number of female alone, the last two included both male and female of a large number that reached one third of the survivors residing in Nagasaki City as shown in Table 2.

As for the method of analysis, in- cidence of deviation from the usually normal value which was shown in each item of analysis was compared by the chi square test. As the detailed results of each survey was already reported respectively'-) 2)9)'-0)"), a particular em- phasis has been given to the comparison of changes by year. Chi square analys- is were done on two cases between the exposed (refered to as E hereinafter) and the non-exposed (refered to as C hereinafter) of female and between A, B and C group of all examined.

TABLE 2.

The Number of the Exposed Residing in Nagasaki City (Feb. 1956. Naga-

saki City Office)

Exposed Male Female Total

Under 2000m 5.123 5.942 11.065

I

Over 2000m 19.481 25.920 45.401

Total 24.604 31.862 56.466

RESULTS

1) Anemia. Hemoglobin level below 80% was considered abnormal (anemic).

The distribution of Hb. level is shown in Fig. 1 and 2.

Percentage of under 80%

Fir. 1. Hemoglobin (Female).

(4)

Percentage of under 80%

Fro. 2, Hemoglobin (Radiation Symptom).

i) Female. In 1946 both E and C showed a tendency to anemia, which significantly marked in E (E = 71.4%,*3 C=43.5%, p<0.001). In 1947 C showed no more changes than in 1946, but the recovery from anemia in E was remarkable, so that the difference between the two groups was not significant (E=33.3%, C==

31.1%, 0.8<p<0.9). In 1948 the recovery from anemia was remarkable in C, but E showed no changes since 1947, so that the anemic tendency in E was signifi-

cantly high (E = 33.9%, C = 23.8%, p < 0.05). In 1953 E showed still definite tendency to anemia (E= 32.4%, C=22.4%, p<0.001), but in 1956 no significant difference was noticed between both groups, because the recovery from anemia was very remarkable in E (E=19.3%, C=19.2%, P>0.9).

ii) Comparison between A, B and C. In 1948 both groups A and B showed significant tendency to anemia comparing with C (A=36.6%0, 13=31.9%, C=23.8

%, p<0.001, p<0.001). No difference was noticed between A and B (p>0.5).

In 1953 the anemic tendency of these three groups decreased, however significant differences were still noticed between A and C, B and C (A=24.1%, 13=24.3%, C=13.3%/). In 1956 the recovery from anemia was remarkable in A and B, showing the almost same distribution of Hb. level as in C.

2) WBC count. The distribution of WBC count is shown in Fig. 3. WBC count above 10.000 and below 5.000 were considered abnormal (leukocytotic or leukopenic).

i) Female. In 1946 E showed a significant increase of leukopenia than C (E=11.7%/, C=1.4%, p<0.05). This leukopenic tendency in E was still present in 1947, however, no differences were noticed between E and C since 1948.

*r; Percentage of the subjects showing an abnormal value ,

(5)

Percentage of Leukopenia and Leukocytosis

(Female) (Radiation Symptoms)

Fm,, 3 , Leukocyte (Female).

ii) Comparison between A, B and C. No difference was noticed in 1948, 1953 and 1956 respectively.

3) Eosinophilia. The percentage of eosinophils in WBC differential is distri- buted as shown in Fig. 4. An analysis was performed on two cases of the abnorm- al increase ; one was applied to those above 10% and the other to those above 5%.

Percentage of Eosinophilia

(Female) (Radiation Symptoms)

Fin. 4, Eosinophils (Female),

(6)

i) In cases when above 5% was considered abnormal.

a) Female. Cases of eosinophilia were extremely high in C in 1946 (E=39.4

%, C=58.0%, p<0.05), however, in 1947 no difference were noticed between E and C (E = 54.1%, C = 57.5% ). In 1948 E showed a more significant increase of eosinophilia than C (E=57.1%0, C=39.1%, p<0.05) and the same relation was still noticed in 1953 (E=56.3%0, C=36.5%0, p<0.01). In 1956 no difference was noti- ced between both groups (E=40.8%0, C=37.1%0, p>0.05).

b) Comparison between A, B and C. In 1948 no significant difference was noticed between A and B, A and C (A=53.3%, 13=59.5%, C=39.0%, p>0.05, p>0.1), but the difference between B and C was significant (p<0.05). In 1953 A and B showed significant increases of eosinophilia than C (A=50.4%, 13=56.2%, C=43.4%, P<0.05, p<0.001), furthermore B showed a significant increase than A (p<0.01). In 1956 no significant difference was noticed between each group.

ii) In cases when above 10% was considered abnormal.

a) Female. The almost same courses were observed as in cases of above 5%.

In 1946 C showed a significant increase than E (E=12.7%0, C=34.8%, P<0.001).

No difference was noticed in 1947. In 1948 and 1953 E showed a significant increa- se than C respectively (in 194.8 E=22.1%0, C=15.4%, p<0.001 and in 1953 E = 26.2%, C=14.1%0, p<0.001). Furthermore in 1956 when there was no difference in cases of above 5%, E showed a significant increase than C (E =15.5%, C =11.0%, p<0.001).

b) Comparison between A, B and C. In 1948 no significant differences were noticed between each group. In 1953 A and B showed a significant increase than C (A = 21.2%, B = 25.6%, C =16.0%, p < 0.05, p < 0.001) and in 1956 A showed still a significant increase than C (A= 12.5%, C = 9.2%, p < 0.01). No differences were noticed between B and C, A and B.

4) Monocytes. The percentage of monocytes above 7% in WBC differential was considered abnormal. The percentage of monocytosis in each year is shown in Fig. 5.

(Female) (Radiation Sympoms)

Fie. 5. Monocytosis (over 7%).

(7)

i) Female. In 1946 C showed a significant increase than E (E = 9.6%, C = 34.8%, p< 0.001). In 1947 and 1948 there were no differences. In 1953 E show- ed a significant increase than C (E=25.3%, C=14.7%, p<0.001). No difference in 1956.

ii) Comparison between A, B and C. In 1953 A and B showed a significant increase than C (A = 25.7%, B = 24.5%, C =15.9%, p < 0.001, p < 0.001). In 1956 there was no significant difference at all between A, B and C (A=24.7%0, 13=24.1%, C = 23,9%).

5) Lymphocytes. The percentage of lymphocytes in WBC differential is distri-

Fin. 6. Lymphocytes (Female).

buted as shown in Fig. 6. No significant differences were found between E and C in female, and A, B and C each year.

TABLE 3.

Basophils

1953

T . 0 , 5 -1.01.5-2.0'2.5-3.0

R. S. (f) 1087 (35 382 .14) (7.26) 79 (1.47) 16 32

W R.S.(-) 1885 (40500)1 (7595) (1. 69)

Control I 361 60 15 7 (16.62)1 (4.98)1 (1.93)

1956

T. ~0.5-1.01.5-2.02.5-3.0

R.S.(-I-) 1477 (25 371 .12) (1.35) 20 (0.20) 3

Q

W R.S.(-) 1757 (20353 24 3

.09) (1.36) (0.70)

Control 1607 352 22 1

(21.91) (1.37) (0.06)

(8)

6) Basophils. Recently the occurrence of basophilia in the early stage of leukemia have been drawing attentions) and such two cases were experienced, who were found in the early stage at the mass surveys of survivors. The basophils count of those who showed basophilia above 2.0% on blood smear , were reexamined by a direct method using a Toluidin blue solution. The results are shown in Table 3.

There was no case showed the value ' above 3.0%, and no differences were noticed between E and C both in 1953 and 1956.

7) Leukocytes enzymes.

i) Peroxydase. Peroxydase index which was calculated on cytochemically stai- ned smear using the same method as the mean lobulation of nucleus by Sugiyama, showed no difference between E and C as shown in Table 4.

ii) Catalase and alkaline phospha- tase : The activities of catalase and alk- aline phosphatase of leukocytes which were separated by using the high mole- cular Dextran solution, were biochemical- ly determined by a permanganate meth- od and Fiske-Subbrow's method respec- tively. No differences were noticed bet- ween E and C as shown in Fig. 7.

TABLE 4.

Peroxydase Index of Neutrophils

No. Mean Max. Min,

°' R. S. (+) 47 ~ 2.931±0,027 3.35 2.42

W R.S.(-) 173 2.923±0.017 3.75 2,04

i

Control 1931 20884± 0.016 3.68 2.03

Fin. 7. Enzyme activities of leukocytes.

8) Finding of leukemia patients. At these mass surveys of A-bomb survivors,

one case of chronic myelocytic leukemia in 1953 and two cases of the same type in

1956 were detected. In the both cases the leukemia process was in the early stage

and the characteristics of blood pictures were basophilia, remarkable decrease of leuko-

(9)

cytic alkaline phosphatase and abnormal increase of leukocytic catalase. The other patient showed a typical picture of splenomegaly and remarkable increase of WBC count and juvenile granulocytes in spite of no subjective complaints when detected.

9) Classification of anemia in the exposed. The detailed reexamination was performed in 335 males and 529 females revealed the presence of anemia at the survey in 1953. The majority of anemia was macrocytic or normocytic, no difference in the rate of macro, normo, microcytic anemia being noticed between E and C. as shown in Table 5.

TABLE 5.

Classification of Anemia Male

MCV:94.1 MCV 80'0 MCVL79.9 MCV~79.9 Age R

. S. 94.0

MCHC~30.0 MCHC~30.0 MCHC~30.0 MCHC~29.9

5 A 6(21.57) 13(78.43) 19

I B 18(26.47) 45(66.17) 1(1.47) 4(5.82) 98

19 C 1(12 .5) 6(75.0) 1(12.5) 8

20 A 27(44.26) 31(50.81) 1(1.63) 2(3.27) 61

1 B 77(47.11) 68(42.23) 3(1.86) 13(8.07) 161

C 12(66.66) 6(33.33) 18

Female

Age R. S. MCV:94.1 MCV 94.0 MCVC79.9 MCV-79.6 T

MCHC:30.0 MCHC:30.0 MCHC:30.0 MCHC X29.9

5 A 6(46.15) 7(53.84) 13

1 B 9(27.27) 21(63,64) 3(9.09) 33

19 C 3(21 .44) 11(78.60) 14

20 A 23(25.84) 55(41.79) 5(5.62) 6(6.74) 89

1 B 47(25.68) 112(61.20) 4(2.19) 20(10.92) 183

40 C 13(36 .09) 21(58.30) 2(5.55) 36

41 A . 1(14.28) 6(85.71) 7

1 B 3(21.43) 8(57'14) 1(7.14) 2(14.29) 14

44 C 1(33 .33) 1(33.33) 1(33.33) 3

45 A 4(11.11) 29(80.56) 2(5.56) 1(2.78) 36

B 18(20.69) 55(63.21) 4(4.60) 10(11.49) 87

C 3(21.23) 8(57.14) 3(21.23) 14

(10)

FIG. 8. Myelogram of the exposed

(11)

10) Bone marrow picture of the exposed. The bone marrow aspiration was performed in 65 cases of the exposed during a period from August to December 1956. They were classified into four groups according to the distance from the hypocenter, namely within 1000m (A), 1000 - 1500m (B), 1500 - 2000m (C ) and over 2000m (D), and the results were compared with each other as shown in Fig. 8.

i) Total nucleated cell count and the ratio of granulocyte and erythrocyte (M/E). No differences were noticed among the four groups.

ii) Maturation of granulocyte. The mean values of the maturation ratio St + S

of A, B, C and D were 0.96 1.07

( Pro+M+Met ) (,u'=0.048); (p'=0.11),

1.11 (p'= 0.057) and 1.52 (fee = 0.26) respectively. The three groups A, B and C showed a significant decrease of the ratio compared with D respectively and A and B decreased significantly than C. No difference was noticed between A and B,

iii) Maturation of erythroblast. No differences were noticed between the four groups.

iv) Percentage of lymphocytes. The mean value of lymphocytes percentage of each group was 10.9%, 11.1%, 13.9%, and 16.7% respectively. A and B decrea- sed sgnificantly than D. No differences were noticed between C and D, A and C, B and C, A and B.

v) Plasmacell. No differences were noticed among the four groups.

vi) Megakaryocytes. According to the Morita's classification method"), the matu- ration ratio of megakaryocytes were calculated. The mean value of each group was

1.37, 1.36, 1.41 and 1.76 respectively and A, B and C showed a significant decrease than C respectively.

vii) No abnormality of mitosis was found in all cases.

DISCUSSION

The high rate of anemia in the control groups in 1946 is considered to be due to poor post-war conditions and took a smooth recovery course afterwards. On the other hand, the recovery from anemia in the exposed was slow, being about as the controls in 1.956. From these results the disturbance of the hematopoietic organs may be assumed to be due to the A-bomb radiation. Especially, the more remar- kable recovery of anemia in 1947 than in 1946 may indicate most clearly that the high rate of anemia in 1946 was caused by A-bomb radiation.

The WBC count of the exposed which showed a leukopenic tendency in 1946 and 1947, did not vary from the controls since 1948. This rapid recovery of leukop- enia and the slow recovery of anemia above mentioned consist with the general recognition that the reproduction of granulocytic series is faster than the erythrocytic one after the bone marrow injuries.

The change of eosinophilia in the exposed is very characteristic. It has been

already reported that eosinophilia appeared in the convalescence of acute A-bomb

radiation injuries3 ~ 4) 7) s) . As eosinophilia appears easily at allergic disease or parasite

infection, it is more difficult and dangerous to connect eosinophilia- noticed in the

exposed many years after A-bomb explosion with its radiation than anemia or variation

of WBC count. However, the incidence of eosionphilia in the controls showed a

gradual and remarkable decrease from the very high value in 1946 year by year.

(12)

On the contrary, that of the exposed increased from the relatively low value in 1946, maintaining high values till 1953 and then decreased, no difference being noticed comparing with the control in 1956. This specific course of incidence of eosinophilia in the exposed may show the relation with A-bomb radiation.

There is nothing specific. to say about lymphocytes and monocytes and baso- phils.

As mentioned above, it can be said in general that' the tendency of recovering to normal in the exposed who had taken an abnormal course in 1946, 1947, 1948 and 1953, was so remarkable that there was no difference from the control group in 1956. However, such conclusion was obtained from the statistical disposition of results of mass surveys as to peripheral blood picture alone. Therefore, the bone marrow examination was performed in 1956 and the maturation arrest of granulocy- tic and megakaryocytic series was noticed in the short distance exposed. It is no doubt that the reliability of clinical bone marrow picture is relatively low to deter- mine such maturation grade. However, considering the patterns of blastf ocus and perivascular blast-focus in the bone marrow which were histologically found in the exposed cases as a specific change 7- 11 years after the exposure, this maturation arrest may have some meanings. The incidence of leukemia in the exposed still shows a high rate and the significance to pursue the cause of individual case of the exposed who shows a deviation normal values is quite another problem from the results of statistical investigation. Such being the case, the importance of the medi- cal examination of an individual exposed person should not be disregarded in order to clarify the late effects of A-bomb radiation and to discover and treat the disease in the early stage. The detection .of leukemia cases in our mass surveys has presen- ted a good example.

CO-WORKERS: Michito ISIIIMARU, Takashi ITCGA, Shigeki TOYODA, Bunro WATANABE, Yasuro KAMCCHI, Noboru OZONO, Masazumi HAMASHIMA, Yo- shitane KIKITSU.

REFERENCES

1) KAGEURA, N. et al. Nagasaki Igakkai Zassi 30 : 232 (1955) (Japanese).

2) KAGEURA, N, et al. J. J. S. I. M. 43 : 762 (1955) (Japanese).

3) KiKUCHT, T. : The Report in the Effects and Influences of the A-bomb Explo- sion. p. 834. Japan Society for the Promotion of Science. Tokyo, 1953 (Japanese).

4) MASUYA, T. : The Fifth Report of Symposium on Hematology, p. 330. Nagai Co.

Osaka, 1953 (Japanese).

5) MOLONEY, W. C. : Texas Rep. Biol, & Med. 12 : 887 (1954).

6) MORITA, H. : The Fifth Report of Symposium on Hematology, p. 298. Nagai Co.

Osaka, 1953 (Japanese).

7) NAKAO, K.. : The Report in the Effects and Influences of the A-bomb Explosion, p. 649. Japan Society for the Promotion of Science. Tokyo, 1953 (Japanese).

8) SNELL, F. M. et al. : Arch. Int. Med. 84 : 569 (1953).

9) OSAJJMA, S. et al. : J. J. S. I. M. 47 : 1 (1958) (Japanese).

10) TOMONAGA, M. et al. : The Research in the Effects and Influences of the Nuclear Bomb Test Explosions, p. 1523. Japan Society of the Promotion of Science. Tokyo,

1956.

11) ToMONAGA, M. et al. : ditto, p. 1527.

TABLE  3.  Basophils    1953                     T .  0 , 5 -1.01.5-2.0'2.5-3.0        R
FIG.  8.  Myelogram  of  the  exposed

参照

関連したドキュメント

[r]

[r]

[r]

Effects of  Ketamine and Pr opofol on the Ratio of  Inter leukin-6 to Inter leukin-10

Found in the diatomite of Tochibori Nigata, Ureshino Saga, Hirazawa Miyagi, Kanou and Ooike Nagano, and in the mudstone of NakamuraIrizawa Yamanashi, Kawabe Nagano.. cal with

Calcule a distˆ ancia m´ınima e a capacidade do c´ odigo de repeti¸ c˜ ao q-´ ario de comprimento n e os mesmos parˆ ametros para o c´ odigo con repeti¸ c˜ ao q-´ ario

S49119 Style Classic Flexor Grade 7.0 Fixation Manual Weight 215g Size range 35 - 52 TECHNOLOGY-HIGHLIGHTS. •

のようにすべきだと考えていますか。 やっと開通します。長野、太田地区方面