Abstract
Over the years, Japan’ s inbound tourism has shifted from having a non-vital economic role to being seen as instrumental in reinvigorating the national and local economies. This shift in perspective has been steadily gaining traction as the number of inbound tourists increase, and with it, a corresponding increase in the economic impact of tourist spending. The Japanese government is now acutely aware of the potential of tourism such as its ability to create jobs, enable national and regional development and ultimately fuel economic growth. In fact, Prime Minister Abe has vowed to revitalize the economy by transforming Japan into a tourism country, and has set an ambitious goal to increase international arrivals to 40 million tourists a year by 2020.
In light of this bold initiative earmarking tourism as a vehicle for economic growth, this report will use secondary data to overview where Japan stands in terms of tourist arrivals and will analyze the strengths, weaknesses, opportunities and threats (SWOT) inherent in Japan’ s inbound tourism sector. The goal is to uncover any pressing issues that need to be addressed, and areas that can be improved or capitalized on to propel Japan’ s chances of meeting its 2020 goal. To this end, recommendations will also be provided to assist policy makers in planning for the future growth and development of the inbound tourism industry in preparing for 2020 and beyond.
Keywords:Japanese tourism, Japan’ s inbound tourism, tourism in Japan, SWOT analysis
Ⅰ Introduction
With the steady increase in international tourist arrivals to Japan over the years, and the capital Tokyo set to host the 2020 Olympic and Paralympic Games, the government has now conceded that inbound tourism is a vital economic activity for Japan. This was not always the case, inbound tourism was largely ignored by the government in favour of domestic tourism and Japan’ s developed industrial sectors that were viable income sources for the nation. In the past, Japan was not a popular destination for international tourists, and as such, this sector contributed very little to GDP and employment. In 2009, it contributed a mere 2.1% to GDP and 3.3% to total employment [JTA, 2013].
Leeja Russell
Assessing Japan’ s Inbound Tourism:
A SWOT Analysis
On a global level, Japan’ s ranking was 33
rdand 34
threspectively in 2002 and 2003 for the number of international visitors it received, lagging behind neighbouring countries such as Malaysia, Thailand, and Indonesia [UNWTO]. Ten years later in 2012, there was no improvement in Japan’ s world ranking; it remained 33
rdin the world and 8
thin Asia. The nation’ s international tourist revenue at that time was USD $15.1 billion ranking Japan 20
thworldwide and 7
thin Asia. Since 2013 however, Japan’ s commitment and ability to attract international tourists, and the economic benefits it has derived have seen radical improvement.
The Japanese economy has been in recession and domestic demand and spending remain sluggish. Adding new industries or expanding underperforming ones can allow the government to diversity the economy, and its export earnings. Tourism is one such underperforming sector with great income potential. David Scowsill president of the World Travel & Tourism Council (WTTC) said, “Governments looking for a sector which can create jobs and drive economic growth should focus on travel and tourism” [WTTC, 2015]. The government is taking notice and is judiciously placing new emphasis on expanding inbound tourism. The focus is on opening Japan’ s borders to capitalize on the increase in demand for travel to Japan especially among Asian tourists, and ensuring long-term benefits from hosting upcoming international sporting events. To this end, in 2010, the government created a goal of increasing inbound tourist to 10 million visitors annually. The goal was achieved three years later in 2013, apparently delayed due to the Tohoku earthquake and tsunami.
Since then, visitor arrival has exploded and has continued on an upward curve. In 2013, the government’ s new goal was 20 million inbound tourist a year by 2020, however, 19.73 million tourist graced Japan’ s shores in 2015, putting the government five years ahead of its 2020 deadline. Remaining resilient in further improving international arrivals, the government in a
Figure 1: The Japanese Government’ s Goals for Inbound Tourism by 2020
Source: Compiled from McKinsey & Company, 201619.7 3.5
25.2 11.6
40.0 8.0
70.0 24.0
0.0 10.0 20.0 30.0 40.0 50.0 60.0 70.0 80.0 90.0 100.0 Number of inbound tourists (millions)
Total expenditures by inbound tourists (trillion yen)
Cumulative nights spent in regions (million nights) Number of inbound repeat tourists (millions)
Tourism Goals
2015 actual 2020 target
bold initiative, has set its sights on doubling 2015 tourist arrivals to reach a new target of 40 million a year by 2020 (Fig. 1) [McKinsey & Company, 2016].
In light of this new initiative, what strengths and opportunities can the government can capitalize on and what threats and weaknesses does it need to overcome to meet its 2020 goal? This study relies on document analysis of tourism policy papers published by public organizations in addition to public reports, journals, newspaper articles and other forms of data to do a strength, weakness, threat and opportunities (SWOT) analysis of Japan’ s inbound tourism sector. The goals of this paper are to: (1) provide an overview of Japan’
s inbound tourism (2) explore the external opportunities and threats facing the industry (3)
study the industry’ s internal strengths and weaknesses and (4) give recommendations that policy makers can consider going forward based on the discoveries gleaned from the SWOT analysis.
Ⅱ Current State Of Inbound Tourism
Japan’ s inbound tourism is undergoing unprecedented growth since the island nation began focusing efforts on improving its attractiveness as a tourist destination. Starting with the Visit Japan Campaign launched in 2003, Japan has been taking steps to create an environment and an image conducive to international tourists. The results are paying off; visitor arrival has quadrupled since the start of the campaign in 2003. This upsurge in visitor inflow has also resulted in positive shifts in the economic contribution that inbound tourism is making to GDP and employment.
A. International visitor arrival
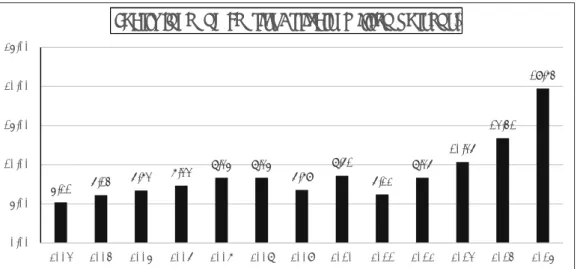
The rapid expansion in international visitor arrivals has made Japan’ s tourist sector the fastest growing in the world. In 2015, international tourist arrivals numbered 19.7 million exceeding outbound tourists for the first time in 45 years. This represented an annual increase of 47% compared to the global annual average of 5% [WTTC, 2015]. The following year
(2016) growth was more modest and inbound tourist arrival totaled 21 million representing a ten year increase of 287% over 2006. As can be seen in figure 2, most of this increase
(210%) occurred between 2013 and 2016; this is impressive since world tourism during this corresponding period increased an average of only 3% [WTTC, 2017].
This dramatic surge in bound tourist since 2013 can be attributed to: 1) the government’ s steadfast efforts, such as the relaxation of visa rules, to overhaul Japan as a tourist destination, 2) the devaluation of the yen and 3) improved ease of access to Japan for Asian tourists.
The easing of visa restrictions for ASEAN citizens has made Japan a vacation option for
more residents from these countries. As well, the issuance of multi-entry visas to Chinese
nationals has spurred an increase in the frequency of repeat visits to Japan from mainland
China. Vacationing in Japan has become more affordable. The steady depreciation of the yen,
which started in the middle of 2012, has made destination expenses cheaper in visitors’ local
currency thereby giving them more spending power. Added to this, the dramatic surge in
low cost carriers (LLCs), that ply domestic and international routes, has made air travel more affordable, particularly for the new middle class Asian traveller. These airlines have expanded seating capacity from areas such as Hong Kong, Taiwan, Malaysia and Thailand and this has triggered a dramatic increase in tourists from these countries [JTA, 2013a].
This influx of tourists is good news for Japan as its international profile is relatively weaker than its peers. In 2009, Japan ranked 33
rd, but in the last year alone it has climbed five
Figure 2: Yearly Number of Foreign Visitors to Japan
Source: Compiled from JTA, 2016b5.21 6.14 6.73 7.33 8.35 8.35
6.79 8.61 6.22
8.36 10.36
13.41 19.74
0.00 5.00 10.00 15.00 20.00 25.00
2003 2004 2005 2006 2007 2008 2009 2010 2011 2012 2013 2014 2015
Yearly Inbound Tourist Arrivals (million persons)
Figure 3: 2015 International Tourist Arrival Ranking
Source: Compiled from JTA 2016a83.70 74.76
65.00 55.62
48.58 39.81
33.01 32.61 29.85 29.0927.77 27.44 25.29 24.78 22.03 19.74
16.53 16.00 15.10 14.57 14.20 0.00
10.00 20.00 30.00 40.00 50.00 60.00 70.00 80.00 90.00
Inbound Tourist Arrivals Ranking (millions)
positions and currently ranks 19
thin the world for international tourist arrival [JTA, 2016b].
Despite this remarkable improvement however, Japan still lags behind other advanced nations, and along with Canada (ranked 18
th), it is the only G7 nation not in the top 10 on the WTTC ranking of international tourists arrivals [WTO, 2016] (Fig. 3).
B. Visitor Export
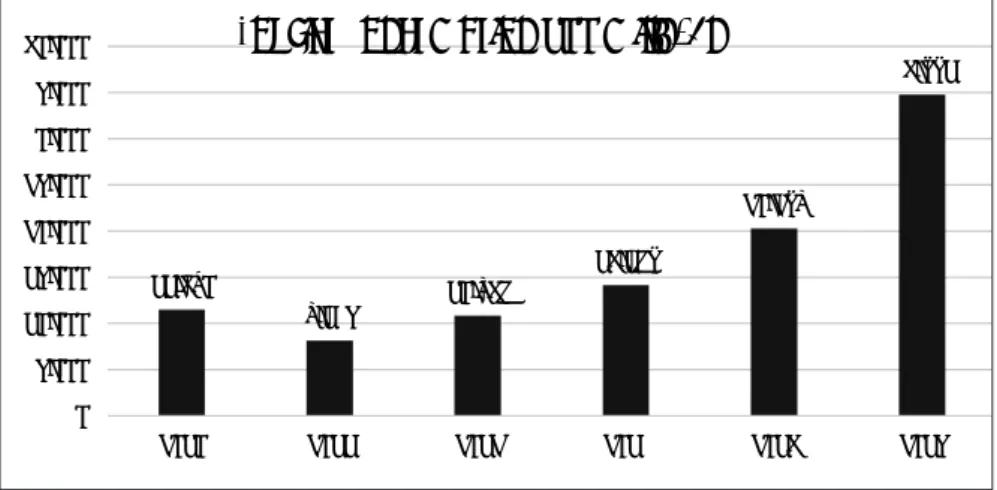
International tourist spending at a destination (visitor exports), is one of the factors used to measure the economic benefit and growth in tourism. In 2015, 19.7 million visitors spent a collective $32.4 billion (3.48 trillion yen), which represents a 74% increase from the $16.9 billion (2 trillion yen) spent in 2014 [Mizuho Research Institute Ltd., 2016] (Fig. 4). This absolute dollar amount earned Japan 22
ndplace worldwide, however when tourist spending is calculated as a percentage of total exports, Japan’ s 2.3% fell well below the world average of 5.7% thereby placing the nation at a dismal 160
thin the world. This is a stark indication that international tourist spending is significantly low relative to the size of Japan’ s economy.
Figures for 2016 were quite promising; there was noticeable growth and visitor export accounted for 4.4% of total exports; this allowed Japan to improve its ranking 17 places to 143
th[WTTC, 2017b] (Table 1).
Visitor export is highly dependent on visitor arrival. In the absence of deflation, visitor export tends to rise in tandem with an increase in the number of inbound tourists. Current visitor arrivals is a 47% increase over 2014 and visitor export saw an increase of 74%. Another boost to Japan’ s visitor export is the expansion of duty free items to cover food, beverages, cosmetics and other consumable products. Duty free products are now easily accessible as most retail stores, and especially in major metropolitan areas across the country, these stores process duty free rebates on the spot.
The biggest impact on visitor export may be attributed to the widening demographic of the
11,490
8,135 10,846 14,167
20,278
34,771
0 5,000 10,000 15,000 20,000 25,000 30,000 35,000 40,000
2010 2011 2012 2013 2014 2015
Tourist Consumption 100 mill. Yen
Figure 4: Tourism Consumption between 2012 and 2015
Source: Compiled from JTA, 2016aTable 1: Visitor Export Ranking: Nominal and Relative Contribution Total Exports 2016
Source: Compiled from WTTC, 2017b
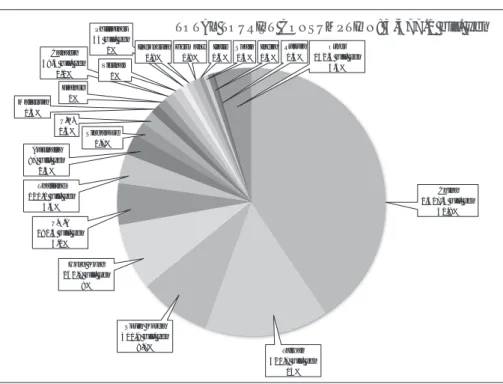
TOTAL TOURIST CONSUMPTION: 3,477.1 bill. yen
China 1,417.5 bill. yen
40.8%
Taiwan 520.7 bill. yen
15%
South Korea 300.8 bill. yen
8.7%
Hong Kong 262.7 bill. yen
8%
U.S.A 181.4 bill. yen
5.2%
Thailand 120.1 bill. yen
3.5%
Canada 39.5 bill. yen
1.1%
Phillipines 34 bill. yen
1% Other
152.6 bill. yen 4.4%
Australia 87 bill. yen
2.5%
Singapore 1.7%
U.K.
1.6%
Malaysia 1.3%
France 1%
Vietnam 1%
Indonesia 0.9%
Germany 0.8%
Italy 0.6%
India 0.4%
Russia 0.3%
Spain 0.5%
Figure 5: Breakdown of Tourist Spending in 2015 by Nationality
Source: Compiled from JTA, 2016amiddle and upper classes in China and Southeast Asian countries. This economic prosperity has led to more disposable income available for leisure and lifestyle related consumption.
Shopping accounts for as much as 41% of visitor spending in Japan. Among this, Chinese visitors have the highest average spending. Therefore, as long as Chinese account for a substantial part of visitor arrival increase, growth in visitor export will exceed arrival growth.
Chinese contribution to visitor export has remained high over the years. This spending trend may be attributed to bakugai or extreme shopping sprees by Chinese tourists. In 2014, average spending for Chinese tourists was 231,753 yen per person. Total Chinese spending in 2015 was 1418 billion yen accounting for over 40% of total visitor export [JTA, 2016] (Fig. 5).
C. Contribution to GDP and Employment
Two positive signs emerging from the expansion in inbound tourism in Japan are 1) its increasing contribution to GDP, and 2) the increase in employment opportunities that exist in the industry. International tourism spending is estimated to have generated approximately 630,000 jobs in 2015 alone, compared to 363,000 in 2014. Two industries account for more than half of total jobs generated. The retail sector benefitted the most with 129,000 new jobs, followed by accommodations, eating & drinking services with 39,000 new jobs. [Mizuho Research Institute Ltd., 2016]. This improvement is positive step in the right direction, however, the tourism industry’ s contribution to GDP and employment is still below the world average. Tourism accounts for ten percent of global employment generating a total of 292 million jobs worldwide [World Economic Forum, 2017]. Data from the WTTC for 2016 showed tourism’ s direct and total contribution to employment in Japan was 1.7%; and 6.9%
respectively below the world average of 3.6% and 9.6% and below that of other developed Table 2: Travel and Tourism Direct and Total Contribution to Employment
Source: Compiled from WTTC, 2017b
countries (Table 2).
Tourism’ s average direct contribution to world GDP was 3.1% and total contribution was 10.2%. Compared to this, Japan tourism had a direct contribution to GDP of 2.4% (ranking 141) and total contribution of 7.4% (ranking 126) [WTTC, 2017] (Table 3). Tourism will continue to make increasing contributions to the Japanese economy if factors remain favourable to attracting international tourists and the right blend of goods and services are offered to trigger visitor spending.
Ⅲ SWOT Analysis
A SWOT analysis is a well-known organization planning method for matching the internal strengths and weaknesses (SW) of a firm or entity against the external opportunities and threats (OT) in the environment. It identifies opportunities that can be seized immediately or in the future depending on the organization’ s strengths, threats that the firm need not worry about because it already has strong defenses, and threats against which the firm must bolster its defenses because it is susceptible. Once these internal and external factors that are favourable or unfavourable to the over-arching goals of the organization are identified, policies and effort can be directed towards maximizing strengths and using them to pursue opportunities, while eliminating or reducing weaknesses and bolstering against threats.
A. Strengths
Strengths in the tourism industry include internal factors that give advantages to a destination and make it more attractive to visitors than other areas. In this regard, Japan
Table 3: Travel and Tourism Direct and Total Contribution to GDP
Source: Compiled from WTTC, 2017
boasts positive traits that gives it such an advantage, however some traits are typical of developed countries or can be found elsewhere and are not unique. For example, Japan has first world infrastructure, a very developed air and ground transportation system, a wealth of historical monuments and attractions [World Economic Forum, 2013], easily accessible international ATM services and overseas credit cards are accepted at most stores and restaurants nationwide. Like many other destinations, incidences of terrorism has been few and the country has a lot of natural landscape. In addition to these shared traits, however, Japan has unique offerings and strengths that are not easily replicated or found in other places such as the following:
1 ) Strong Popular Culture Serves as Natural Marketing
Prior research has suggested that pop culture has the potential to trigger tourism [Seaton
& Yamamura, 2016]. Anime, video games, manga comic, cosplay, and characters are aspects of Japanese popular culture (J-pop culture) that are widespread overseas. As its global reach increases, fans all over the world are regularly consuming one or more forms of J-pop culture.
Manga sales in the U.S.A. alone totaled USD 70 million in 2013 [Alverson, 2014]. The annual Japan Expo, is a gathering dedicated to showcasing aspects of the J-pop culture such as video games, manga, J-pop music and more traditional art forms such as Japanese taiko (drums)
and martial arts. The convention started in Paris in 1999 with a little over 3000 fans; however, an estimated 247,473 fans attended the event in 2015. Japanese anime accounts for 60% of all animation broadcasted worldwide, with the ratio in Europe exceeding 80% [cited in Oohagan, 2007]. In Hungary for example, Japanese anime account for over 90% of anime aired on TV
[Cooper-Chen, 2010]. Japan is naturally marketed every time foreigners consume or actively seek out J-pop culture, this is because exposure to J-pop fosters fans’ interest in visiting Japan where the content was created. In fact, many exchange students to Japan had their first exposure to Japan through anime, video games or manga.
Recently, in the 2017 World Team Trophy figure skating competition, the women’ s world champion, 17 year old Evgenia Medvedeva from Russia, anxiously clutched a stuffed toy of the popular anime character Sailor Moon for comfort while waiting for her record-breaking score.
A few days later, she dressed as Sailor Moon in a performance that was broadcasted live to millions of viewers worldwide and now has over 2 million views on YouTube [espnW, 2017].
In essence, Japan’ s pop culture provides native (free) marketing worldwide and its fans are enthusiastic ambassadors of Japan and its culture.
What this means for inbound tourism is that avid aficionados of J-pop culture are a viable
source of prospective tourists now and in the future. It is much easier and cheaper to convert
such highly motivated fans into tourists than to educate and convert new prospects. In fact,
it is highly probable that some of these fans will make their way to Japan during their high
school or university years, while others are likely to choose Japan as a vacation destination
when they become working adults. Goods related to J-pop culture is also popular overseas,
and according to the Ministry of Economy Trade and Industry, the government is hoping that
the increased presence of Japanese cultural products will attract more international travelers
and boost domestic tourism (METI, 2012).
2 ) Well Known Traditional Arts
One of Japan’ s prevailing strength is its wealth of traditional arts that are globally recognised. Ikebana, kimono, judo, karate and chanoyu (tea ceremony) are common examples that have been propagated overseas and have dedicated non-Japanese practitioners. This is a great advantage for Japan as tourists are likely to choose a destination they are familiar with or have ties to. Naturally, visiting Japan is alluring to practitioners of these traditional arts however recently the trend towards experimental tourism is widely gaining popularity in Japan and travellers with no prior experience are also coming to Japan to dabble in these art forms.
Trends in inbound tourist spending are changing from conventional items like electric appliances and cosmetics, to cultural experiences [Mizuho Research Institute Ltd., 2016]. For tourists Japan offers a sweeping array of opportunities for such experiences such as learning simple chanoyu etiquette, dressing in kimono for a day, hand dying silk, and sake tasting.
As well, traditional Japanese cuisine (washoku) has been garnering interests overseas, in particular the ingredients used to create these meals. In 2013, washoku became a UNESCO Intangible Cultural Heritage and taking cooking lessons is now gaining popularity among inbound tourists. Japan’ s wealth of cultural assets is further validated by the World Economic Forum that ranks the nation Japan 4
thworldwide for its cultural resources as a whole, and 2
ndfor its oral and intangible cultural heritage [World Economic Forum, 2017].
3 ) Vastly Improved Language Environment
Language barrier was, and is still often quoted as a possible deterrent to inbound tourism.
In the past this was true, tourists had difficulties navigating Japan’ s highly complex transportation system due to signs and announcements being entirely in Japanese. Other service providers such as hotels, restaurants, banks and local attractions lacked non-Japanese signs and materials, and had staff with very limited English skills.
Big leaps have been taken in resolving these issues, and in recent years, Japan has undergone tremendous improvements in this area. The main transportation networks now bear alphabetized stations names and stops alongside the Japanese characters. Ticket vending machines, electronic displays and signs on buses, trains and subways are also alphabetized or translated into English to make them easier to understand. Many routes also boasts transfer guidance and other announcements in non-Japanese. In particular, Japan Rail the major rail network, has made great strides. Announcements, station platfrom signs and departure boards in English, are now standard at most Japan Rail stations and major stations of private railways [MLIT, 2016].
The heightened consideration for tourists is also evident by the increase in non-Japanese
signage and guidance displays in cities around the country. This is primarily due to
stakeholders that stand to benefit-such as shops, hotels and other businesses-playing their
part to improve the overall language environment. English menus are now standard at chain
establishments across the country and smaller restaurants have followed suit. In Kyoto city for example, the lack of an English menu is now the exception. English speaking staff is more widely available in service establishments of all kinds and it is now more possible than ever to get assistance in English without much difficulty.
Additionally, the number of tourist information centres have increased over the years and now exceed 800 offices nationwide. These offices provide assistance to travellers in English, Chinese and Korean in areas such as finding and booking accommodations, itinerary planning, and making transportation arrangements. These tourist information offices provide free wi-fi services, computer services for a nominal fee as well as brochures and pamphlets in English, Chinese, Korean and other languages [JNTO]. In the past, there was a focus on catering to English speakers however Korean and Chinese languages are increasingly being included in guidance materials for tourists.
4 ) Retained Tourism Income/Revenue
The industries most conducive to economic growth are those that produce the most household income and retain a higher share of expenditure within the local economy. Among tourist destinations there are large variations in the amount of tourism revenue retained in the economy; some countries experience far higher leaks than others partly due to imports and money remitted overseas by migrant labour [World Economic Forum, 2013]. A strength of Japan’ s tourism industry is that retained income is high, unlike other destinations such as Thailand, where it is reported that as much as 56% of all tourism income is leaked out of the economy [Lange, 2011]. For such nations, a great portion of tourism receipts are lost due to high levels of foreign ownership within the tourism sector as well as the high reliance on imported food and goods which are used to provide the tourist experience.
On average 28.7% of tourist spending in Japan is retained in the immediate local area of the prefecture where the spending occurs. The remainder is redistributed for outsourcing costs among other areas of the hosting prefecture and areas outside of the hosting prefecture
(this would include the cost of imports) [JTA, 2013a]. Japan is facing a shortage of labour, however for the moment, the nation’ s tourism industry is supported primarily by the local labour market. Destinations that have a high dependence on migrant labour like the United Arab Emirates, lose additional tourism income in the form of remittance to labourers’ home countries. There is an increasing trend for tourists to indulge in more experimental offerings
[Mizuho Research Institute Ltd., 2016] most of which are provided by locally owned business;
this puts the country in an even better position to retain tourist dollars in regional areas and
in the Japanese economy at large. Further adding to the high retained income is that the
demand for goods produced in Japan are high. This demand is particularly fueled by Chinese
tourists, who are the biggest spenders. Japanese products are considered safer and more
liable than those produced in their own country and this drives large spending sprees for
products made in Japan and contributes to retained income [Horn, 2009].
B. Weaknesses
Weaknesses are internal factors that might negatively affect a destination’ s ability to attract, and grow a healthy demand for its tourism product. A weakness for Japan is that inbound tourism was not a priority until recently and as a result, this sector is underdeveloped compared to its Asian neighbours and other developed nations. One reason for the neglect is that domestic tourism is very vibrant in Japan; in 2010, domestic tourism accounted for an estimated 90% of total tourism and its contribution to GDP. Foreign visitor spending on the other hand contributed less than 10%. A booming domestic tourism sector, fueled by stable demand also meant that the government had no impetus to invest in or promote tourism. In 2014, a mere 3.5% of the country’ s total capital investment was geared towards the tourism industry (global average 4.4%) earning Japan a rank of 133 in the world [WTTC, 2015]. As a result, Japan, although well-known globally as a technological giant, was relatively unknown as a tourist destination until the recent boom.
Another weakness that will become increasingly prominent going forward, is a labour shortage fueled by Japan’ s low birthrate. Inbound tourism demand is another reason for the labour shortage with accommodation and dining services facing significant shortages. This expected to worsen over time. Besides these issues, the following are pressing hurdles facing the Japanese inbound tourism sector that need to be addressed:
1 ) Narrow Market Source
A surprising 80% of Japan’ s inbound tourists are sourced from a very narrow market namely Asian countries. In 2015, of the 19.7 million tourists arriving in Japan, 84% (16.6 million) were from Asia. Europe and North America combined accounted for only 12% of visitor arrival, while pacific nations including Australia and New Zealand supplied a meager 2%. Four states: China, Korea, Taiwan and Hong Kong accounted for 85% of Asian tourists, with Korea (20%) and China (25%) combined supplying 45% of all international tourists to Japan. The gap between western and Asian source markets is expected to widen even more in the future as evidenced by the difference in growth rate in these two market sources. The number of Asian tourists has increased 360% between 2005 and 2015, in contrast their oceanic counterpart has increased only 170%; the growth for European and North American tourists is even less at 140% [JNTO, 2017].
An International Tourist Survey performed by the business consulting firm McKinsey, looked at how well destinations converted people who were interested in a destination to actual visitors. The survey has shed light on the reason for the large gap between Asian and western tourist arrivals-Japan is failing to convert westerners interested in visiting Japan into tourists who actually visit. The survey revealed that 54 to 62 percent of Asian tourists (Chinese and Thais) make the leap from thinking about visiting to actually visiting Japan. These numbers are in stark contrast to westerners from places such as Australia, USA and the UK where only 32 to 38% actually visited Japan even though they have a desire to do so (Fig. 6).
Japan’ s conversion of westerners into actual visitors is on average 5 points below that of other
top destinations such as Thailand and Indonesia [McKinsey & Company, 2016]. In order for Japan to expand its market source and reduce its reliance on Asian tourists, it needs to create an image that resonates with western markets. At present, Japan is like a beautiful woman at a dance that guys find too intimidating to ask for a waltz. Therefore, a top priority for Japan is to create destination marketing initiatives that depict Japan as approachable, and that can efficiently convert western travellers into actual visitors.
2 ) Disproportionate Weight in Regional Tourism
There is a high degree of concentration of tourist activities in a few areas in Japan. Not only do 80% of Japan’ s international tourists come from less than five countries, once in Japan, more than 80% of their activities are restricted to a few limited areas, namely Tokyo, Osaka, Kyoto, Kanagawa and Chiba [JTA, 2016]. A slight variation to this flow of tourist is the so called Golden Route (Tokyo, Hakone, Mount Fuji, Nagoya, Kyoto and Osaka) that has been popular particularly among travellers from China and Taiwan. The disadvantage is that the economic benefits of tourism are disproportionately distributed and these popular areas tend to be overcrowded putting pressure on the transportation system and available accommodation. Hotel occupancy rates in these five tourist towns far exceed those in other areas (Fig. 7).
Figure 6: Japan’ s Conversion of Asian Versus Western Tourists
Japan is continuously at risk of natural disasters, some require mass evacuation and reconstruction that lasts for months to years. A major disaster in any of these five main tourist areas would reduce the available destination options and may impact potential tourists’ decision to come to Japan. This would be similar to Thailand’ s experience when the 2004 tsunami in Phuket, a major tourist area, deterred tourists resulting in a drop in visitor arrivals to the nation [Ichinosawa, 2006]. What is needed is a dramatic expansion of tourist activities to outlying regions beyond these urban areas; this prevent overcrowding in major areas, distribute the economic benefits of tourism more equitably and lessen the risk associated with a negative incident in any one area. Dispersing tourist activities regionally can reduce these destination threats while making an economic impact on less popular areas.
3 ) Perceived as Expensive
An important consideration that affects customers’ decision to visit a destination is affordability [McKinsey & Company, 2016]. One of the primary underlying obstacles to expanding inbound tourism is that Japan is considered quite expensive. This negatively affects travelers’ decision to visit even when the yen is weak. One area where price is considered prohibitive is in lodgings. The cost of accommodation in Japan has been traditionally high for two main reasons: 1) domestic tourists consume short-term stays of one or two nights which commands higher prices, and 2) hotels in Japan charge on a per person basis. Inbound tourists however demand longer term stays at lower prices and are used to the pricing system in most countries where rates are charged per room.
However, despite these differences in consumption pattern Japanese hotels are being Figure 7: Total Number of Foreign Guest Nights in Japan by Region
Source: JTA, 2016b p. 34
misconstrued as being expensive. In fact, the average daily rate (ADR) for major cities Tokyo and Osaka was US $151 and $132 respectively which puts both cities cheaper than comparable cities such as Paris (US $286), New York (US $256) and Hong Kong (US $210)
[Savills World Research Japan, 2016]. The difficulty is that travellers thinking of coming to Japan are not comparing Japan to higher priced U.S.A. or Europe, but to its neigbours China, Korea and SE Asian countries like Thailand that offer cheaper options. A general peruse of popular online travel and lifestyle blogs, such as TripAdvisor and Quora, shows that commenters who believe Japan to be expensive tend to be those who have never visited.
While blog commenters who have visited Japan, at least once, are usually surprised at how affordable it is.
The reality is that Japan has become more cost effective over the years, so much so, that its cost-competitive ranking (94
th) has improved by 36 places from the 2013 when it ranked 130
thin the world [World Economic Forum, 2017]. While it is difficult to appease travelers on a very low budget, for the average mid-budget traveller Japan is not more expensive that visiting Europe or other developed countries. There are increasingly more reasonable options available for major tourist experiences including hotel accommodation, transportation and food; however, online promotion of low cost options is insufficient [McKinsey & Company, 2016]. Many potential travellers are still thinking of prices in Japan in terms of the bubble era.
Tackling this weakness will require a change in how Japan markets to potential visitors going forward. The country cannot afford to be subtle, marketing materials need to clearly show real, everyday prices for common tourist expenditures so as to educate the world that bubble era prices have been replaced with prices that rival other first world destinations.
4 ) Strict Visa Policy
Asia is Japan’ s best customer and the market holds potential for significant growth. In the past strict visa requirements severely limited the inflow of visitors from the region. Since 2000 however, Japan has been relaxing visa requirements for selected Asian nationalities, such as those from ASEAN nations, and has seen a dramatic rise in visitors from these countries in the years following. While improvements have been made, Japan still grapples with strict visa policies that rank it 112
thin the world [World Economic Forum, 2017].
Japan has complicated requirements for nationals of non-Asian countries that will potentially make it a challenge to widen its western tourist base. For example, nationals of Russia, NIS (former soviet countries) and the Middle East, not only require a visa, but in many cases their application require documents (purpose of invitation form, itinerary and a letter of guarantee) that need to be prepared by a guarantor who is a resident in Japan.
The guarantor is also responsible for the applicant’ s travel and accommodation expenses, and needs to guarantee the applicant’ s compliance with Japanese laws and regulations [Ministry of Foreign Affairs Japan, 2017].
A dilemna for Japan is that even though a more liberal visa stance would help to maximise
inbound Asian arrivals and attract more western tourists, it finds it necessary to forgo
these benefits in lieu of protecting its borders against, the likelihood of an influx of illegal
immigrants, terrorism and other negative consequences. If an appropriate visa liberization strategy can be created, then Japan stands to strengthen its tourism sector by tapping into new market sources for tourists while expanding existing ones.
5 ) Accommodation & Airport Capacity Constraints
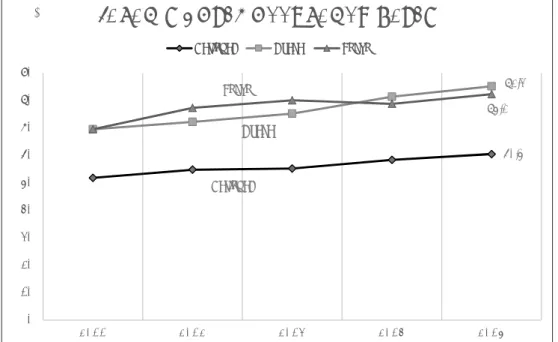
As the number of inbound tourists continue to rapidly increase, it has become obvious that the present supply of hotel rooms is inadequate to meet future demand. Average occupancy rate in Japan stands at 83.7% overall, and the situation is more critical in major tourists areas such as Osaka and Tokyo which boasts occupancy rates of 90.8% and 86.7% respectively
[Savills World Research Japan, 2016] (Fig. 8). Against this back drop of limited supply, expanding accommodation capacity is indespensable if the nation intends to host 40 million tourists per year by 2020.
Although Japan’ s average daily rate (ADR) falls well below that of other major global cities, further increases in the demand for hotel accommodation could spur upward movements in price as competition for available beds increase. While the number of hotel rooms is expected to moderately increase in Tokyo and other cities leading up to the 2020 Tokyo Olympics, the rate of increase has been low as a result of high construction costs. Therefore, an inability to meet growing accommodation demand is still a concern [Daiwa Kantei, 2015]. Japan cannot feasible meet its goal of hosting 40 million tourists per year by 2020 and maintain ADR at current levels with the present accommodation capacity.
National
60.5%
Osaka
85.2%
Tokyo 82.3%
0 10 20 30 40 50 60 70 80 90
2 0 1 1 2 0 1 2 2 0 1 3 2 0 1 4 2 0 1 5
( % )
JAPAN'S HOTEL OCCUPANCY RATES
National Osaka Tokyo
Figure 8: Changes in Guest Room Occupancy Rate
Source: Compiled from JTA and MLIT dataThe natural yearly increase in international tourist arrival combined with the expected influx of athletes and supporters for the 2020 Olympics makes not only lodgings but also airport capacity a real concern. Major airports Haneda and Narita which are the busiest ports of arrival for Japan, are currently operating at 86% and 95% capacity respectively [McKinsey
& Company, 2016]. To address this, both Haneda and Narita have plans to increase their capacity by a combined 80,000 flights per year by 2020.
A contributing factor to this issue, is that since 2000 the average seating capacity per airplane has reduced from 383 seats per plane to 278 seats for international flights arriving at Haneda airport. This is in part due to airlines using smaller airplanes and also the dramatic increase in LLCs. Between 2009 and 2014 flights operated by LLCs increased at Narita from 28 per week to 204 per week, and at Haneda, from none to 28 flights per week. More than half of these flights are from ASEAN countries [MLIT, 2016].
Lack of capacity extends beyond Tokyo. Japan’ s second largest airport, Kansai International
(KIX) has a capacity of 13.3 million international passengers a year. In 2016 it facilitated 12.4 million such travellers, which means it is operating in excess of 90% capacity [Kansai Airports, 2017]. A further drawback is that KIX offers direct connections to a very limited number of cities worldwide, however further route expansions are limited without a physical increase in airport capacity. This means new terminals and runways are needed, and an increase in capacity resulting from this type of construction requires years to come to fruition.
C. Opportunities
Global tourism is increasingly becoming more conducive to short and long haul travel. Easy access to and exposure to far off cultures have led to increased interest in overseas travel.
As a result, world tourism is slated to increase steadily at 5% annually over the coming years. This natural global market expansion, as well as the increasing prosperity of its Asian neighbours, are major opportunities for Japan. One of Japan’ s top opportunity is to take advantage of its close proximity to its biggest source of tourists and its ability to attract even more sub-sectors of tourists from this region as the respective economy grows. Other areas of opportunities for Japan to exploit are as follows:
1 ) Increase Marketing to Islamic Tourists.
Islamic tourism is defined as leisure travel by followers within the Muslim world. From a destination standpoint, it encompasses product development and marketing efforts designed for and directed at Muslims [Henderson, 2012]. Destinations have been paying increased attention to Islamic tourism as the market consistently expands. The typical Muslim consumer is described as young and educated, with a large disposable income, and forecasts suggest that Muslims will represent approximately 13.5 percent of world travel by 2020
[CresentRating, 2016].
This increase in Islamic tourism poses an opportunity for Japan to capture more visitors
from this segment. Currently, over 65% of the Muslims visiting Japan are from Southeast
Asia, predominantly Indonesia, Malaysia and Singapore. Between 2004 and 2013, the number
of Muslim visitors increased at an average rate of 7.2 percent year with an estimated 300,000 Muslims arriving in 2013. Most of the growth in this market occurred between 2012 (47%)
and 2013 (29%) due to Japan relaxing visa regulation for ASEAN member states including Muslim markets Malaysia and Indonesia. Growth is projected at 18.7% over the years to come
[CrescentRating, 2014]. While this initial visa liberalization initiatives have yielded desirable results from ASEAN countries, Japan needs to expand its source of Muslim tourists by tapping into high expenditure markets such as the golf states in the Middle East.
Many Muslims follow prescribed Islam practices even when travelling, as such, one of the keys to attracting more Muslims is to cater to their religious needs. Providing facilities to support these practices, so that Muslim travellers can experience satisfactory levels of hospitality, is an important concern for those engaged in Islamic tourism [Henderson, 2012].
In recent years, Japan has taken measures to cater to the special needs of this market segment and there have been improvements in the hospitality and travel atmosphere for Muslim tourists. For example, the nation’ s two busiest international airports Narita and Kansai, have installed prayer rooms and several restaurants now offer Halal meals. Still, more effort is needed since as of August 2015, only six out of ninety seven Japanese airports have both a prayer room and a restaurant offering a halal menu [Watanabe, 2014]. Even in major cities, lifestyle offerings for Muslim travellers are scarcely available. If Japan can further improve the halal environment and market these efforts effectively then it could procure increased flows of Muslim visitors not only from Asia but also from the Middle East. Tapping into this growing market will allow Japan to diversify its international visitor base that is heavily dependent on China and South Korea.
2 ) Leverage World Class MICE Events
Business travel makes a vital contribution to the economy of most developed and developing countries; it represents almost a quarter of the economic benefit from travel and tourism as a whole [World Economic Forum, 2013]. For Japan, business travel - exhibitions, fairs, conferences, negotiations etc. - represents approximately 30% of all inbound tourism.
Additionally, business travellers to Japan spend an average of 35% more than leisure travellers [JTA, 2013]. As such, increasing the number of business tourists can have a significantly impact on total visitor export.
Meetings, incentives, conferences and exhibitions (MICE) bring business tourists from all over the world for a pre-determined purpose. The MICE industry is one of the most rapidly expanding sectors of global tourism and the growth of MICE events in Asia exceeds the forecasted rate for the world [ICCA, 2015]. Although Japan ranks poorly for inbound tourism in general, it seems to fair better in the MICE arena where it ranks 7
thin the world and 1
stin Asia for the number of events it attracts (Table 4 and 5). In absolute numbers however it attracts only 355 events per year leaving a wide gap between itself and 6
thplaced Italy that hosted 504 events [ICCA, 2015].
MICE events, particularly academic conferences, are a great match for Japan. The nation
boasts 24 Noble Laureates the 7
thhighest in the world [World Atlas, 2017]. According to
OECD data, Japan has the 2
ndhighest nominal and 3
rdhighest percentage of GDP research spending in the world. Japanese academics are avid researchers earning Japan 5
thplace in the world for the number of papers published [SJR, 2014].
Asia is gaining momentum as a host region for MICE events and this is an opportunity
Rank Country # of Meetings
1 U.S.A 925
2 Germany 667
3 United Kingdom 582
4 Spain 572
5 France 522
6 Italy 504
7 Japan 355
8 China-P.R. 333
Netherlands 333
10 Canada 308
11 Brazil 292
12 Portugal 278
13 Republic of Korea 267
14 Austria 258
15 Australia 247
16 Belgium 216
17 Sweden 216
18 Turkey 211
19 Denmark 204
20 Switzerland 194
Table 4: 2015 World Rankings of Meetings Per Country
Note: Compiled from ICCA, 2015
Rank Country # of Meetings
1 Japan 355
2 China-P.R. 333
3 Republic of Korea 267
4 Australia 247
5 Singapore 156
6 Thailand 151
7 India 132
8 Taiwan 124
Malaysia 113
10 Hong Kong 112
Table 5: Asia Pacific & Middle East Rankings: Number of Meetings
Note: Compiled from ICCA, 2015
for Japan to improve its numbers. It is pivotal that Japan designs a competitive strategy and executes it rapidly since neighbouring destinations are offering world-class meeting facilities and are also aspiring to be a strategic destination for MICE events. Seoul for example, is being aggressive in its efforts to attract more MICE events. Their stated goal is “to increasing MICE visitors and their expenditure and to attain world top three convention city status”
[Rogers & Davidson, 2015]. In the past, Japan hosted 51% of MICE events in Asia but has lost ground to destinations such as South Korea, China and Singapore as they are attracting increasingly more events.
Japan does not have any cities that rank high for the number of meetings that it attracts.
There is a lot of room for improvement for Japan’ s individual cities; Tokyo, Kyoto and Osaka ranked 8
th, 13
thand 25
threspectively among Asia Pacific & Middle Eastern countries for the number of events they host [ICCA, 2015] (Table 6). At a glance this may seem like bad news, however, the Japanese market is unique in that international conferences have always been distributed around the country, rather than being confined to Tokyo and other large cities.
In fact, Tokyo accounts for only 23% of all international events held in Japan, and just 12% of total participants. By contrast, events in many other Asian countries are hosted primarily in capitals or other major cities [Okuyama, 2012].
Given Japan’ s academic record and world-class meeting facilities, it should actively pursue MICE events as a source of tourist dollars and re-establish its reputation as a country of intellectual assets. Since the country is set to host the 23
rdWorld Congress of Neurology in Kyoto, in 2017 (7000 attendees) [JTA, 2013] it can use its performance to leverage more international conferences of this magnitude in the future. Skewed regional distribution of tourists and limited market source are a weakness for Japan. Since a large portion of MICE
Rank City # of Meetings
1 Singapore 156
2 Seoul 117
3 Hong Kong 112
4 Bangkok 103
5 Beijing 95
6 Taipei 90
7 Sydney 86
8 Tokyo 80
9 Kuala Lumpur 73
10 Dubai 56
11 Shanghai 55
12 Melbourne 54
13 Kyoto 45
Table 6: Asia Pacific & Middle East Rankings: Number of Meetings Per City
Compiled from ICCA 2015