Defending the Yes No Test Nonword Approach with Regression Analysis
Raymond STUBBECenter for Language Studies, Nagasaki University
Abstract
Recent research has questioned the validity of the yes-no (YN) vocabulary test format. It has been found that YN test-takers who do not claim knowledge of any nonwords (zero false alarmers) still over- estimated their knowledge of the tested items, thereby questioning the effectiveness of the whole YN nonword approach. This study will demonstrate that the nonword approach should not be abandoned for two reasons. First, the results from the zero false alarmers in one study can be used to create a regression-based scoring formula for adjusting YN test results in a different study to better reflect those test-takers’
actual vocabulary knowledge as demonstrated on a translation (L2 to L1) test. Secondly, applying this regression-based formula to the simplest of the established YN scoring formula, h-f, accounted for the increases in over-estimation of word knowledge nonwords were originally designed to indicate. Practically half of the individually predicted scores (n = 455) fell within five percentage points (plus or minus 4.8 words of the 96) of her/his actual translation test score. Fully 85% of these scores were within ten percentage points of matching translation score. This suggests nonwords should be maintained, in conjunction with appropriate scoring formulae. Classroom implications are presented.
Keywords: yes-no vocabulary test; nonwords, pseudowords; regression analysis; L2 to L1 translation test; scoring formula
Introduction
Yes-no (YN) vocabulary tests have gained acceptance in L2 vocabulary research as an expedient way of measuring learner vocabulary knowledge in a relatively short
period of time (Meara & Buxton, 1987). The YN test presents learners with a list of words and has them signify their knowledge of each item by either checking (or circling) that word, or by selecting either “yes” or “no”. Read (2007, pp. 112 - 113) notes: “Despite its simplicity, the Yes/No format has proved to be an informative and cost-effective means of assessing the state of learners’ vocabulary knowledge, particularly for placement and diagnostic purposes.” As YN tests rely solely on self- reporting, the actual lexical knowledge of the students cannot be verified. One concern with this format is whether YN test results accurately reflect the test takers’
knowledge of the tested items, or do they overestimate the number of words actually known (Read, 1993, 2000). To compensate for the potential of students claiming knowledge of words they actually do not know the meaning of (over-estimation), nonwords, also called pseudowords, were introduced to the YN test by Anderson and Freebody (1983) testing first language (L1) readers. Nonwords were introduced to the field of second language acquisition by Meara and Buxton (1987). In such YN tests, claiming knowledge of a real word is known as a “hit”, while claiming knowledge of a nonword is called a “false alarm” (FA). Not claiming knowledge of a real word is labeled a “miss” and not claiming knowledge of a nonword is a “correct rejection”
(see Table 1).
Table 1. YN Test Responses
Item Yes No
Real word hit miss
Nonword false alarm (FA) correct rejection Note: Based on Mochida and Harrington’s (2006) Figure 1.
However, the relationship between self-reported and actual vocabulary knowledge remains unclear. Stubbe and Yokomitsu (2012) reported that Japanese learners could on average only provide correct Japanese translations for half the words they reported knowledge of on a YN test. Similarly, Waring and Takaki (2003) reported a 70%
difference between self-report and translation test results. Eyckmans (2004) in a series of experiments reported YN scores that were between 2.4% through 45.4% higher than matching L2 to L1 translation test scores (mean of 23.7% higher YN scores).
As introduced by Anderson and Freebody (1983), nonwords are commonly added to YN tests in order to detect such overestimation of actual vocabulary knowledge (Read, 2000). A number of scoring formulae have been devised which provide an
adjusted estimate of learner actual vocabulary knowledge by comparing counts of real words reported known to counts of nonwords reported known (e.g., Anderson &
Freebody, 1983; Meara & Buxton, 1987; Beeckmans, Eyckmans, Janssens, Dufranne,
& Van de Velde, 2001). The four established scoring formulae compared in Huibregtse, Admiraal and Meara (2002) are h-f, cfg, Δm and Isdt.
It remains unclear which, if any, of these scoring formulae is preferable for improving the predictive power of YN tests. Mochida and Harrington (2006) proposed a research design for examining and comparing the efficacy of these various formulae:
1) Give learners a YN test of L2 words, 2) subsequently give learners a graded test of the same words, also referred to as a criterion measure, and 3) correlate the criterion measure to the YN test as scored under the various formulae suggested by the literature, to determine which formula yields the highest correlation.
However, Mochida and Harrington (2006), comparing YN results with a subsequently taken multiple-choice vocabulary test, the Vocabulary Levels Test (VLT;
Nation, 1990; Schmitt, Schmitt, & Clapham, 2001) failed to detect substantial differences between the four established scoring formulae. As a result of such findings, the manner in which nonwords can effectively be used to adjust estimates of vocabulary knowledge derived from YN tests remains in question (Schmitt 2010, p.
201). Shillaw (1996) found little difference between YN tests results with or without nonwords and suggested that a Rasch misfit analysis would work just as well for identifying cases of over-estimation of lexical knowledge, at least for Japanese test- takers. Mochida and Harrington (2006) suggested that nonwords could be replaced with low-frequency words the test-takers are unlikely to be familiar with.
Pellicer-Sánchez and Schmidt (2012) also conducted a YN study, but added response time (RT) as one of the variables under consideration. Response times (RTs), meaning how quickly participants select either “yes” or “no” upon seeing a word, are based on “the assumption that faster responses would be more certain and accurate whereas more hesitant and inaccurate ones would be reflected in slower RTs”
(Pellicer-Sánchez & Schmidt, 2012, p.489). Personal interviews were chosen as the criterion measure to ascertain participants’ actual vocabulary knowledge in order to determine the amount of overestimation of vocabulary knowledge on the YN test. Of the two studies presented, their second study is directly related to this one. This second study compared the RT approach with the traditional YN scoring formulae approach. Overestimation rates were calculated for each level of false alarms on their YN test, zero through eight. It was found that the RT approach was best for those
students who did not check any nonwords (hereinafter zero-false alarmers). The best scoring formula for adjusting YN test scores for the false alarm levels of one through seven was h-f. Isdt was the best formula at the highest level of eight false alarms.
Pellicer-Sánchez and Schmitt (2012) first calculated two different criterion measures, labeled A and B, in their personal interviews. Under Criterion A students were presented with a card showing three possible answers (meaning recognition), but only after failing to recall a correct meaning for the tested word (meaning recall). “In
‘Criterion A’ ... one point was awarded if either meaning recall or meaning recognition were scored as correct responses. In the stricter ‘Criterion B’, one point was scored only if the meaning recall answer had been provided” (p. 495). These authors chose to use only Criterion B (meaning recall) as their criterion measure for comparisons with the four established YN scoring formulae for the same reasons that Waring and Takaki contend that the meaning recall (i.e., their L2 to L1 translation test) is the better measure of actual student knowledge of the tested words. Both studies explain that meaning recall ability is closer to the demands of natural reading, where glosses do not normally exist, than meaning recognition ability, where the test-taker is able to select or guess the correct meaning from a series of provided choices (Pellicer- Sánchez & Schmitt, 2012, p. 496; and Waring & Takaki, 2003, p. 149). For a full description of meaning recall versus meaning recognition see Laufer and Goldstein (2004, pp.405-407).
Similar to Mochida and Harrington (2006) and Shillaw (1996), discussed above, Pellicer-Sánchez and Schmitt (2012) also questioned the value of including nonwords in YN tests. Discussing, false alarms (FA) they found that:
... the absence of FA does not imply the absolute lack of overestimation. In fact, around 80%
(NS = 78.95%; NNS = 80.56%) of those participants who had not selected any of the nonwords in the Yes–No test still showed overestimation, as shown by the interview responses.
This is a crucial issue and questions the use of nonwords in Yes–No tests. If the purpose of including nonwords is to control for overestimation, but there is still overestimation in participants’ responses even when they did not select any nonwords, this questions the effectiveness of the whole nonword approach. (Pellicer-Sánchez & Schmitt, 2012, p. 500).
The nonword approach is based on two assumptions: the most reliable results come from those participants who do not check any nonwords (zero false alarmers); and, increases in nonword reports indicate increases in overestimation. This paper will demonstrate that the nonword approach should not be abandoned for two reasons.
Firstly, the results from the zero false alarmers in one study can be used to create a linear regression-based scoring formula for adjusting YN test results in a different study to better predict those test-takers’ actual vocabulary knowledge as demonstrated on a subsequently taken meaning recall translation (L2 to L1) test of the same items.
Secondly, applying this regression-based formula to the simplest of the established YN scoring formula, h-f, accounts for the increases in over-estimation of word knowledge that nonwords were originally designed to indicate. As the term suggests, h-f is calculated as: the YN hit rate, or the rate of “yes” reports, minus the false alarm rate, or the rate of nonword reports. In the following section, this paper will review the use of nonword data in YN tests, and discuss a relatively new method of scoring YN tests with regression formulae, which are based on comparisons of learners’ YN test results with subsequent meaning recall translation tests scores of the same words.
Background
Approaches to utilizing YN test nonword data
The use of nonwords in YN tests has remained common through present-day versions. Examples include Eurocentres Vocabulary Size Test (Meara & Jones, 1990);
and, EFL Vocabulary Tests (Meara, 2010). The proportion of nonwords to real words varies between tests, but usually falls between 25% and 40% (Pellicer-Sánchez &
Schmitt, 2012). All of the established YN scoring formulae utilize the hit rate (the number of hits divided by the total number of real words) as well as the FA rate (the number of nonword checks divided by the total number of nonwords). Accordingly, the differences between the proportions of nonwords to real words used in various studies do not impair comparisons.
As mentioned, the nonword approach is based on two assumptions: the most reliable results come from those participants who do not check any nonwords (zero false alarmers); and, increases in nonword checks indicate increases in overestimation.
There exist two approaches to utilizing YN test nonword data (Schmitt, 2010). One use, based on the first assumption that low FA rates indicate high reliability, is to set a maximum acceptable number of nonwords beyond which “the data are discarded as unreliable” (Schmitt, 2010, p. 201). Schmitt, Jiang, and Grabe (2011) set their acceptance limit at three (10% of their 30 nonwords), as did Barrow, Nakanishi and Ishino, (1999). Stubbe (2012a) demonstrated that a cut-off point of four (12.5% of the 32 nonwords) better suited those YN test results.
The other use of YN nonwords, based on the second assumption that overestimation
rates increase with rising FA rates, is to adjust the YN scores using a scoring formula.
The test results from learners checking nonwords are adjusted using a variety of formulae, to better reflect their actual vocabulary size (Beeckmans, et al., 2001).
Huibregtse, et al., (2002) found that their Isdt formula had the best prediction ability of the four correction formulae, but that the simpler h-f formula worked just as well under most conditions. Mochida and Harrington (2006) and Stubbe (2012b) similarly report that Isdt had the highest correlation of the four correction formulae with a subsequent multiple-choice test of the same items, while YN raw hits had the lowest correlation. Eyckmans (2004) however, comparing YN test results with a meaning recall (L2 to L1) translation test reported that the cfg formula had higher correlations than Isdt. Eight years following the Huibregtse et al. (2002) study, Schmitt (2010, p.
201) noted that “it is still unclear how well the various adjustment formulae work.” As reported above, Pellicer-Sánchez and Schmitt (2012) found that h-f was the best of the four scoring formulae, except at the extreme FA levels of zero and eight found in that study.
The four established YN scoring formulae
All of the four established YN scoring formulae (h-f, cfg, Δm, Isdt) use the variables h and f: where h denotes the hit rate, the number of hits (word reports) divided by the total number of tested words; and f denotes the number of FAs (nonword reports) divided by the total number of nonwords. The formulae for each of the traditional scoring formulae are:
h-f (Anderson and Freebody, 1983):
true hit rate = h-f cfg (Meara & Buxton, 1987):
h-f true hit rate = 1-f Δm (Meara, 1992):
(h-f) f true hit rate = 1- -
(1-f) h Isdt (Huibregtse, et al., 2002):
4h * (1-f) - 2 * (h-f) * (1+h-f) true hit rate = 1-
4h * (1-f) - (h-f) * (1+h-f)
Both h - f and cfg are based on the ‘blind guessing model’ where students either know a word or do not, and blindly (randomly) guess either ‘yes’ or ‘no’ when unsure (Huibregtse, et al., 2002). This model does not allow for the possibility of partial word knowledge, nor sophisticated guessing. The other two formulae, Δm and Isdt are based on Signal Detection Theory (SDT), which “provides an advanced model of correction for guessing behaviour (Nunnally and Bernstein, 1994)” (cited in Huibregtse, et al., 2002, p.233) that allows for partial word knowledge as well as sophisticated guessing.
It should be noted that each of the four scoring formula produce a rate, that is a number between zero and one. To allow for direct comparisons with test results, either those test results must be converted to rates or the formula results must be converted to words by multiplying each rate by the total number of tested words. The latter approach was used in this study.
Scoring formulae based on regression analysis
A newer form of YN scoring formula is based on regression analyses of learners’
responses on YN tests with subsequent graded tests of vocabulary knowledge. The use of nonwords in regression-based scoring formulae for YN tests was first proposed by Stubbe and Stewart (2012). Regression analysis was utilized because it allows for the prediction of scores on one test from scores on a different test (Tabachnick & Fidell, 2007). Using Mochida and Harrington’s initial research design, Stubbe and Stewart (2012) proposed a method for devising scoring formulae for YN tests that include nonwords using regression models. The procedure for this is as follows:
1) Learners complete a YN test that includes nonwords, followed by a criterion measure, such as an L2-L1 translation test of those same words;
2) A linear regression analysis is run on the data with learner scores on the translation test used as the dependent variable, and the count of real words reported known and the count of nonwords reported known as separate independent variables;
3) A scoring formula is created based on the resulting linear model (for example: True number of words known = 10 + (YN Score x 0.7) – (False Alarms count x 2), and
4) The accuracy of the resulting formula is evaluated by using it to predict the vocabulary knowledge of a separate, demographically similar group of learners who have similarly been tested under the design in step 1.
Stubbe and Stewart (2012), utilizing data from a previous study (Stubbe &
Yokomitsu, 2012) presented two regression-based scoring formulae. The initial formula was based on the entire item set of 120 real words and 32 nonwords (n = 69), and had an r2 of 45.2%. This formula was reported as “True number of words known
= 8.14 + (0.41 x YN Score) – (1.94 x FAs)” (Stubbe & Stewart, 2012. p.5). This initial regression-based scoring formula was improved by utilizing item analysis to select 40 of the 120 real-words on the YN test of Study 1 which had “the highest phi correlations to translation test results, and the 9 nonwords with the highest negative point biserial correlations to overall translation test scores” (Stubbe & Stewart, 2012, p. 6). After conducting a similar multiple regression analysis, the resulting prediction formula was reported as “True number of words known = 3.26 + (.51 x YN Score) – (2.39 x FAs)” and had an r2 of 59.1% (Stubbe & Stewart, 2012, p. 6). This improved formula is hereinafter labeled S&SRF (for Stubbe & Stewart regression formula).
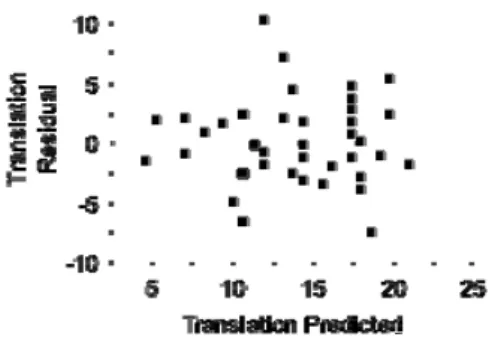
Following both of these regression analyses, residual plots were checked to ensure the appropriateness of applying regression analysis, as suggested in De Veaux, Velleman and Bock (2008). Both plots revealed that the residuals were reasonably evenly distributed around the regression line with no bending or thickening at either end, thereby confirming the appropriateness of using linear regression analyses.
Aim
The aim of this study is to determine the usefulness of a simple regression-based scoring formula, calculated using the YN and translation test results from only the zero false alarm participants in one study (Stubbe & Yokomitsu, 2012; hereinafter referred to as Study 1), and applying it to the h-f adjusted YN scores in a subsequent study (Stubbe & Hoke, 2014; hereinafter referred to as Study 2) for the prediction of matching Study 2 translation test results. The scoring formula h-f was selected because Mochida and Harrington (2006) reported that the “simpler h-f yields results which are comparable to the more complex cfg and Isdt formula (sic)” (Mochida and Harrington, 2006, p. 90). Stubbe & Hoke (2014) found that h-f was the best predictor of translation test scores compared to the other traditional formulae: cfg, Δm and Isdt; as did Pellicer-Sánchez and Schmitt (2012) for seven of the nine FA levels found in that study. To assess the effectiveness of this simple regression-based scoring formula, labeled 0FAsRF (for zero false alarm regression formula), its YN adjusted scores will be compared with those of the four traditional YN test scoring formulae as well as S&SRF.
As mentioned above, the use of nonwords in the YN test format is based on two assumptions: a) reliability varies inversely with FAs, thus the results from examinees who do not check any nonwords should be the most reliable; and, b) increases in FAs signal increases in lexical overestimation on the YN test. Using only the zero false alarm results from Study 1 to create the new YN scoring formula 0FAsRF tests the first assumption, and applying it to the h-f adjusted scores in Study 2 tests the second assumption. Generating 0FAsRF using only the zero false alarm data in Study 1 should address Pellicer-Sánchez and Schmitt’s (2012) concerns regarding the value of nonwords in YN tests.
The aim of this study can be put as a research question: Can the regression-based YN scoring formula 0FAsRF derived from one study significantly improve the ability of h-f adjusted YN scores to predict translation test scores in a different study, compared to the other available YN scoring formulae?
Methodology
As the regression-based scoring formulae employed in this study were derived from Study 1 data, for the prediction of translation test scores from YN test results in Study 2, the methodology employed in both studies is reviewed below.
Study 1 methodology
Study 1 uses data from an investigation into student knowledge of English loanwords versus non-loanwords (Stubbe & Yokomitsu, 2012). English loanwords are words that have been adopted into the Japanese language (L1), ““bargain” and
“helicopter”, for example. Non-loanwords are English words which have not been adopted into the Japanese language and thus remain in the L2 vocabulary. A sampling of four English loanwords (LWs) and four non-loanwords (NLWs) were randomly selected from the top half and the bottom half of each of the eight 1000 word frequency levels in the JACET List of 8000 Basic Words (JACET Basic Word Revision Committee, 2003); (see Note 1 for description; hereinafter the JACET8000).
Unfortunately three words were found to be in the wrong frequency level and one NLW turned out to be a LW. These four items along with a corresponding member from the opposite LW or NLW group at the same frequency level, had to be deleted from the item pool, leaving 120 items (60 LWs and 60 NLWs) of the original 128. A YN test was created containing these 120 words. It also contained 32 nonwords (25%
of original total of 128 real words). All items were randomly ordered. The nonwords
were randomly selected from Tests 101-106 of the EFL Vocabulary Tests (Meara, 2010). A decontextualized, single word translation test (English to Japanese) was also created which contained the same 120 words, randomly ordered. The L2 to L1 translation test format test was selected as the criterion measure because: a) translation ability is a strong indicator of which words students can actually understand while reading (Waring & Takaki, 2003); b) meaning recall, which this style of translation test measures, "essentially corresponds to the lexical requirements of reading and listening (the word form is encountered and the meaning must be recalled)" (Pellicer- Sánchez & Schmitt, 2012, p. 494); and c) “asking participants to provide mother- tongue equivalents of the target language words was the most univocal way of verifying (accurate) recognition” on the YN tests (Eyckmans, 2004, p. 77; accurate added by this author). Additionally, other leading vocabulary researchers agree that meaning recall L2 to L1 translation tests are an acceptable method of assessing the most important component of vocabulary knowledge, the form-meaning connection (Schmitt, 2010; Laufer & Goldstein, 2004; Nation & Webb, 2011).
Both the YN and translation tests used in the Study 1 were given to Japanese university students enrolled in mandatory English classes (n = 71). TOEIC© Bridge Listening & Reading Test scores for the participants ranged from 90 though 140, roughly equivalent to 200 through 395 on the TOEIC© Listening & Reading Test (Educational Testing Service, 2006), or very low A1 to mid A2 level of the CEFR (Educational Testing Service, 2015). The YN test was given at the beginning of a lesson. This was a paper test in which the students signaled whether they knew the word by filling in either a ‘Yes’ bubble or a ‘No’ bubble beside each item. The same students took the paper translation test towards the end of that same lesson in order to maximize the pairing of YN and translation tests. The YN test was scored by means of an optical scanner; the translation test was hand-marked a native Japanese teacher of English.
Forty of the 71 second-year test-takers in Study 1 did not check any nonwords (zero false alarmers). These forty YN test scores were used as the independent variable, with translation test scores for these same 40 as the dependent variable, in a simple regression analysis to create the YN scoring formula 0FAsRF, discussed below.
Study 2 methodology
To improve the separation between adjacent JACET8000 levels in the Study 2 (Stubbe & Hoke, 2014), words were sampled only from the bottom half of each level
(words 1501 through 2000 for the 2K level, for example). This was done to allow for clearer comparisons between adjacent levels. One effect of this was to eliminate 50%
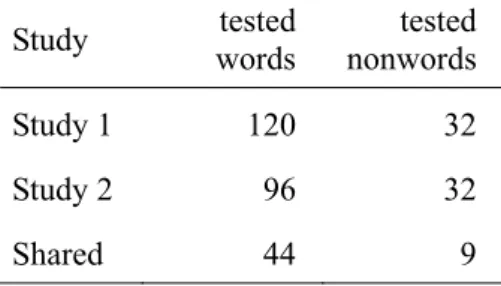
of Study 1’s items (60) from Study 2’s item pool. It was also decided to reduce the total number of tested items from 120 to 96; six LWs and six NLWs from each of the eight levels of the JACET8000. This was done to reduce the burden of marking the expected 400 plus translation test forms, but it also reduced the number of Study 1 items used in Study 2 by a further 16. Thus only 44 items from Study 1 were used in Study 2 (see table 2). Additionally, only the nine best predicting Study 1 nonwords, identified in the Stubbe and Stewart (2012) study, were used in Study 2.
Table 2. Items tested in and shared between Study 1 and Study 2 Study tested
words tested nonwords
Study 1 120 32
Study 2 96 32
Shared 44 9
Two tests were again created: a YN test with the 96 words, plus 32 nonwords; and a translation (English to Japanese) test containing the same 96 words. In both tests, items were randomly ordered. Participants in Study 2 (n=455) also took the YN test at the beginning of a class lesson. Again, this was a paper test in which the students signaled whether they knew the word by filling in either a ‘Yes’ bubble or a ‘No’
bubble beside each item. The same students (n = 455) took the paper translation test towards the end of that same class lesson in order to maximize test pairings.
Participants were all EFL students enrolled in one of four Japanese universities. About 40% of these participants had TOEIC scores in the 350 to 450 range. As in Study 1, the YN test was scored by means of an optical scanner. The translation test was hand- marked by three native Japanese raters. Inter-rater reliability was 92%, and Facets analysis (Linacre, 2012) indicated that the raters were basically equal with overall measures of 0.02, 0.02 and -0.04 logits.
Development of a new regression-based scoring formula, 0FAsRF
As discussed above, the S&SRF scoring formula was generated using test data from the Study 1. Following the item analysis that identified the 40 best predicting YN
words and nine best nonwords, a multiple regression analysis was undertaken in which these YN word and nonword scores were used as two independent variables, with matching translation test scores as the dependent variable.
The new 0FAsRF scoring formula (for zero false alarms regression formula) was generated using the same reduced item set of Study 1, but only for the 40 examinees who reported zero FAs on the full item set. Due to the absence of FAs, only a simple regression analysis was necessary, with YN real word scores as the sole independent variable and translation scores as the dependent variable. Prior to running this final regression analysis, a scatterplot of YN test results and translation test results for the 40 false alarmers was examined to check that the straight enough condition had been satisfied; it had. Results of this simple regression analysis along with the 0FAsRF scoring formula are presented in the Results section, below.
Data analysis
Descriptive statistics, correlations (Pearson Product-Moment), t-tests (two-sample assuming unequal variance) and the simple regression analysis used to create 0FAsRF were all calculated using the Data Analysis ToolPak add-in for Microsoft Excel 2010 (see Dodge & Stinson, 1999). Residuals were calculated using the Root Mean Square Error method (De Veaux, Velleman, & Bock, 2008) by squaring the differences between each translation test score and each matching YN prediction (YN hits, h-f, cfg, Δm, Isdt, S&SRF and 0FAsRF) summing those squares, calculating the means, and finally acquiring the square roots. Proximity of individual predicted scores were calculated by subtracting each participant’s translation test score from the YN hits, h-f, 0FAsRF predicted scores for that same participant. Differences between -4.8 and 4.8 of the 96 tested words were counted and included in the 5% category, and differences between -9.6 and 9.6 were counted and included in the 10% category. As the graphs produced by Microsoft Excel are not of journal quality, the residual plot mentioned above was created by running a standard least squares model in the statistical software package JMP 8 (SAS, 2009).
Results
As 0FAsRF was developed specifically for the present investigation, the descriptive statistics and results of the regression analysis are presented first, followed by the results of Study 2.
Developing 0FAsRF
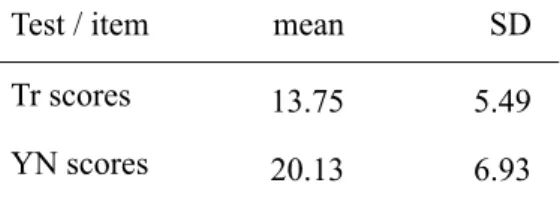
As discussed above, the YN scoring formula 0FAsRF was generated by running a simple regression analysis on the data from the 40 zero-false alarmers in Study 1 using only the 40 real words and 9 nonwords identified in the item analysis by Stubbe and Stewart (2012). The mean YN score for these 40 test-takers was 20.13 of the 40 real word items, which was 46.4% higher than mean translation score of 13.75 (see Table 3). The resulting regression had an r2 of .587 (see Table 4) and the coefficients for the variables were 1.513 for the intercept and .608 for the YN results (see Table 5).
Accordingly the formula for 0FAsRF was determined to be:
“True knowledge of tested words = 1.513 + (0.608 × h-f)”;
h-f because, as discussed above, it has been found that h-f had comparable or better predictions than the other established scoring formulae (Mochida & Harrington, 2006;
Stubbe & Hoke, 2014). Following this regression analysis, a check of the residual plot again revealed that the residuals were reasonably evenly distributed around the regression line with no bending or thickening at either end, thereby confirming the appropriateness of using linear regression analyses (see Figure 1).
Table 3. 0FAsRF Regression Analysis Descriptive Statistics (from Study 1 data; n = 40; k = 40 words, 9 nonwords)
Test / item mean SD
Tr scores 13.75 5.49
YN scores 20.13 6.93
Table 4. Regression Statistics (from Study 1 data; n = 40; k = 40 words, 9 nonwords)
Multiple R 0.766
R2 0.587
Adjusted R2 0.576
se 3.58
Observations 40
Note: se denotes Standard Error
Table 5. Regression Parameter Estimates
(from Study 1 data; n = 40; k = 40 words, 9 nonwords)
Coefficients se t Stat P-value
Intercept 1.513 1.38 2.36 0.02
YN score 0.608 0.06 8.43 0.00
Note: se denotes Standard Error
Figure 1. Residual plot of Zero FAs regression analysis (n=40, k= 40 real words and 9 nonwords) Study 2 results
Means and standard deviations (SDs) for Study 2’s YN and translation tests (Stubbe
& Hoke, 2014) are presented in Table 6. Similar to Study 1, the YN test means was considerably higher than the translation mean (48.82 versus 27.06, respectively). The reliability (Cronbach alpha) for these two tests was high at .96 and .92, respectively.
Table 6. Summary of YN and translation test results (n = 455, k = 96)
Test Mean SD minimum maximum reliability
YN hits 48.82 17.23 3 61 0.96
YN FAs 2.17 3.16 0 22 n/a
Tr score 27.06 12.16 3 61 0.92
Note: SD = standard deviation; Tr = translation test; reliability = Cronbach’s alpha; n = 455; k = 96 real-words and 32 nonwords on the YN test and 96 real-words on the translation test. The mean and SD figures reported in Stubbe (2013) were percentages, and are thus slightly higher.
Means, SDs, correlations with the translation test scores (r), and residuals for the four established scoring formulae as well as for the two regression-based scoring formulae, S&SRF and 0FAsRF, are presented in Table 7. It can be seen that 0FAsRF had the closest mean to the translation mean (27.23 and 27.06 words, respectively). A paired t-test between the translation test scores and 0FAsRF revealed that the difference between the means was not significant (t = .542, df = 454, p =.588, two- tailed). The effect size (Cohen, 1988) was very small at d = .015. The difference between their means of 0.17 (27.06 - 27.23) is much smaller than the difference between translation scores and the next closest scoring formula, S&SRF, which was 4.10 (27.06 - 22.96). A second t-test revealed that the difference between the translation mean and the S&SRF mean was statistically significant (t = 11.69, df = 454, p > .001, two-tailed; effect size was medium at d = .377). 0FAsRF also had the strongest correlation with translation test scores (.833), tied with h-f because, as mentioned, 0FAsRF was applied to the h-f adjusted scores. Finally, 0FAsRF had the smallest residual at 6.74 words, considerably smaller that the residual of S&SRF (8.53 words). For these reasons it was concluded that 0FAsRF was the best of the six scoring formulae.
Table 7. Means, SD, correlation with translation scores and residuals of the six scoring formulae (n = 455, k = 96)
Test / SF mean SD r residuals
TR Score 27.06 12.16 1.000 n/a
YN hits 48.82 17.23 .721 24.86
h-f 42.29 16.53 .833 17.88
cfg 45.46 17.50 .807 21.24
Δm 33.11 26.57 .739 20.35
Isdt 50.02 13.55 .775 24.61
S&SRF 22.96 9.39 .737 8.53
0FAsRF 27.23 10.05 .833 6.74
Note: SF denotes scoring formula; r = correlation (Pearson Product-Moment) with translation test scores; the four established scoring formulae (h-f, cfg, Δm and Isdt) each produce rates that have been changed to words by multiplying each rate by the total number of word items (96).
The strength of using regression analysis with zero FA results from one study to predict translation test scores from YN test results in a different study can be seen in the difference with h-f to which 0FAsRF was applied. Although the correlation with translation scores is unaffected, the 0FAsRF mean is considerably closer to the translation test mean of 27.06 than the h-f mean (27.23 versus 42.29, respectively), and the residuals are much smaller (6.74 versus 17.88). However, except for correlation, all the analyses thus far have considered only the various mean scores.
This next analysis will look at the predicted scores for each of the 455 examinees.
Proximity of individual predicted scores
In this analysis the score predicted by the YN test and the two scoring formulae, 0FAsRF and h-f were each subtracted from the translation test score for each of the 455 individual participants to evaluate the usefulness of the individual predictions.
Table 8 displays the number of individual participants with predicted scores within 5 percentage points (+ or - 4.8 of the 96 words), and 10 percentage points (+ or - 9.6 words) of his/her actual translation score. These percentage point values were selected because in Japan letter grades are normally given representing a score within a range of 10% (a C represents a score between 60% and 69%, for example). Thus a predicted score within 5 percentage points represents plus or minus half a letter grade, and a predicted score within 10 percentage points represents plus or minus one letter grade.
Compared to the YN and the h-f predicted scores, 0FAsRF, with 85.5% of predicted scores within 10 percentage points (or one letter grade), appears to predict translation scores reasonably well. The efficacy of using regression analysis to improve the YN test’s forecasting ability is demonstrated by these 0FAsRF predictions, which are substantially better than those of the h-f adjusted YN scores to which it was applied.
Table 8. Proximity of predicted scores to actual translation test scores (n = 455, k = 96)
Test / SF within 5% within 10%
YN hits 26 (5.7%) 69 (15.2%)
h-f 54 (11.9%) 136 (29.9%)
0FAsRF 251 (55.2%) 389 (85.5%)
Note: SF denotes scoring formula; within 5% denotes the number (and %) of participants with predicted scores within 4.8 words (5 percentage points); within 10% denotes predicted scores within 9.6 of the 96 words.
The robustness of the 0FAsRF can be seen in how well it predicted the scores for the FA outliers. FA reports in Study 2 were practically continuous from 0 through 16 (no reports at 12 FA counts). However, two test-takers reported 20 and 22 FAs. The 0FAsRF predicted score for the former was 16 percentage points above his/her translation test score. The predicted score for the later, the highest FA report, was within 5 percentage points of his/her translation test score.
Conclusion
This study has investigated the usefulness of a new regression-based YN test scoring formula, 0FAsRF, which was prompted by Pellicer-Sánchez and Schmitt’s (2012) questioning of the YN test nonword approach. The results presented above can be seen to validate two assumptions underlying the nonword approach: reliability varies inversely with false alarms; while overestimation varies directly with false alarms. 0FAsRF was generated using the YN and translation test results only from the 40 zero false alarmers in Study 1 (Stubbe & Yokomitsu, 2012). Based on the second assumption, 0FAsRF was then applied to the h-f adjusted YN scores in a different study (Study 2; Stubbe & Hoke, 2014) to predict those 455 test-takers’ scores on an L2 to L1 translation test. The adjusted YN test scores predicted by both regression- based formulae, 0FAsRF and S&SRF (Stubbe & Stewart, 2012), were compared with scores predicted by the four established scoring formulae; h-f, cfg, Δm and Isdt. It was found that 0FAsRF had the closest mean to the translation test mean and that its residuals were the smallest. Additionally its correlation with translation test scores was the highest (.833), tied with the h-f correlation. Moreover, the means of the 0FAsRF and the translation test were not significantly different. The effect size between the two means was similarly very small (d = .015). Finally, it was also found that for 55.2% of test-takers, 0FAsRF predicted scores were within five percentage points of their actual translation test score, and that 85.5% had predicted scores within 10 percentage points.
This study does suffer from a number of limitations. Studies 1 and 2 both investigated student knowledge of an equal number of loanwords and non-loanwords.
Likely other item sets will be comprised of different ratios of loanwords, or cognates, to non-loanwords/cognates. Whether and how this affects the effectiveness of 0FAsRF warrants further investigation. Also having an equal number of items from each level of the JACET8000 does not reflect the normal distribution of words in most texts.
How mix of item frequency levels affects the usefulness of 0FAsRF should also be
investigated. Further, the four institutions involved in this project were all Japanese universities, so the usefulness of 0FAsRF in settings outside Japan is uncertain and warrants further study. Finally, the English proficiency levels of the participants were quite low, and the difficulty of the tested items was quite high overall. How well 0FAsRF performs for higher level students, and/or easier item sets should also be investigated.
These results have implications for scholars as well as classroom teachers. For lexical researchers, the concerns raised in Pellicer-Sánchez and Schmitt (2012) regarding the effectiveness of the whole nonword approach seem to have been alleviated. The results presented above suggest that nonwords are valuable and researchers should continue including them in their yes-no vocabulary tests.
Classroom teachers, or foreign language programs administrators presently using translation tests to assess students’ lexical knowledge for non-grading purposes, could consider replacing the cumbersome translation test format with the easier to administer YN test format using the zero-false alarm regression approach outlined above. Compared to the timed-response approach described in Pellicer-Sánchez and Schmitt (2012), the 0FAsRF procedure may be more suitable for classroom teachers (and foreign language programs administrators) not having access to timed-response software. Before the next translation test session, give the same students a YN test of the same items that also include between 25% and 40% nonwords, (for a good selection of nonwords see Meara, 2010). After scoring both tests, the YN h-f adjusted scores are easily calculated in spreadsheet by following the h-f calculation procedure outlined towards the end of the Introduction, above. The scoring formula 0FAsRF,
“True word knowledge = 1.513 + (0.608 × h-f)", can then be applied to those h-f adjusted scores, and compared with the translation test scores, on a student by student basis. Should the scores predicted by 0FAsRF prove unremarkable, a revised 0FAsRF can be calculated. A regression analysis can be performed using the YN scores from only the zero-false alarmers as the independent variable and their translation scores as the dependent variable. A revised scoring formula can then be acquired from the Intercept and YN Score values listed in the resulting Regression Parameter Estimates table (see Table 5 above, for an example). To check the predictive ability of the revised formula, a second study with similar students and items using both testing formats can be undertaken. Should that revised formula prove reasonably accurate in predicting translation ability from the h-f adjusted YN scores, consideration could then be given to using yes-no test format to diagnose the vocabulary knowledge of students.
Thereafter, the reliability of the scoring formula can be re-evaluated by giving a sampling of the participants a translation test of the same items and comparing those results to their YN h-f predicted scores. Naturally, as YN tests do rely on student self- assessment, using them for high stakes purposes (assessing student grades, for example) is not encouraged. By periodically checking the accuracy of the YN h-f adjusted scores using the outlined sampling procedure, teachers and administrators can continue using 0FAsRF with confidence.
Notes:
1. Uemura and Ishikawa (2004, p. 335) provide the following description of the JACET List of 8000 Basic Words:
In 2003, the Committee of Revising JACET List of Basic Words published “JACET List of 8000 Basic Words” (thereafter JACET 8000). The JACET 8000 is a radically new word list designed for all English learners in Japan. This list is based on two kinds of corpora: the British National Corpus (BNC) and JACET 8000 sub-corpus.
Although the BNC consists of 100 million words, most of them are taken from British English texts that are several-decades-old, and English texts for learners are hardly included. Therefore, the committee has compiled a corpus of approximately six million words to supplement the BNC. Its data comes from the recent American newspapers, magazines, and scripts of TV program or cinema, and also from children's literature, junior or senior high school English textbooks, and various English tests conducted in Japan.
References
Anderson, R. C., & Freebody, P. (1983). Reading comprehension and the assessment and acquisition of word knowledge. In B. A. Hutson (Ed.), Advances in reading/language research (Vol. 2, pp. 231-256). Greenwich, CT: JAI Press.
Barrow, J., Nakanishi, Y., & Ishino, H. (1999). Assessing Japanese college students’
vocabulary knowledge with a self-checking familiarity survey. System, 27 (2), 223–247. doi: 10.1016/S0346-251X(99)00018-4
Beeckmans, R., Eyckmans, J., Janssens, V., Dufranne, M., & Van de Velde, H. (2001).
Examining the yes-no vocabulary test: Some methodological issues in theory and practice. Language Testing, 18 (3), 235-274.
Cohen, J. (1988). Statistical power analysis for the behavioral sciences (2nd ed.).
Hillsdale, NJ: Lawrence Erlbaum.
De Veaux, R., Velleman, P., & Bock, D. (2008). Stats: Data and models. Essex, UK:
Pearson Education Ltd.
Dodge, M. and Stinson, C. (1999). Running Microsoft® Excel 2000. Redmond, WN:
Microsoft Press. ISBN 9781572319356.
Educational Testing Service (2015). Mapping the TOEIC® Tests on CEFR.. Available:
https://www.ets.org/Media/Tests/TOEIC/pdf/ToeicBridge_Cmprsn.pdf
Educational Testing Service (2006). TOEIC® Bridge and TOEIC Score Comparisons.
Available: https://www.ets.org/s/toeic/pdf/toeic_cef_mapping_flyer.pdf
Eyckmans, J. (2004). Measuring receptive vocabulary size. Utrecht, the Netherlands:
LOT (Landelijke Onderzoekschool Taalwetenschap).
Huibregtse, I., Admiraal, W., & Meara, P. (2002). Scores on a yes-no vocabulary test:
Correction for guessing and response style. Language Testing, 19 (3), 227–245.
doi: 10.1191/0265532202lt229oa
JACET Basic Word Revision Committee. (2003). JACET list of 8000 basic words.
Tokyo: Japan Association of College English Teachers.
Laufer, B., & Goldstein, Z. (2004). Testing vocabulary knowledge: Size, strength and computer adaptiveness. Language Learning, 54(3), 399–436. doi:10.1111/
j.0023-8333.2004.00260.x
Linacre, J. M. (2012). Facets computer program for many-facet Rasch measurement, version 3.70.0. Beaverton, Oregon: Winsteps.com. Retrieved from:
http://www.winsteps.com//index.htm
Meara, P. (2010). EFL vocabulary tests. Swansea: Lognostics second edition.
Retrieved from: http://www.lognostics.co.uk/vlibrary/meara1992z.pdf
Meara, P. (1992). New approaches to testing vocabulary knowledge. Draft paper.
Swansea: Centre for Applied Language Studies, University College Swansea.
Meara, P. & Jones, G. (1990) Eurocentres Vocabulary Size Test, Version E1.1/K10.
Zurich, Austria, Eurocentres Learning Service.
Meara, P., & Buxton, B. (1987). An alternative to multiple choice vocabulary tests.
Language Testing, 4(2), 142-154.
Mochida, A., & Harrington, M. (2006). YN test as a measure of receptive vocabulary.
Language Testing, 23 (1), 73-98. doi: 10.1191/0265532206lt321oa
Nation, I.S.P. (2001). Learning Vocabulary in Another Language. Cambridge, UK:
Cambridge University Press.
Nation, I.S.P. (1990). Teaching and learning vocabulary. Boston, MA: Heinle &
Heinle Publishers.
Nation, I.S.P., & Webb, S. (2011). Researching and analyzing vocabulary. Boston, MA: Heinle.
Nation, P. & Beglar, D. (2007). A vocabulary size test. The Language Teacher, 31(7), 9-13. Retrieved from http://jalt-publications.org/tlt
Nunnally, J. and Bernstein, I. 1994: Psychometric theory. (3rd ed.) NY, NY: McGraw- Hill.
Pellicer-Sánchez, A., & Schmitt, N. (2012). Scoring Yes–No vocabulary tests:
Reaction time vs. nonword approaches. Language Testing, 29(4), 489-509.
Read, J. (2007). Second language vocabulary assessment: Current practices and new directions. International Journal of English Studies, 7(2), 105-125.
Read, J. (2000). Assessing Vocabulary. Cambridge, UK: Cambridge University Press.
Read, J. (1993). The development of a new measure of L2 vocabulary knowledge.
Language Learning, 10, 335-371.
SAS Institute Inc. (2009). JMP Version 8. SAS Institute Inc., Cary, NC, 1989- 2009.
Schmitt, N. (2010). Researching vocabulary: A vocabulary research manual. NY, NY:
Palgrave Macmillan.
Schmitt, N., Jiang, X., & Grabe, W. (2011). The percentage of words known in a text and reading comprehension. Modern Language Journal, 95 (1), 26-43. doi:
10.1111/j1540-4781.01146x
Schmitt, N., Schmitt, D., & Clapham, C. (2001). Developing and exploring the behaviour of two new versions of the Vocabulary Levels Test. Language Testing, 18(1), 55-88. doi: 10.1177/026553220101800103
Shillaw, J. (1996). The application of Rasch modeling to yes/no vocabulary tests.
Vocabulary Acquisition Research Group, University of Wales Swansea. Retrieved from: http://www.lognostics.co.uk/vlibrary/index.htm.
Stubbe, R. (2012a). Searching for an acceptable false alarm maximum. Vocabulary Education & Research Bulletin, 1(2), 7-9.
Stubbe, R. (2012b). Do pseudoword false alarm rates and overestimation rates in YN vocabulary tests change with Japanese university students’ English ability levels?
Language Testing, 29 (4), 471-488. Doi:10.1177/0265532211433033
Stubbe, R. (2013). Comparing regression versus correction formula predictions of passive recall test scores from yes-no test results. Vocabulary Learning and Instruction, 2(1), 39-46. doi: 10.7820/vli.v02.1.stubbe
Stubbe, R. & Hoke, S. (2014). Comparing YN test correction formula predictions of passive recall test results. In R. Chartrand, G. Brooks, M. Porter, & M. Grogan (Eds.), The 2013 PanSIG conference proceedings (pp. 72-78). Nagoya, Japan:
JALT. S
Stubbe, R. & Stewart, J. (2012). Optimizing scoring formulae for YN vocabulary checklists using linear models. Shiken Research Bulletin, 16(2), 2-7.
Stubbe, R. & Yokomitsu, H. (2012). English loanwords in Japanese and the JACET 8000. Vocabulary Education & Research Bulletin, 1(1), 10-11.
Tabachnick, B. & Fidell, L. (2007) Using Multivariate Statistics (5th ed.). NY, NY:
Pearson Education, Inc.
Uemura, T. & Ishikawa, S. (2004). JACET 8000 and Asia TEFL Vocabulary Initiative.
The Journal of Asia TEFL. 1, (1), 333-347.
Waring, R., & Takaki, M. (2003). At what rate do learners learn and retain new vocabulary from reading a graded reader? Reading in a Foreign Language, 15 (2), 130-163. Retrieved from:
http://nflrc.hawaii.edu/rfl/October2003/waring/waring.pdf.