A molecular dynamics study of Hras‑GTP complex and Hras‑GDP complex
著者 Miyakawa Takeshi
journal or
publication title
金沢大学大学院自然科学研究科博士学位論文, 112p.
number 2011
page range 1‑112
year 2012‑09‑01
URL http://hdl.handle.net/2297/34902
A molecular dynamics study of Hras-GTP complex and Hras-GDP complex
Takeshi MIYAKAWA
Division of Mathematical and Physical Science,
Graduate School of Natural Science and Technology,
Kanazawa University
2012
Acknowledgment
The doctoral thesis is a summary of my study from October 2009 to July 2012 at the Division of Mathematical and Physical Science, Graduate School of Natural Science and Technology of Kanazawa University.
I am very grateful to Professor Hidemi Nagao for fruitful discussions and encouragement of the study. I am very grateful to Professor Masako Takasu at Tokyo University of Pharmacy and Life Sciences for various discussions and advice. I would like to thank Professor Mineo Saito, Professor Tatsuki Oda, Professor Shinichi Miura, Dr. Hiroaki Saito and Dr. Kazutomo Kawaguchi at Kanazawa University, Dr. Ryota Morikawa at Tokyo University of Phar- macy and Life Sciences, Dr. Kimikazu Sugimori at Kinjo University,
Dr. Shuhei Kawamoto at National Institute of Advanced Industrial Science
and Technology, Professor Tetsuta Kato, Professor Yasuhiko Yamada,
Professor Akira Dobashi, and all colleagues at Tokyo University of Pharmacy
and Life Sciences for their advice and their supports. I also would like to thank all students at the computational biophysics group of Kanazawa Uni- versity for their advice and their supports.
Lastly, I thank my families, friends and colleagues for enduring supports.
Contents
1 Introduction 1
1.1 Background . . . . 1
1.1.1 The role of computers in biology . . . . 2
1.1.2 Signal transduction in the cell . . . . 12
1.1.3 Proteins . . . . 15
1.1.4 Cancers . . . . 17
1.2 Hras protein . . . . 20
1.2.1 G-protein . . . . 20
1.2.2 Small GTPase . . . . 21
1.2.3 Ras family . . . . 23
1.2.4 Hras . . . . 24
1.3 Overview of this thesis . . . . 27
2 Potentials of the Atoms around Mg
2+in the Hras GTP and
GDP Complexes 28
2.1 Introduction . . . . 29
2.2 Methods . . . . 35
2.2.1 H-ras GTP complex . . . . 35
2.2.2 H-ras GDP complex . . . . 39
2.2.3 MD simulations . . . . 40
2.3 Results . . . . 42
2.3.1 Differences in Mg-subsystem between H-ras GTP com- plex and H-ras GDP complex . . . . 42
2.3.2 Molecular orbitals in the Mg-subsystem . . . . 52
2.3.3 Differences in conformation between H-ras GTP com- plex and H-ras GDP complex . . . . 56
2.4 Conclusions . . . . 62
3 Molecular Dynamics Simulations of the Hras GTP and GDP Complexes 64 3.1 Introduction . . . . 65
3.2 Methods . . . . 66
3.3 Results . . . . 69
3.4 Summary . . . . 78
4 Discussion 80 4.1 Calculations of potential parameters . . . . 80
4.1.1 Atomic charge . . . . 80
4.1.2 Force parameters . . . . 82
4.2 Estimation of chemical reactions from the Kohn-Sham orbitals 83 4.3 Conformation in MD simulations . . . . 84
4.3.1 Averaged structures . . . . 84
4.3.2 Backbone Dihedral angles . . . . 84
4.3.3 RMSFs . . . . 85
4.4 Properties of the water molecules near the guanine nucleotide 85 4.4.1 RDF and the radius of the first hydration sphere . . . 86
4.4.2 Number of water molecules in the first hydration sphere 86 4.4.3 Duration time of the first hydration sphere . . . . 87
5 Conclusion 88 5.1 Calculations of potential parameters . . . . 88
5.2 Estimation of chemical reactions from the Kohn-Sham orbitals 89
5.3 Molecular dynamics simulations . . . . 89
5.4 Future work . . . . 90
Chapter 1
Introduction
In this chapter, we explain the background and overview of this thesis.
1.1 Background
In this section, the background of this thesis is explained. The computer is powerful tool for investigating the problems of biology. We investigate the Hras protein, which plays an important role at signal transduction in the cell. The mutation of Hras protein is often observed in the tumor cell.
Hras gene is considered as a proto-oncogene, which causes a canceration if
the carcinogenic mutation occurs. So in this section, we explain the role of
computers in 1.1.1, signal transduction in the cell in 1.1.2, proteins in 1.1.3
and cancers in 1.1.4. In 1.1.1–1.1.4, we use the description in Molecular Biology of the Cell 5th edition [1] as reference.
1.1.1 The role of computers in biology
In this subsection, we explain the role of computers in biology.
Aim of simulation
In only few cases, we can calculate analytically the physical properties of the
system. In many cases, we can calculate analytically the physical proper-
ties using some approximations. When we use the approximations, we can
hardly ascertain that the features of the results are caused by that approxi-
mations or by the real nature of that target system. The aim of simulation
is calculating the physical properties of the target system using the generic
approximations, such as discretization, numerical treatment instead of the
specific approximations of the target system. The relation of target areas is
summarized in the Fig. 1.1. Experimental study is limited by the experimen-
tal methods and the experimental equipment. Theoretical study is limited by
the theories about the target system. Analytical study is limited by the ap-
proximations which make analytical approaches possible. Simulational study
Figure 1.1: The relationship of target areas of experimental study and the- oretical study. Theoretical study includes analytical study and simulational study.
is limited by the approximations which make simulations possible.
Molecular dynamics of proteins
The first MD simulations of rigid body spheres were performed in 1957 by
B. J. Alder and T. E. Wainwright [2]. In 1964, A. Rahman performed
the MD simulations of spherical molecules [3]. In 1971, A. Rahman and
F. H. Stillinger performed the MD simulations about the rotation of water
molecules [4]. In 1977, J-P. Ryckaert et al. published a paper about the
SHAKE methods [5]. SHAKE is a constraint method on the bond length. In
1977, the MD simulations of the bovine pancreatic trypsin inhibitor (BPTI)
were performed in vacuum [6]. In 1980, H. C. Andersen performed the MD simulations of the constant pressure ensemble [7]. In 1981, M. Parrinello and A. Rahman performed the MD simulations of the constant pressure tensor ensemble [8]. In 1984, S. N´ ose performed the MD simulations of the constant temperature ensemble [9]. In 1988, W. L. Jorgensen et al. published a paper about OPLS (Optimized Potentials for Liquid Simulations), which is one of the famous general purpose potential [10]. In 1991, M. Saito performed MD simulations of human lysozyme in solvent with good results [11].
How to treat implicitly the water
In the ordinary MD simulations of the protein system, the speed of simu- lations is limited by the calculation time of the water molecules. In order to perform the MD simulations of the protein system, we can use the “im- plicit” method, without treating the water molecules explicitly. Instead of this method, treating the water molecules explicitly is the main stream in the MD simulations of the protein system. Here, I explain the basis of the implicit method and mention the outline of the method. I survey the range of use and the limit of application of the implicit method.
The implicit methods describe the way in which the free energy of sol-
vation is calculated approximately. In the approximated method, the free energy is divided into two parts: the polar part and the non-polar part. The non-polar part is calculated using the fact that this part is proportional to the accessible surface area (ASA), and the polar part is calculated by the continuous dielectric model. The fact is well known that ASA is propor- tional to the free energy of transfer of the process in which the nonpolar amino acid is transferred from the water solvent to the organic solvent such as ethanol [12]. The fact was shown that ASA is also proportional to the free energy of transfer of the process in which the amino acid is transferred from the vacuum to the water solvent [13].
When the polar part is calculated by the continuous dielectric model,
we use the approximation that the positions and the directions of the solva-
tion molecules change immediately for a given protein conformation. This
is based on the concept that the motion of the solvation molecules is much
more rapid than the motion of the protein molecules. Integrating only the
phase space of the motion of the solvent, the protein moves in the averaged
solvent environment, that is the parameterized environment. In order to
solve the problems in the continuous dielectric model, we need to solve the
Poisson-Boltzmann equations. However, these equations can not be solved
analytically. One of the approximate method of solving these equations is Generalized Born (GB) model [14, 15] reviewed in [16]. The GB model has the advantage of shorter time for calculation, and also gives the force, which is the gradient of the potentials. The force is needed for the MD simulations.
The implicit method is called GB/SA method, because in this method both GB and SA are used. Here, I mention an instance showing the limit of the GB/SA method. Watanabe et al. calculated the free energy depen- dence on the reaction coordinate, which is the distance between the O
1and the H
4in the Ace-Ala-Ala-Nme peptide in the water solvent, using both the method with explicit water molecules and GB/SA method [17]. The GB/SA model does not account for the hydrogen bond effect between the peptide and explicit water molecules. The GB/SA model tends to overestimate the frequencies of the structures, which are stabilized by these intra-peptide hy- drogen bonds.
The GB/SA method is appropriate for showing the capable structural
model. However, the GB/SA method is not appropriate for the the quanti-
tative calculations and not appropriate for the precise evaluation of the detail
of the water molecules such as the hydrogen bond of the water molecules near
the surface of the protein.
Molecular force field
Molecular model is based on the concept that the bond length, the bond angle and the dihedral angle in molecule are specified by the combination of atoms. Namely, the bond length, the bond angle and the dihedral angle in molecule do not depend much on the species but depend on the combination of atoms. A. W. von Hofman made the molecular model for the first time in 1860 [18]. J. H. van’t Hoff made the three-dimensional model of ethane, ethylene and acetylene in 1874 [19].
Molecular force field is also based on the same concept as mentioned above: the two-body forces, three-body forces and four-body forces in molecule do not depend much on the species but depend on the combination of atoms.
The basic concept of molecular force field is written by D. H. Andrews in 1930 [20]. F. H. Westheimer et al. applied the molecular force field to diphenyl using Born-Oppenheimer approximation in 1946 [21]. J. B. Hen- drickson calculated the structure of cyclohexane using electronic computer in 1961 [22]. K. B. Wiberg optimized the structures using the steepest descent method in 1965 [23]. P. De Santis et al. applied the molecular force field to the study of structures of a macromolecular substance in 1963 [24]. D. A.
Brant et al. applied the molecular force field to the study of structures of a
dipeptide in 1965 [25]. N. L. Allinger et al. applied the molecular force field to conformational analysis of hydrocarbons in 1971 [26].
The Born-Oppenheimer approximation is the approximation that we can separate the motion of electrons and the motion of nuclei. We can select the appropriate variables describing the relative positions of nuclei, and we can describe the potential energy by these variables. We use the following form of the potential V .
V =
∑i<j
E
Bond(r
ij)+
∑i<j<k
E
Angle(θ
ijk)+
∑i<j<k<l
E
Dihedral(φ
ijkl)+
∑i<j
E
NonBond(r
ij), (1.1) where E
Bondis caused by the bond length force, E
Angleis caused by the bond angle force, E
Dihedralis caused by the dihedral angle force, and E
NonBondis caused by the forces between not bonded atoms. In this thesis, we use the Amber force field describing in eq. (2.1).
In the above, we mentioned that the two-body forces, three-body forces
and four-body forces in molecule do not depend much on the species but the
combination of atoms. In fact, because the structures of molecules are dif-
ferent for the different electronic states even for the same species of atoms,
molecular force fields are different for the different electronic states. For
molecular force field, we take into account these differences using atomic types describing the electronic states of atoms in molecules. Strictly speak- ing, the number of the atomic types is needed for the different molecules.
However, for the realistic calculations, the number of the atomic types is from 20 to 30.
Using the molecular force field, we can estimate the stability of molecular structures, and this method is called molecular mechanics. We can also estimate the motion of the atoms in molecules with the equations of motion based on the molecular force field, and this method is typical molecular dynamics (MD).
Density Functional Theory (DFT)
The derivation of wave functions of electrons in molecules and atoms was
performed just after the establishment of quantum mechanics. The wave
functions could be derived analytically only for the rather simple system
with high symmetry. Instead of wave function, the electron density was tried
to explain the physical quantities of the electronic system in Thomas-Fermi-
Dirac model in 1920s. In 1950s, Slater determinant was used to approximate
the wave functions in many electronic systems. Based on these approaches, in
1960s, Hohenberg-Kohn theorem, which is the theoretical basis of DFT, was proved, and Kohn-Sham method, which is the practical method of DFT, was proposed. In 1970s, DFT was commonly used in solid-state physics. In 1980s, DFT was commonly used in other area of physics and chemistry. In 1990s, the exchange-correlation functionals in DFT were improved, and have been used in quantum chemistry. DFT has an advantage in treating electronic correlations, while it has a shortcoming in treating electronic exchange inter- actions. Recently, Lee, Yan and Parr functionals for correlation, and Becke’s 1988’s functionals for exchange are widely used. Hybrid type potentials are used in order to incorporate the exchange interactions in Hartree-Fock the- ory. Especially, Becke’s three parameters potential (B3LYP) is widely used.
These parameters are determined by fitting to the well-known systems, and there are no systematic method to improve the precisions of calculation.
Other methods to calculate the quantities in quantum systems with high accuracy are post-Hartree-Fock methods. These include MP (Moeller-Plesset) method, CI (Configuration interaction) and CC (Coupled Cluster) method.
In these methods, the linear combination of Slater determinants is used as
the wave function of the system.
Basis set
In practical calculations, the molecular orbitals need to be expanded by the well-known basis in both cases of molecular orbital method and Kohn-Sham’s DFT. Even for many atomic molecular systems, we can use the basis func- tions based on the hydrogen type atomic orbitals. We call the basis functions, which are the solutions of Schroedinger equation of hydrogen type atoms, as Slater type orbitals(STO). In molecular orbital method, most CPU time is spent in the calculation of the integration of the products of three quantities:
1) basis function, 2) potentials and 3) complex conjugate of basis. Since
STO has the form of exp( − α | r | ), the calculations take much time. On the
other hand, since Gaussian type orbitals (GTO) has the form of exp( − αr
2),
the calculations take less time. GTO has the round form around the origin,
while STO has the sharp form around the origin. A linear combination of
GTO can be fitted to the form of STO. This linear combination of GTO can
be regarded as a basis set, and is called contracted GTO (CGTO). On the
other hand, the “uncontracted” GTO is called primitive GTO (PGTO). For
example, we explain the meaning of 6-31G as the following; the number 6
means we use a CGTO consisting of 6 PGTOs for inner shell. The number
31 means we use a CGTO consisting of 3 PGTOs, and a PGTO for valence
shell. In order to take into account the polarization of electric charge in atoms and molecules, the basis with higher azimuthal quantum number can be added to the basis set. In 6-31G
∗, which is also denoted by 6-31G(d), six d bases are added to 6-31G for the atoms except hydrogen. In 6-31G
∗∗, which is also denoted by 6-31(d, p), three p bases are added to 6-31G
∗for the hydrogen atoms.
1.1.2 Signal transduction in the cell
Signal acts in various combinations and regulates the behavior of the cell.
Most of the signals in the cell is the local mediation substances. Some of them bind the outer surface of the cell and perform the transduction by the contact.
The signal transduction between the cells needs the signal molecule out- side the cell and the complementary receptor protein group which exists in the target cell and binds to the specific signal molecule. Most of the signal molecules outside the cell are hydrophilic and cannot pass the cell membrane.
These molecules activate the receptor proteins on the surface of the target
cell, and the receptor convert the outer signal to the inner signal. The inner
signal changes the behavior of the target cell.
There are three ways of the cell surface receptors to convert the outer signal: 1) ionotropic receptor is opened and closed, depending on the bind- ing neurotransmitter, 2) the G protein-coupled receptor (GPCR) indirectly activates and inactivates the membrane bound enzyme and the ion channel through the trimeric GTP-binding proteins. 3) enzyme linked receptor acts as a enzyme or acts with the other enzyme such as protein-kinase which phosphorylate the receptor of the target cell and the specific signal protein.
When the enzyme linked receptor and the GPCR are activated, series of inner signal proteins are activated and mediate the signals. Some of signal proteins convert, amplify or spread the signal, and some of signal proteins integrate the multiple signals from the different paths. Most of these signal proteins act as a temporary activated switch by the phosphorylation and the GTP binding. The target cell regulates the response to the extracellular signal using various mechanisms such as the feedback loop.
After the GPCR stimulates the G protein, the membrane bound enzyme
and ion channel are activated or inactivated. The structure of G protein
changes and the α subunit and βγ complex are activated. These regulate
directly the activity of the target protein on the membrane. Because the
signal transduction mediated by the GPCR is amplified largely by the chain
reaction, the thousands of target proteins are changed even when only one extracellular signal bind to the GPCR. The response mediated by the GPCR stops promptly when the extracellular signal is removed. The α subunit is stimulated by the target protein or by the regulator of G protein signaling, and the α subunit hydrolyzes the bound GTP to GDP leading itself inacti- vated.
There are various kinds of enzyme linked receptors. In mammalian cell,
there are many receptor tyrosine kinase (RTK) and tyrosine kinase associated
receptors. When the ligand binds the RTK, the cytoplasmic side area of
the receptor phosphorylates multiple tyrosine residues and activates kinase
making the multiple phosphorylated tyrosine, which is the junction site of the
series of intracellular signal protein through the SH2 domain or PTB. Some
juncture proteins act as the adapter of the receptor and Ras-GEF (Sos),
which activate the monomeric GTPase Ras. Ras activates three component
MAP kinase module, which phosphorylates the gene regulatory protein in
the nuclei, transmitting the signal to the nuclei.
1.1.3 Proteins
Most of the dry weight of the cell is made of proteins. Protein is not only the building material of the cell but also is responsible for most of the functions of the cell, such as the catalysis of chemical reaction in the cell and the outward and inward transport of substances across the cell membrane. Proteins are also involved with the signal transduction between the cells and the signal transduction from the cell membrane to nucleus. A small protein, kinesin, moves the organelle in the cell and topoisomerase disentangles a snarled DNA. Protein plays the central role of most of the functions in the cell.
Protein has complicated structure and sophisticated function, from the point of view of chemistry. The functions of proteins are rich in diversity.
The three-dimensional conformation of protein is determined by the amino acid sequence. The noncovalent bond interactions between the areas of polypeptide stabilize the folding structure of the protein. The amino acid with hydrophobic side chain tends to assemble in the inner area of the pro- tein, the structures of α − helix and β − sheet are formed by the local hydrogen bond between the peptide bonds close to each other.
Small protein is usually made from a domain, and large protein is made
from the domains connected by the polypeptide chains with various length.
A protein is not a hard lump, but its parts are moving. This mechanical motion is connected with a chemical reaction. This coupling of the chemical reaction and the mechanical motion gives the protein the ability to support the dynamic processes in the cell.
There is a mechanism leading an activity of protein by binding the specific molecule. The capacity of a protein to identify another molecule is important for the functions such as catalysis, signal receptor, switch, motor and small pump.
Protein is regarded as a chemical device. The function of the chemical device depends on the chemical characteristics of the surface of the molecule.
At the ligand binding site which exists in the hollow made by the folding of the protein, the amino acid residues are arranged precisely. These residues generate and cleavage the covalent bond in conjunction with each other.
Enzyme binds directly the high free energy transition state of the substrate and speeds up the reaction rate. Enzyme can perform acid catalysis and basic catalysis simultaneously. The reaction rate is usually very high and is limited only by the diffusion.
When the ligand binds to the surface of the protein, the protein deforms
reversibly. The allosteric conformation change caused by a ligand has the
influence of the binding of another ligand. The relation between these ligands is important for the regulation mechanism of the reactions in the cell. Using the chemical energy, the deformation of the protein can be pushed in one direction.
1.1.4 Cancers
The environmental factor promotes the start and the progress of the tumor.
The tumor promoter induces the inflammatory response and makes the local environments such as the change of the gene expression, the stimulation of the cell proliferation and the increase of the mutant cell population generated by the tumor initiator.
The important gene for canceration is classified into two groups, one is the gene in which the acquisition of the function causes the canceration, the other is the gene in which the loss of the function causes the canceration. The canceration is also called the malignant transformation. This is the process by which cells acquire the properties of cancer.
The gain-of-function mutation, which changes the protooncogene to the
oncogene, causes improperly the cell proliferation. An oncogene is a gene
that has the potential to cause cancer. The loss-of-function mutation of the
antioncogene abolishes the inhibitory function which helps suppressing the number of cell.
The oncogene is generally dominant, while the antioncogene is generally recessive. In tumor cells, they are often mutated or expressed at high lev- els. Most normal cells undergo a programmed form of death (apoptosis).
Activated oncogenes can cause those cells that ought to die to survive and proliferate instead. Anti-oncogene is a gene which protects a cell from one step on the path to cancer. When this gene is mutated to cause a loss or re- duction in its function, the cell can progress to cancer, usually in combination with other genetic changes.
The individual, who has both genes of deletion form and of functional form, tends to have tumor, because the tumor cell is generated when either the loss of normal gene or the loss-of-function mutation occurs.
Once the candidate gene is found, we can assess the importance of the candidate for the canceration using the mouse. If it is the candidate of the oncogene, we can use the overexpression. If it is the candidate of the antioncogene, we can use the inactivation.
The study of the embryogenesis and the mutant mouse is useful in the
elucidation of the functions of many genes important for the canceration.
Many of oncogene and antioncogene mutated in tumor cell direct the elements constructing the regulation pathway of the growth, division, differentiation and death of the cell.
DNA tumor virus occasionally promotes the canceration by generating the inhibitory protein of the product of the antioncogene.
The stepwise progress of the tumor is often related to the mutation in- volved with the activation of the specific oncogene and with the inactivation of the specific antioncogene. These relations are most understood in the colon cancer. The combinations of found mutation and epigenetic change are different from each other among not only different kinds of cancers but also different patients of the same disease. This means that these mutations occur randomly. However, the same type of mutation is often seen. In bi- ology, and specifically genetics, epigenetics is the study of heritable changes in gene expression or cellular phenotype caused by mechanisms other than changes in the underlying DNA sequence - hence the name epi- (Greek: επι- over, above, outer) - genetics. It refers to functionally relevant modifications to the genome that do not involve a change in the nucleotide sequence.
The prevention, diagnosis and treatment of the cancer is improved by the
recent understanding of the biology of the cancer.
The tumor cell has the following characteristics: 1) the dependence on the oncogene, 2) the loss of DNA repair mechanism, 3) the loss of the cell cycle checkpoint mechanism and 4) the loss of the regulation path of apoptosis.
For the development of the drug which thrusts the indispensable molecule to the proliferation and the survival of the cancer cell and kills the cancer cell, it is important to understand the regulatory mechanism in the normal cell and to understand precisely how the mechanism is destroyed by the cancer.
1.2 Hras protein
We investigate Hras protein, which belongs to Ras family. Ras family is a member of small GTPase, which belongs to G-protein. So, I start with the explanation of G-protein. In this section, we use the description in Ref. [27].
1.2.1 G-protein
G-protein is the abbreviation for guanine nucleotide binding protein, and is
a family of proteins which are involved with second messenger cascade.
1.2.2 Small GTPase
Small GTPase or small GTP binding protein is one of the family of GTP binding protein with small molecular mass (20-25 kDa). Small GTPase acts as a molecular switch of signal transduction in the cell, which binds guanosine triphosphate (GTP), hydrolyzes GTP to GDP and exchanges GDP for GTP.
The representative one is a product of proto-oncogene ras. Because each of small GTPase is highly homologous to ras protein, small GTPases is also called Ras superfamily.
Signal transduction
Although small GTPase is also called small G-protein, small GTPase is dif-
ferent from the G-protein in the narrow sense (trimeric G-protein) in many
aspects while small GTPase is partially similar to the trimeric G-protein in
the structures and the functions. Small GTPase acts as a molecular on/off
switch corresponding to the states binding GTP/GDP, which is controlled
by the proteins of GDP/GTP exchange factor (GEF) and GTPase-activating
protein (GAP). Small GTPase is associated with the regulations of various
functions in the cell, such as the multiplication of the cell, the differentiation
of the cell, the motion of the cell and the transportation of lipid vesicle.
Subfamily of Ras superfamily
More than one hundred kinds of Ras superfamily have been known. They are specified to five subfamilies, Ras, Rho, Rab, Arf and Ran by phylogeny.
Each subfamily has been known to have a specific function.
Ras family: A member of Ras family is located on the signal transduction pathway from the tyrosine kinase receptor, and is involved with the regulation of cell proliferation. While especially Ras and Rap have been investigated, Rheb is investigated recently.
Rho family: A member of Rho family is involved with regulation of the cytoskeleton. Especially RhoA, Racl and Cdc42 have been investigated in detail.
Rab family: A member of Rab family is involved with the vesicular trans- port.
Arf family: A member of Arf family is involved with the vesicular transport.
(A member of one of the families mentioned above can be lipid-linked (prenylated) and localized at plasma membrane.)
Ran family: A member of Ran family is involved with transport between
the nucleus and cytoplasm.
1.2.3 Ras family
Ras family (Ras protein, Ras subfamily) is a kind of small GTP binding proteins, and a molecule which is involved with many events in the cell, such as transcription, cell growth, acquisition of motility of the cell and inhibition of cell death. Because abnormal Ras is deeply involved with canceration of the cell, ras gene is a kind of proto-oncogene.
Because Ras was found in Rat sarcoma, Ras was named after that.
Ras has a mass of about 21 kDa, has a region binding GTP or GDP and has a region, named effector loop, which is for the interaction with PI 3-kinase (PI3K), Raf and Ral-GEF. Ras has a tail of lipid in C-terminal, which is used for anchoring Ras to plasma membrane. Cancerous Ras often has a missense mutation at Gly12 or Gln61, which is located in the part of GTP binding region.
Ras is in the inactivated state when Ras binds to GDP. When this GDP
is exchanged to GTP by guanine nucleotide exchange factor (GEF), Ras
is activated. It is known that Ras is activated through some molecules by
actual all receptor tyrosine kinase (tyrosine kinase receptor) (RTK), including
PDGF (platelet-derived growth factor), NGF (nerve growth factor) and EGF (epidermal growth factor) and so on.
1.2.4 Hras
GTPase Hras, also known as transforming protein p21, is an enzyme en- coded by human HRAS gene. Hras gene is located at 15.5 of short arm in chromosome 11, and is from 522,244 bp to 525,549 bp.
GTPase Hras is associated with the control of cell division in response to the impulse of the growth factor. The growth factor acts by binding the receptor on the surface of the cell extended in somatic membrane. Once acti- vated, the receptor promotes the signal transfer process, by which the protein and the second messenger mediate the signal from outside to nucleus and or- der cell to grow and divide. Hras protein is a GTPase, is an early player in many signal propagating pathways and binds somatic membrane by existence of the isoprenyl group at C-terminal. Hras acts as a molecular on/off switch:
once it turns on, it recruits and activates the proteins needed for propagating
the signal from the receptor, for example c-Raf or PI 3-kinase. Hras binds
GTP in the activated state, and has ability of intrinsic hydrolysis, in which
it dissociates the terminal phosphate of GTP and changes GTP to GDP.
With transferring of GTP to GDP, Hras turns off. The rate of transferring is usually slow, but can be speeded up drastically by the accessory protein of GTPase activating proteins (GAP), for example RasGAP. In turn, Hras can bind the proteins of the guanine nucleotide exchange factors (GEF), which force binding nucleotide to dissociate from Hras, for example SOS1. Subse- quently, Hras binds GTP in the cytosol, Hras-GTP is dissociated from GEF, and Hras is activated. Hras belongs to Ras family, which includes two other proto-oncogene Kras and Nras. These proteins are controlled in the same manner, and appear differently in the site of activation.
Costello syndrome
Costello syndrome is a disease whose properties are mental retardation, dis-
tinctive facial features and problems in heart. At least five mutations of
Hras gene have been identified in patients of Costello syndrome. Each of
these mutations changes one amino acid (single protein product element) of
the essential region of the Hras protein. The most common mutation substi-
tutes the 12th amino acid glycine by amino acid serine (denoted by Gly12Ser
or G12S). The mutations responsible for Costello syndrome lead to the pro-
duction of sustainable activated Hras proteins. These hyperactivated Hras
proteins order cells to grow and divide permanently, instead of triggering the cell growth in response to the proper signal from the outside of the cell. This uncontrollable cell division can lead to the production of the noncancerous and cancerous tumors. Although researchers are not sure how the mutations of Hras gene bring other properties of Costello syndrome (mental retarda- tion, distinctive facial features and problems in heart), overgrowth of the cell and unusual cell division may cause many symptoms and signs.
Bladder cancer
Hras has been shown to be a proto-oncogene. When mutated, proto-oncogene has potential to change the normal cell to cancerous cell. Some mutations of the gene are acquired in human’s life span, and exist only in some cells.
These changes are called the somatic mutation, and are not inherited. A somatic mutation of Hras gene in bladder cell is associated with bladder cancer. One typical mutation is often identified in bladder tumor. This mutation substitutes one amino acid of Hras protein to another amino acid.
Specifically, the mutation substitutes the 12th amino acid glycine to amino
acid valine (denoted by Gly12Val or G12V). Transformed Hras protein is
persistently activated in the cell. This hyperactivated protein orders cell to
grow and divide in spite of the absence of the signal from outside, and leads to the uncontrollable cell division and the formation of tumors. The mutations of Hras gene are also associated with the progress of bladder cancer, and increase the risk of tumor recurrence after treatment.
Other cancers
The somatic mutations of Hras gene can be associated with the progress of some other types of cancer. These mutations lead the Hras proteins which are always activated and can order cells to grow uncontrollably and divide.
Recent researches suggest that the mutations of Hras are observed in thyroid cancer and kidney cancer.
1.3 Overview of this thesis
In chapter 2, we describe the potentials of the atoms around Mg
2+in the Hras GTP and GDP complexes. In chapter 3, we show our calculations of molecular dynamics simulations of the Hras GTP and GDP complexes.
Chapter 4 is discussion, and chapter 5 is conclusion of the thesis.
Chapter 2
Potentials of the Atoms around Mg 2+ in the Hras GTP and
GDP Complexes
In this chapter, we study the quantum state around Mg
2+ion in the H-ras
GTP complex and in the H-ras GDP complex in order to understand the
hydrolysis of the GTP to GDP in the H-ras complex, which plays the key
role in overcoming human cancer. We calculated the force fields and the
atomic charges around Mg
2+ion in the H-ras GTP complex and in the H-
ras GDP complex in the B3LYP level using a basis functional set 6-31G**.
The calculation was performed in the subsystem consisting of the bases or the molecules which contain the oxygen having a coordinate bond to the Mg
2+ion. Our calculation shows that the oxygen atoms in both GTP and GDP bind tightly to the Mg
2+, although the oxygen atoms in the H
2O bind loosely. We performed MD simulations of H-ras GTP complex and H-ras GDP complex in solution using these potential parameters. We have shown that the structure differences between the H-ras GTP complex and H-ras GDP were found in the loop 2 and the loop 4 mainly. The loop 2 is the second loop and the fourth loop from the N-terminal of H-ras protein. Here, the loop 2 consists of 26–37 residues and the loop 4 consists of 58–68 residues.
2.1 Introduction
H-ras proteins, the products of the ras onco- and protooncogenes, are guanine nucleotide binding proteins, which act as molecular switch. In the active state, H-ras proteins are bound to guanosine triphosphate (GTP), and in order to switch to the inactive state, the γ-phosphate of the nucleotide has to be hydrolyzed. In the oncogenic mutation, this reaction is suppressed.
Understanding this reaction is very important to overcome human cancer,
Figure 2.1: The structure of the switch regions in the H-ras GTP complex (a) and in the H-ras GDP complex (b). The figures are drawn using the PDBID:121P (a) and PDBID:1Q21 (b). In (a), we substituted GTP in place of GCP in PDBID:121P.
because H-ras proteins frequently mutate to be activated in a variety of human cancer cells [28].
The structures of active H-ras GTP complex [29] and inactive H-ras GDP complex [30] have been investigated by x-ray crystallographical analyses.
These analyses revealed that there are structural changes in so called switch
I and II regions, which are around the nucleotide binding site, between the
two complexes. Fig. 2.1 shows the switch regions in the H-ras GTP complex
(a) and in the H-ras GDP complex (b). Switch I consists of 30-38 residues,
which form loop 2 and a part of β2 strand. Switch II consists of 60-72
residues, which form loop 4 and α2 helix (The names of loops, loop 2 and
loop 4, are shown later in Fig. 2.7.) It is known that the structural changes
described above arise from the differences of the following (a) and (b): (a) the coordination bond of Thr35 and the hydrogen bond of Gly60 in the H-ras GTP complex, (b) the coordination bond of Thr35 and the hydrogen bond of Gly60 in the H-ras GDP complex. [31–37]. It is also known that Thr35 and Gly60 are conserved in Ras family, and the mutation of these amino acids makes the hydrolysis of GTP slower [31–37].
In order to understand this hydrolysis, we have to know the structures of the H-ras GTP complex and the H-ras GDP complex with the solvent. We can sample these structures by molecular dynamics simulations. Parameter sets which are widely used for typical biological molecules are given in AM- BER force field [38]. When we perform the molecular dynamics simulation of the protein containing metal atoms or ions, we need the parameter set of the potential describing the displacement of the atoms around the metal particle.
However, the parameter set of the H-ras GTP complex and the H-ras GDP complex containing Mg
2+are not included in AMBER.
In the following, we mention the works of five papers on the calculations of
the parameters of the H-ras GTP complex and the H-ras GDP complex. (1)
Foley et al. performed MD simulations of the H-ras GTP complex [39]. In or-
der to perform MD simulations, they calculated the force field and the atomic
charges using 3-21G* basis set. They rescaled the atomic charges to the 6- 31G** basis set. However, the parameter was not included in their papers, and the treatment of the coordination bond between an oxygen and Mg
2+was not discussed in their papers. They used GAUSSIAN88 [40] for ab initio quantum mechanics calculations. Ab initio molecular orbital method they used is not mentioned in the paper. (2) Worth et al. calculated the atomic charges in the H-ras GTP complex and in the H-ras GDP complex [41]. They used the 3-21G* basis set and, only for the phosphorus. They added the sp- orbital wave function from 6-31G* basis set. They used GAUSSIAN88 [40]
for ab initio quantum mechanics calculations. Ab initio molecular orbital method they used is not mentioned in the paper. It is not clear whether the basis set is consistent with the present AMBER force fields and the atomic charges. They did not treat directly the coordination bond between an oxy- gen and Mg
2+. (3) Mello et al. performed the MD simulations of the H-ras GTP complex [42]. They used the parameter set for the proteins in the water of GROMOS. GROMOS is a force field for molecular dynamics simulation developed at the University of Gromingen and at Computer-Aided Chem- istry Group at the Laboratory for Physical Chemistry at the ETH Zurich.
The parameters of GROMOS are different from the parameters of AMBER.
In that paper, they did not write directly the force field and the atomic charges around Mg
2+. (4) Futatsugi et al. performed the MD simulations of the H-ras GTP complex [43]. They calculated the force field and the atomic charges around Mg
2+using 6-31G** basis set at the Hartree-Fock level. How- ever, their parameters were not written in their paper. The treatment of the coordination bond between an oxygen and Mg
2+was not discussed in their papers. (5) Kobayashi et al. performed the MD simulations of the H-ras GTP complex and the H-ras GDP complex [44]. They used the parameters for guanine nucleotides determined by Meagher et al. [45], in which the pa- rameters of the GTP-protein complex and of the GDP-protein complex were not calculated directly. The force fields and the charges around Mg
2+were not discussed in their papers.
In this chapter, we created the force field and charges for GTP and
Mg
2+in the H-ras GTP complex and for GDP and Mg
2+in the H-ras GDP
complex using Gaussian09 [46]. Calculations were performed in the B3LYP
level, using a basis set, 6-31G**. Namely, we calculated the force field and
atomic charges around Mg
2+explicitly with a large basis. We define the
Mg-subsystem as a system which consists of both Mg
2+and such molecules
and amino acid residue that contain oxygen having a coordination bond to
Mg
2+. We calculated quantum chemically the energy of the Mg-subsystem with various positions of the oxygen binding coordinately to Mg
2+, so that we obtain the parameter set of the potential of this system with respect to the displacement of the oxygen binding coordinately to Mg
2+. At the same time, we calculated the molecular orbitals and the atomic charges in the Mg- subsystem, so that we can use these in the molecular dynamics simulations.
Using calculated potential parameters, we performed the simulations of the H-ras GTP complex and the H-ras GDP complex. In order to check the validity of these potential parameters, we compare the results of these simulations with the results of Kobayashi et al [44]. They used the H- ras GNP (phosphoaminophosphonic acid-guanylate ester) complex structure (PDBID:5P21) as their initial structure of their calculation of H-ras GTP complex. In their paper, they call H-ras GTP complex as GTP
2bound state.
They performed MD simulations of GTP
2bound state and GDP bound state
for 50 ns. We compare our results with their results.
2.2 Methods
2.2.1 H-ras GTP complex
Definition of the Mg-subsystem of the H-ras GTP complex and optimization of the position of H atoms
First, we use the H-ras GCP complex structure (PDBID:121P) in the Pro- tein Database (PDB) as our initial structure of our calculation, where GCP (phosphomethylphosphonic acid guanylate ester) is the compound in which the oxygen atom of γ -phosphate in the GTP is replaced by the carbon atom.
This replacement is performed in order to reduce the rate of hydrolysis of γ-phosphate in the H-ras GCP complex. For this purpose, besides the H-ras
GCP complex, the guanosine 5
0-(β, γ-imido) triphosphate (GppNHp) H-ras complex and the 5
0-3-O-(thio)triphosphate (GTPγS) H-ras complex are used.
In this chapter, we used the structure of the H-ras GCP complex as in the
paper of Futatsugi et al [43]. Next, in our model structure, we replaced the
carbon atom in the GCP by the oxygen in order to calculate the potential
of the H-ras GTP complex. We added the hydrogen atoms binding to the
appropriate atoms in the complex, because the PDB file does not contain the
position of the hydrogen atoms. From the definition of the Mg-subsystem
Figure 2.2: The structure of the Mg-subsystem of the H-ras GTP complex
described in the introduction, the Mg-subsystem of the H-ras GTP complex consists of Mg
2+, GTP, H
2O172, H
2O173, SER17 and THR35. We focus on Mg
2+, because Mg
2+is thought to play a key role in GTP hydrolysis in H-ras GTP complex.
In Fig. 2.2, the structure of the Mg-subsystem of the H-ras GTP complex
is shown. We optimized the position of the hydrogen atoms so that the
position gives the minimum energy of the Mg-subsystem. In this process, we
use the Merz-Kollman charges [47] as the atomic charges in order to treat
the polarization of atoms in the Mg-subsystem efficiently.
The BOND terms and the ANGLE terms of the potential
We obtain the lengths and the angles which give the energy minimum. We also obtain the quadratic coefficients of the energy with respect to the length and the angles. The AMBER force field is basically determined by the fol- lowing potential,
V (r) =
∑bonds
K
b(b − b
0)
2+
∑angles
K
θ(θ − θ
0)
2+
∑dihedrals
(V
n/2)[1 + cos(nφ − δ)]
+
∑nonbij
(A
ij/r
12ij) − (B
ij/r
6ij) + (q
iq
j/r
ij), (2.1)
where b is the bond length, and K
bis the quadratic coefficient of the bond length b. θ is the bond angle, and K
θis the quadratic coefficient of the bond angle θ. φ and δ are the dihedral angles, and V
nis the coefficient. r
ijis the length between i-th and j-th nonbonded atoms, A
ijand B
ijare coefficients of the attractive and the repulsive parts of Lennard-Jones interaction between i-th and j-th nonbonded atoms, and q
iis the atomic charge of the i-th atom.
We call the first term as the BOND term and the second term as the
ANGLE term. We obtain the lengths b
0s, the angles θ
0s, the coefficients K
bs
and K
θs from the calculations below.
The BOND terms of the potential are calculated. We select a single oxygen atom which binds coordinately to Mg
2+. In order to change the length of the Mg
2+-oxygen bond, we move the position of the selected oxygen atom in the direction of the Mg
2+-oxygen bond. We calculated the energy of the Mg-subsystem of H-ras GTP complex. We obtain the optimized length which gives the minimum energy of the Mg-subsystem, and obtain the quadratic coefficients of the Mg-subsystem energy with respect to the Mg
2+-oxygen bond length.
The ANGLE terms of the potential are calculated. We select two
oxygen atoms which bind coordinately to Mg
2+. One of the two selected
atoms is moved on the plane which contains Mg
2+and two selected oxygen
atoms, in order to change the angle O-Mg
2+-O. We calculated the energy of
the Mg-subsystem of H-ras GTP complex. At the same time, other angles
change, so we use some relations together in order to derive the optimized
angle which gives the minimum energy of the Mg-subsystem, and we derive
the quadratic coefficients of the Mg-subsystem energy with respect to the
angle O-Mg
2+-O.
Comments on other potentials are followings. In general, we should obtain the optimized torsion angles and the quadratic coefficients of energy with respect to dihedral angles. In this chapter, we assume that we can neglect the dihedral term of the potential energy in the Mg-subsystem.
We mention the following for nonbonding terms. We assume that, even in the H-ras complexes, we can use the values of L-J parameters of the Mg
2+in water. For Coulomb terms, we use atom-centered charges calculated in the subsystem.
2.2.2 H-ras GDP complex
For the H-ras GDP complex, we did the same procedure as for the H-ras GTP complex except for the following part.
We use the H-ras GDP complex structure (PDBID:1Q21) in the Protein Database (PDB) as our initial structure of our calculation, where no substi- tute compound is used because GDP is stable in the H-ras GDP complex.
From the definition of the Mg-subsystem described in the introduction, the
Mg-subsystem of the H-ras GDP complex consists of Mg
2+, GDP, H
2O201,
H
2O202, H
2O203, H
2O204, and SER17. In Fig. 2.3, the structure of the
Mg-subsystem of the H-ras GDP complex is shown.
Figure 2.3: The structure of the Mg-subsystem of the H-ras GDP complex
2.2.3 MD simulations
We performed MD simulations for the H-ras GTP complex and for the H-ras GDP complex. The initial structures were obtained from the x-ray structures (PDBID:121P) for the H-ras GTP complex and (PDBID:1Q21) for the H-ras GDP complex.
All MD simulations were performed with the AMBER11 program [48].
Amber ff03 [38] with our modified potential parameters described above
around Mg ion was used for the proteins and ions, and TIP3P [49] was used
for water molecules. We modified the parameters for guanine nucleotides
originally determined by Meagher et al [45]. We used our modified param-
eters described above. The number of water molecules was 22,265 for H-ras
GTP complex and 21,740 for H-ras GDP complex. Ten Na
+counterions were
added for charge neutralization in the case of the H-ras GTP complex, and
six Na
+were added in the case of H-ras GDP complex. The particle mesh
Ewald method with cubic interpolation was applied to the long-range elec-
trostatic interactions. The cut-off length of the short-range Coulomb and the
van der Waals interactions was 12 ˚ A. Bonds involving hydrogen atoms were
constrained with the SHAKE algorithm. The water position was optimized,
while the atoms of the complex of protein and guanine nucleotide were re-
strained by harmonic potential. The temperature of the water was heated
up from 100K to 300K with a Langevin thermostat. Then the restraints of
the atoms of the complex of protein and guanine nucleotide were weakened
gradually under the NPT conditions at 300K. After the initial equilibration
period, an additional simulation was carried out under the NPT conditions
at 300K with a Langevin thermostat for about 1 ns. We used the pressure
coupling algorithms of weak-coupling variety, provided in Amber, analogous
to temperature coupling [50]. Pressure relaxation time was 1 ps.
2.3 Results
In this section, we show the results of quantum calculation of Mg-subsystem in 2.3.1 and the results of MD simulations of the H-ras GTP complex in water and the H-ras GDP complex in water in 2.3.2.
2.3.1 Differences in Mg-subsystem between H-ras GTP complex and H-ras GDP complex
In this subsection, we show the results of quantum calculation of Mg-subsystem.
We show the total charge, the atomic charges, and the parameters in the BOND term and in the ANGLE term. We also show the molecular orbitals in the followings.
The total charge of Mg-subsystem
When we calculate the energy of the Mg-subsystem of H-ras GTP complex
quantum chemically, we put the charge of the Mg-subsystem as − 2, because
the charge of Mg
2+is +2, the charge of GTP is − 4, the charge of H2O is 0,
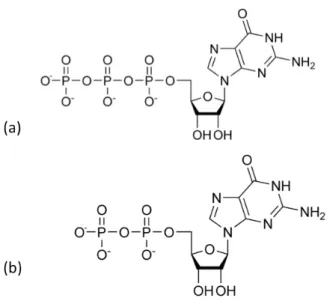
and the charge of amino acid residue is also 0. In Fig. 2.4 (a), the chemical
structure of GTP is shown.
Figure 2.4: The chemical structure of GTP (a) and GDP (b)
On the other hand, when we calculate the energy of the Mg-subsystem of H-ras GDP complex quantum chemically, we put the charge of the Mg- subsystem as − 1, because the charge of Mg
2+is +2, the charge of GDP is
− 3, the charge of H2O is 0, and the charge of amino acid residue is also 0.
In Fig. 2.4 (b), the chemical structure of GDP is shown.
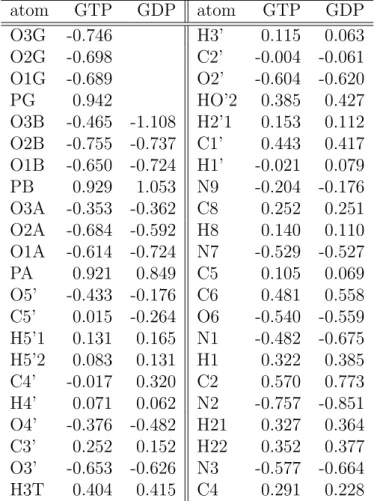
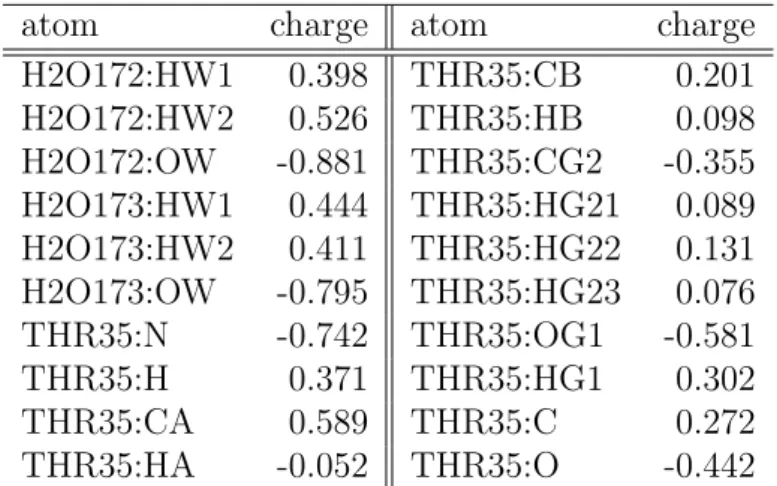
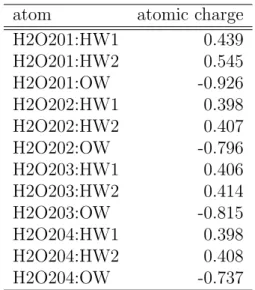
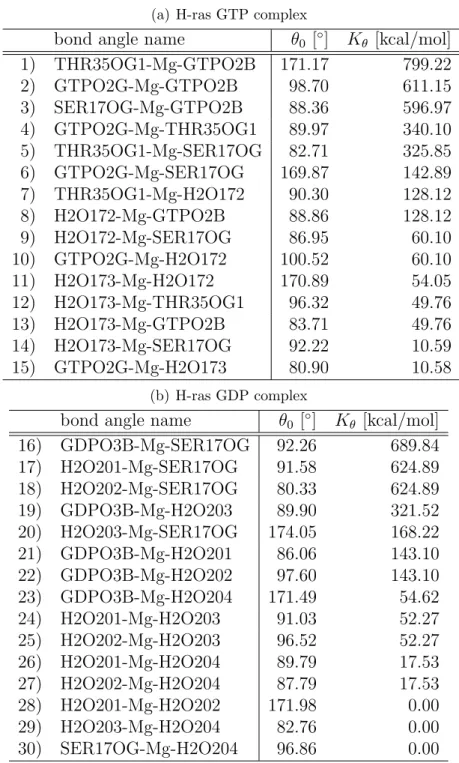
The atomic charges of the Mg-subsystem
In Table 2.1-2.4, our results of the atomic charges of the Mg-subsystem in the H-ras GTP complex and the H-ras GDP complex are shown.
From Table 2.1, the difference between the H-ras GTP complex and the
atom GTP GDP atom GTP GDP
O3G -0.746 H3’ 0.115 0.063
O2G -0.698 C2’ -0.004 -0.061
O1G -0.689 O2’ -0.604 -0.620
PG 0.942 HO’2 0.385 0.427
O3B -0.465 -1.108 H2’1 0.153 0.112 O2B -0.755 -0.737 C1’ 0.443 0.417 O1B -0.650 -0.724 H1’ -0.021 0.079 PB 0.929 1.053 N9 -0.204 -0.176 O3A -0.353 -0.362 C8 0.252 0.251 O2A -0.684 -0.592 H8 0.140 0.110 O1A -0.614 -0.724 N7 -0.529 -0.527 PA 0.921 0.849 C5 0.105 0.069 O5’ -0.433 -0.176 C6 0.481 0.558 C5’ 0.015 -0.264 O6 -0.540 -0.559 H5’1 0.131 0.165 N1 -0.482 -0.675 H5’2 0.083 0.131 H1 0.322 0.385 C4’ -0.017 0.320 C2 0.570 0.773 H4’ 0.071 0.062 N2 -0.757 -0.851 O4’ -0.376 -0.482 H21 0.327 0.364 C3’ 0.252 0.152 H22 0.352 0.377 O3’ -0.653 -0.626 N3 -0.577 -0.664 H3T 0.404 0.415 C4 0.291 0.228
Table 2.1: The atomic charges of the Mg-subsystem (GTP and GDP) of the
H-ras GTP complex and the H-ras GDP complex.
atom H-ras GTP H-ras GDP
Mg 1.037 1.297
SER17:N -0.812 -0.556
SER17:H 0.562 0.347
SER17:CA -0.425 -0.318
SER17:HA 0.170 0.180
SER17:CB 0.306 0.192
SER17:HB2 -0.030 0.078
SER17:HB3 0.032 0.055
SER17:OG -0.478 -0.658
SER17:HG 0.370 0.437
SER17:C 0.687 0.656
SER17:O -0.612 -0.576
Table 2.2: The atomic charges of the Mg-subsystem (Mg and SER17) of the H-ras GTP complex and the H-ras GDP complex.
atom charge atom charge
H2O172:HW1 0.398 THR35:CB 0.201 H2O172:HW2 0.526 THR35:HB 0.098 H2O172:OW -0.881 THR35:CG2 -0.355 H2O173:HW1 0.444 THR35:HG21 0.089 H2O173:HW2 0.411 THR35:HG22 0.131 H2O173:OW -0.795 THR35:HG23 0.076 THR35:N -0.742 THR35:OG1 -0.581
THR35:H 0.371 THR35:HG1 0.302
THR35:CA 0.589 THR35:C 0.272
THR35:HA -0.052 THR35:O -0.442
Table 2.3: The atomic charges of the Mg-subsystem (H2O and THR35 in
H-ras GTP) of the H-ras GTP complex and the H-ras GDP complex.
atom atomic charge
H2O201:HW1 0.439
H2O201:HW2 0.545
H2O201:OW -0.926
H2O202:HW1 0.398
H2O202:HW2 0.407
H2O202:OW -0.796
H2O203:HW1 0.406
H2O203:HW2 0.414
H2O203:OW -0.815
H2O204:HW1 0.398
H2O204:HW2 0.408
H2O204:OW -0.737
Table 2.4: The atomic charges of the Mg-subsystem (H2O in H-ras GDP) of the H-ras GTP complex and the H-ras GDP complex.
H-ras GDP complex is large for O3B. In H-ras GTP complex, this atom belongs to inner phosphate group and does not bind to Mg
2+coordinately.
In H-ras GDP complex, this atom belongs to the outer phosphate group and binds to Mg
2+coordinately.
From Table 2.2, the atomic charge of Mg
2+in the H-ras GTP complex is not +2 but +1.037 and the atomic charge of Mg
2+in the H-ras GDP complex the atomic charge of Mg
2+is not +2 but +1.297, by the influence of the coordinate bonds by six oxygen atoms.
From Table 2.3 and 2.4, we can find that OW of H2O172 in H-ras GTP
complex and OW of H2O1 in H-ras GDP have larger negative charges than
that of TIP3P model (-0.834), although OWs of other H2O molecules have almost the same negative charge as TIP3P model. Those are caused by the anisotropy of the electric fields around Mg
2+in direction, since distances of OWs in H2Os to Mg
2+are almost the same.
The differences between our calculated value and the value calculated by Worth et al. [41] in H-ras GTP complex are large for PA, O1G and PB. To represent the electronic orbitals with large angular momentum, the following two points are important: (1) the number of the basis set, (2) the number of polarized functions of the basis set. In our systems, the electronic orbitals in P atoms are orbitals with large angular momentum. For two atoms of P (PA and PB), those two points mentioned above cause a large difference between our calculated value and the value calculated by Worth et al. [41].
The differences between our calculated value and the value calculated by Worth et al. [41] in the H-ras GDP complex are large at PB, O3A and PA.
Those differences are also caused by the reasons mentioned in the case of the
H-ras GTP complex.
(a) H-ras GTP complex
bond b
0[˚ A] K
b[kcal mol
−1˚ A
−2]
Mg-GTPO2G 1.902 317.28
Mg-GTPO2B 2.077 268.46
Mg-SER17OG 2.276 197.20
Mg-THR35OG1 2.167 152.75
Mg-H2O173 2.106 67.51
Mg-H2O172 2.193 48.21
(b) H-ras GDP complex