׳°®±ª»³»²¬ ±º ̸» Ø»¿¬ λ ¬¿²½» ß¾ ´ ¬§ ±º
̸»®³±¬±´»®¿²¬ Ì×ÍÌÎ ëìè
Ì×ÍÌÎ ëìè
îðîð ç
CONTENTS
Pages iii iv vi CHAPTER 1 1 General Introduction .. 1 CHAPTER 2Improvement of thermotolerance of Zymomonas mobilis by genes for
reactive oxygen species-scavenging enzymes and heat shock proteins 6
2.1 6
2.2 6
2.3 Materials and 9
2.3.1 .. 9
2.3.2 .. 9
2.3.3 Construction of expression plasmids of genes for RSEs and HSPs
10
2.3.4 RT- . 11
2.3.5 11
2.3.6 Observation of stress r .. 12
2.4 12
2.4.1 Effects of increased expression of genes for RSEs and HSPs on
... 12
2.4.2 Effects of increased expression of genes for RSEs and HSPs on
... 19
2.4.3 Effects of increased expression of genes for RSEs and HSPs on
21 2.4.4 Effects of increased expression of genes for RSEs and HSPs on
growth under condition of s 24
CONTENTS
(continued)
Pages
CHAPTER 3 29
Enhancement of Thermal Resistance by Metal Ions in Thermotolerant
Zymomonas mobilis TISTR 548 . 29
3.1 Abstract .. 29
3.2 . 30
3.3 . 32
3.3.1 Bacterial strains, media and cultivation .. 32
3.3.2 Examination of the effects of 32
3.3.3 Cell morphology .... 33
3.3.4 Intracellular reactive oxygen species level ... 35
3.3.5 Ethanol concentration 35
3.4 Results . 36
3.4.1 Effect of metal ions on Z. mobilis TISTR 548 growth at CHT . 36 3.4.2 Physiological effects of Mg2+ and K+ on Z. mobilis TISTR 548 at
39 3.4.3 Effect of Mg2+ and K+ on Z. mobilis TISTR 548 growth at CHT . 42
3.4.4 Effect of Mg2+ and K+ on the growth of thermosensitive mutants .. 45
3.5 48 3.6 53 REFERENCES 54 APPENDIX 72 ACKNOWLEDGEMENT 80 LIST OF PUBLICATIONS 82 BIOGRAPHY 83
LIST OF TABLES
Tables Pages
CHAPTER 2
2.1 Genes for reactive oxygen species (ROS)-scavenging enzymes (RSE) and
. 15
CHAPTER 3
3.1 List of Zymomonas mobilis 34
3.2 Effects of Mg2+ and K+ on the growth of thermosensitive mutants from
Zymomonas mobilis ... 46
APPENDIX
S1 .. 77
S2 78
LIST OF FIGURES
Figures Pages
CHAPTER 2
2.1 Effects of increased expression of genes for reactive oxygen species (ROS)-scavenging enzymes (RSEs) on growth at the critical high
temperature (CHT) .. 16
2.2 Effects of increased expression of genes for heat shock proteins (HSPs) on
17 2.3 Effects of increased expression of genes for reactive oxygen species
(ROS)-scavenging enzymes (RSEs) (A) and heat shock proteins (HSPs)
. 20
2.4 Effects of increased expression of genes for reactive oxygen species (ROS)-scavenging enzymes (RSEs) (A) and heat shock proteins (HSPs)
(B) . 22
2.5 Effects of increased expression of genes for reactive oxygen species (ROS)-scavenging enzymes (RSEs) (A) and heat shock proteins (HSPs)
. 25
CHAPTER 3
3.1 Effect of various metal ions on the two-step cultivation of Zymomonas
mobilis TISTR 548 .. 37
3.2 Effects of Mg2+ and K+ on the growth of Zymomonas mobilis TISTR 548
at critical high temperatures . 38
3.3 Effects of Mg2+ and K+ on the physiology of Zymomonas mobilis TISTR
.. 40
3.4 Effects of GSH with Mg2+ and K+ on the growth of Zymomonas mobilis
43 3.5 Effects of EDTA with Mg2+ and K+ on the growth of Zymomonas mobilis
LIST OF FIGURES
(continued)
Figures Pages
3.6 Models for the action mechanisms of Mg2+ and K+ on Z. mobilis TISTR
... 52
APPENDIX
S1 Checking of increased expression of genes for RSEs and HSPs from
recombinant plasmids 72
S2 Effects of increased expression of genes for RSEs (A,B) and HSPs (C<D)
74 S3 Effects of increased expression of genes for RSEs (A) and HSPs (B) on
LIST OF ABBREVIATIONS
% w/v percent weight by volume
oC degree celcius
AlCl3 alumunium chloride
ATP adenosine triphosphate
bp base pair
CoCl2 cobalt (II) chloride
DNA deoxyribonucleic acid
EDTA ethylenediaminetetraacetic acid et al. et alii (Latin), and other
FeCl3 ferric chloride, iron (III) chloride
g gram
g/L gram per liter GSH glutathione
h hour (s)
H2O2 hydrogen peroxide
i.e. ed est (Latin), that is KCl potassium chloride MgCl2 Magnesium chloride
min minute (s) mL mililiter
mM milimolar
MnCl2 manganese (II) chloride
NaCl Sodium chloride
NADH nicotinamide adenine dinucleotide, reduced form
NADPH nicotinamide adenine dinucleotide phosphate, reduced form NaH2PO4 monosodium phospate
Na2HPO4 sodium phosphate dibasic
NiCl2 nickel (II) chloride
nm nanometer
pdc pyruvate decarboxylase RNA ribonucleic acid
RT-PCR reverse transcription-polymerase chain reaction rpm revolutions per minute
s second
SD standard deviation
YPD yeast-peptone-glucose medium µg/µL microgram per microliter µg.ml-1 microgram per mililiter
µL microliter
µM micromolar
µm micrometer
CHAPTER 1
GENERAL INTRODUCTION
World energy consumption is expanding with the increase in population and economic development. However, the available amount of fossil fuel is not sufficient to meet the energy demand in the future (Harun et al., 2010; Sivakumar et al., 2010). Moreover, the use of fossil fuels has negative environmental consequences such as the greenhouse effect, which in turn is causing global warming and climate change (Ho et al., 2013). Thus, the depletion in the supply of fossil fuels is driving efforts to find alternative energy sources that are both economically profitable and environmentally safe (Mussato et al., 2010; Ho et al., 2013). Biofuel is defined as a renewable energy generated from biological materials which is friendly to the environment. The carbon balance of biofuel is almost neutral when compared with the carbon balances of petroleum-derived fuels. The two most common types of biofuel in use today are bioethanol and biodiesel. In the early 2000s, the much worldwide attention was given to bioethanol production. Several countries including the USA, Brazil, China, and Canada are now using bioethanol as an alternative energy source. Bioethanol is an alcohol that is produced by fermentation and it can be used as a fuel for vehicles in its pure form. However, it is usually used as a gasoline additive to increase octane and improve vehicle emissions (Shalaby, 2013).
Bioethanol is classified into three types (Jambo et al., 2016) according to its sources. First-generation bioethanol is generally produced from the fermentation of sugars. Consequently, it is often produced by using edible biomass like sugarcane, corn, cereal crops,
edible lignocellulosic biomass and algal biomass, respectively, as sources of feedstock, and their production therefore appears to be more sustainable. Bioethanol fermentation is generally performed at temperatures in the range of 25- according to the optimal growth temperatures of ethanologenic microorganisms that are classified into mesophiles (Samappito et al., 2018). It has been confirmed that there is almost no growth or production of ethanol by ethanologenic microbes at temperatures higher et al., 2004). Bioethanol fermentation itself is exothermic and much heat is generated in the process. Coupled with the problem of global warming, temperature control, particularly that in large-scale fermentation, has becomes challenging (Samappito et al., 2018). Hence, temperature control at a suitable temperature is necessary for the growth of microorganisms used for fermentation.
The application of high-temperature ethanol fermentation (HTEF) for bioethanol production has many benefits since it enables reduction in cooling expenses and contamination risk (Zhang et al., 2015). Other benefits are related to a high fermentation rate, facilitation of product recovery, and more efficient simultaneous saccharification and fermentation (SSF). However, the generation of heat during the fermentation process inhibits the growth of cells and thus reduces cell viability and reduces the yield of ethanol (Thanonkeo et al., 2007a; Sootsuwan et al., 2013, Techaparin et al., 2017). Therefore, thermotolerant ethanologenic microbes are required for stable HTEF.
Zymomonas mobilis, a facultative anaerobic Gram-negative bacterium, proficiently ferments sugars to ethanol by using the Entner-Doudoroff (ED), glyceraldehyde-3-phosphate to pyruvate (GP), and pyruvate to ethanol (PE) pathways (Ley at al., 1977; Tribe et al., 1980). Since this organism lacks 6 phosphofructokinase and also 2-oxoglutarate dehydrogenase and malate dehydrogenase, which are critical enzymes for the Embden-Meyerhof-Parnas (EMP) pathway and TCA cycle (Sprenger et al., 1996; Seo et al., 2005),
providing sufficient ATP due to expression of many related enzymes. As a result, biomass formation is less and ethanol production is more efficient compared to those for Saccharomyces cerevisiae (Rogers et al., 1980; Thanonkeo et al., 2005; Matsushita et al., 2015). Moreover, the ethanol yield from Z. mobilis is 5 10% higher than that from S. cerevisiae. The maximum amount of ethanol produced by Z. mobilis can reach approximately 97% of the theoretical yield, whereas S. cerevisiae can produce only 90 93% of the theoretical yield (Hayashi et al. 2012). Additionally, Z. mobilis has a high tolerance to high levels of ethanol and high sugar concentrations (Sprenger, 1996; Swings and De Ley, 1977; Sootsuwan et al., 2013; Charoensuk et al., 2017, Carreon-Rodriguez et al., 2019).
Z. mobilis is a mesophilic bacterium like S. cerevisiae that generally grows at temperatures around 30oC. However, some strains are relatively thermotolerant. TISTR 548,
a strain isolated from Thailand, showed high rate of growth and ethanol production at high temperatures under static and shaking conditions (Sootsuwan et al., 2007; Thanonkeo et al., 2011; Samappito et al., 2018). By using the 2-times cultivation method, it was confirmed that the critical high temperature of this strain is 38oC (Kosaka et al., 2019). Besides the results
for growth and ethanol production, this CHT result clearly indicated that TISTR 548 is more thermotolerant than CP4 (Matsushita et al., 2015; Kosaka et al., 2019). Several studies were carried out to improve the capabilities of TISTR 548 in order to cope with heat stress. Stepwise thermal adaptation was performed and resulted in mutants 200M and MAS1 that have CHTs at 2oC and 3oC higher, respectively, than that of TISTR 548 (Kosaka et al., 2019).
In a study performed by Samappito et al. (2018), ZM AD41, another thermo-adapted strain is able to maintain growth at 41oC, was obtained. Those results suggested that accumulation of
mutations may allow the discovery of new thermotolerant strains, in turn suggesting the possible role of innate genomic factors in thermal adaptation (Kosaka et al., 2019). Hold on
this understanding, a genetical investigation may be beneficial for conversion of non-thermotolerant to non-thermotolerant microbes.
As a result of heat exposure, microbial cells will produce stress proteins as a part of the stress response. Some heat shock proteins (HSPs) were visibly recognized when TISTR 548 cells were exposure to a temperature of 40oC (Thanonkeo et al., 2007a). Intracellular
oxidative stress also accumulates during heat exposure (Noor et al., 2009, Murata et al., 2018) and can induce cell death (Davidson et al., 1996). The expression of ROS-scavenging enzymes (RSEs) such as catalase or superoxide dismutase contributes to the degradation of intracellular ROS, which results in an increase in thermotolerance (Davidson et al., 1996; Noor et al., 2009; Basak and Jiang, 2012; Nantapong et al., 2019). Since ROS accumulate in cells of Z. mobilis strains at their CHTs (Kosaka et al., 2019), macromolecules like proteins are possibly exposed to ROS. Consequently, various type of protein damage such as unfolding, misfolding, aggregation, or denaturation may induce functional changes and disturb cellular metabolism (Cabiscol et al., 2000). Therefore, many HSPs are molecular chaperones (Tomoyasu et al., 1998; Kitagawa et al., 2002; Zolkiewski et al., 2012 Mogk et al., 2015) and proteases (Jones et al., 2002), components that may play an important role at high temperatures to protect cells against protein damage by repairment or degradation.
On the other hand, results of genome-wide analysis of the genes required for survival at CHTs among mesophilic bacteria groups represented by Escherichia coli, Acetobacter tropicalis, and Zymomonas mobilis showed that the functional classes of thermotolerant genes were categorized as metabolism, membrane stabilization, transporter, DNA repair, tRNA modification, protein quality control, translation control, cell division, and transcriptional regulation (Soemphol et al., 2011; Charoensuk et al., 2017; Murata et al., 2018). However, there are only a few genes for reactive oxygen species (ROS)-scavenging
bacteria (Soemphol et al., 2011; Charoensuk et al., 2017; Murata et al., 2018). In this study, to understand the contribution of genes for RSEs and HSPs to thermotolerance, the effects of enhanced expression of these genes on survival at the critical high temperature (CHT) in Z. mobilis TISTR 548 were examined.
Heat stress does not only inhibit the growth and fermentation ability of Z. mobilis cells (Thanonkeo et al., 2007a) but also alters the fluidity of the plasma membrane (Carey and Ingram, 1983; Moreau et al., 1997). Like ethanol stress, excessive heat probably disrupts cellular ionic homeostasis, reduces metabolic activity and leads to cell death. The presence of cations in metabolic processes and physiological functions is crucial for HTEF by ethanologenic microorganisms. Metal ions have been shown to improve growth at a high temperature for various microorganisms including S. cerevisiae, Pseudomonas aeruginosa, E. coli., Lactobacillus strains and even Z. mobilis (Thanonkeo et al., 2007a; Reid et al., 2009; Huang and Chen, 2013; Lam et al., 2014; Charoensuk et al., 2019), but the maximum limit of concentration must be considered since a high level of metal ions may be toxic to some cells (Gadd, 1992). It was also suggested that the concentration of metal ions in the fermentation medium affects the productivity for HTEF. In Z. mobilis, investigation of metal ions other than Mg2+ (Thanonkeo et al., 2007a) has not been performed yet. In this study, we examined
the effects of various metal ions including Mn2+, Ni2+, Co2+, Al3+, Fe3+, Zn2+, Mg2+, K+, and
Ca2+, on growth of Z. mobilis TISTR 548 at its CHT. The mechanisms effect of some metal
ions on cell physiology at the CHT would be elucidated. The effects of Mg2+ and K+ were
CHAPTER 2
Improvement of thermotolerance of Zymomonas mobilis by genes for
reactive oxygen species-scavenging enzymes and heat shock proteins
2.1 Abstract
Thermotolerant genes, which are essential for survival at a high temperature, have been identified in three mesophilic microbes, including Zymomonas mobilis. Contrary to expectation, they include only a few genes for reactive oxygen species (ROS)-scavenging enzymes and heat shock proteins, which are assumed to play key roles at a critical high temperature (CHT) as an upper limit of survival. We thus examined the effects of increased expression of these genes on the cell growth of Z. mobilis strains at its CHT. When overexpressed, most of the genes increased the CHT by about one degree, and some of them enhanced tolerance against acetic acid. These findings suggest that ROS-damaged molecules or unfolded proteins that prevent cell growth are accumulated in cells at the CHT.
2.2 Introduction
Microorganisms intrinsically have an upper temperature limit for survival called a critical high temperature (CHT) (Matsushita et al., 2015; Kosaka et al., 2019). Genome-wide analysis of three mesophiles, Escherichia coli, Acetobacter tropicalis, and Zymomonas mobilis, by screening thermosensitive mutants either with a single-knockout mutant library or with a transposon- inserted mutant library has revealed that about 1.5% of genomic genes, called thermotolerant genes, are responsible for cell survival at a CHT (Charoensuk et al., 2017; Murata et al., 2018), but there is no sufficient information to conclude that a mesophile with a larger number of genomic genes has a larger number of thermotolerant genes and thus
tends to be more temperature-resistant. Other factors including gene expression of key proteins may also contribute to the degree of thermotolerance. Thermotolerant genes are categorized into nine groups, including genes for metabolism, membrane stabilization, transporter, DNA repair, tRNA modification, protein quality control, translation control, cell division, and transcriptional regulation (Murata et al., 2011, 2018; Soemphol et al., 2011; Charoensuk et al., 2017), which are mostly related to fundamental activities of cells. The CHT differs to some extent from strain to strain even in the same species such that relatively thermotolerant strains can be isolated in tropical areas, assuming that thermotolerant strains have adapted to the environmental temperature. The thermotolerance of mesophiles, E. coli W3110, Z. mobilis CP4, and Z. mobilis TISTR 548, has been improved by in vivo thermal adaptation, suggesting that they have a genomic capacity for adaptation to higher temperature environments (Kosaka et al., 2019). The capacity, however, is limited to 2 3 C, and the variation of thermal adaptation is also restricted. The change of only a few degrees is physiologically important, which was determined by an accurate method, called a two-step cultivation assay that eliminates the effects of start temperature and can distinguish CHT differences between two different strains of the same species (Kosaka et al., 2019).
The thermotolerance of microbes is remarkably beneficial for stable fermentation. Ethanologenic microbes, for example, are exposed to heat stress in the ethanol fermentation process (Attfield, 1997; Wang et al., 2007) due to its exothermic reaction (van Uden and da Craz Duarte, 1981; Ghose and Bandyopadhyay, 1982). Heat stress has a negative impact on their growth or viability (Basso et al., 2008; Babiker et al., 2010) and prevents their fermentation ability. These negative effects are enhanced in the presence of other factors, including a low pH, a high ethanol concentration, or a high osmolarity (Piper, 1995; Carmelo et al., 1998; Ciani et al., 2006; Coleman et al., 2007; Gibson et al., 2007; Pizarro et al.,
2007). Thus, heat stress should be avoided for stable and effective fermentation by chilling fermentation reactors. Thermotolerant microbes enable high- temperature fermentation (HTF) to be performed, thus reducing the costs for chilling reactors in the bioconversion process of biomass to fuels or chemicals and for biomass hydrolysis in simultaneous saccharification fermentation and thus preventing contamination of other microbes (Murata et al., 2015).
A higher temperature results in accumulation of more oxidative stress in E. coli (Noor et al., 2009), and oxidative stress is involved in heat-induced cell death as has been shown for Saccharomyces cerevisiae (Davidson et al., 1996), being consistent with findings that overexpression of genes for catalase and superoxide dismutase is able to increase the degree of thermotolerance (Nantapong et al., 2019) and that the thermotolerance increases under anaerobic conditions (Davidson et al., 1996; Davidson and Schiestl, 2001). It is thus assumed that the impact of the CHT causes intracellular oxidative stress to elicit harmful effects on cells as a secondary stress. However, only one gene and no gene for reactive oxygen species (ROS)- scavenging enzymes (RSEs) was found as a thermotolerant gene in A. tropicalis and Z. mobilis, respectively (Soemphol et al., 2011; Charoensuk et al., 2017). The CHT would also cause damage of proteins to be unfolded or denatured. Surprisingly, no genes for general heat shock proteins (HSPs), except for degP, dnaK, and dnaJ in E. coli (Murata et al., 2011, 2018), degP in A. tropicalis (Soemphol et al., 2011), and degP in Z. mobilis (Charoensuk et al., 2017), have been identified as thermotolerant genes.
In this study, we thus examined the effects of increased expression of genes for RSEs and HSPs on cell survival at the CHT in Z. mobilis. Increased expression of most of the genes tested raised the CHT and reduced ROS compared to the controls. These findings together with previous findings suggest that the CHT is determined by functional
contributions of several factors that prevent the accumulation of damaged macromolecules in cells in addition to fundamental activities by thermotolerant genes identified previously.
2.3 Materials and methods 2.3.1 Materials
Oligonucleotide primers were purchased from Greiner Bio-One (Japan). A DNA purification kit, gel extraction kit, and one- step RT-PCR kit were from Qiagen (Japan). Restriction enzymes were from Biolabs (Japan) and Takara (Japan). PrimeSTAR DNA polymerase and an In-Fusion HD cloning kit were purchased from Takara (Japan). E. coli
Nacalai Tesque (Japan). Glucose and NaCl were from Sigma-Aldrich (United States). Chloramphenicol was from Boehringer Mannheim GmbH (Germany). Other chemicals used in this study were of analytical grade.
2.3.2 Bacterial strains, media and culture conditions
Plasmids used in this study are listed in Supplementary Table S1. Z. mobilis TISTR 548 (Sootsuwan et al., 2007) was cultured in YPD medium [0.5% (w/v) yeast extract, 0.3% (w/v) peptone, and 3% (w/v) glucose]. Recombinant plasmids with targeted genes were introduced into E. coli
medium (1% tryptone, 0.5% yeast extract, and 0.5% NaCl) for 2 h and spread onto agar plates containing 1.5% agar. When pZA22 (Misawa et al., 1986) or its derivatives were .ml 1). A log-phase culture, 0.5 1.0 at OD550, that had been prepared at 30 C was inoculated into a liquid medium, and cultivation was conducted under a static condition. Bacterial growth was
monitored by measuring the optical density of the culture on a spectrophotometer (HITACHI, U-200) at OD550. Determination of the CHT was carried out by the two-step cultivation assay
as described previously (Kosaka et al., 2019). For measuring the cell length, 12-h cultivated cells in the first culture of the two-step cultivation were collected by low-speed centrifugation, washed, and resuspended in a saline solution. The morphology of the resuspended cells was then observed under a microscope (Eclipse E600, Nikon, Japan) with 400 × magnification, and images of the same sample were taken three to five times. The lengths of approximately 100 cells were manually measured.
2.3.3 Construction of expression plasmids of genes for RSEs and HSPs
Conventional recombinant DNA techniques were applied (Sambrook et al., 1989). For increased expression of genes for RSEs and HSPs in Z. mobilis TISTR548, operon fusion genes of the pdc promoter and each of these genes were constructed and incorporated into pZA22 (Misawa et al., 1986) as an expression vector for Z. mobilis. The pdc promoter fragment including the Shine Dalgarno sequence of pdc (514 bp) and each gene fragment from its initiation codon to 20 bp downstream from its stop codon were amplified by PCR using the genomic DNA of TISTR548 as a template. pZA22 was linearized by PCR. The primers (Supplementary Table S2) used for PCR were designed according to the In-Fusion HD cloning method. The PCR fragments were purified using a QIAquick gel extraction kit and connected by an In-Fusion HD cloning kit. The constructed plasmids were confirmed by PCR and restriction mapping.
2.3.4 RT-PCR
To examine the degree of increased expression of targeted genes, RT-PCR was performed as described previously (Murata et al., 2011, 2018). Precultured cells were inoculated and cultivated in YPD medium containing chloramphenicol at 30 C for 12 h. The cells were then harvested, and total RNA was prepared by the hot phenol method (Aiba et al., 1981). RT-PCR was performed using a One-Step RNA PCR Kit with two specific primers for
each gene (Supplementary Table S3 protocol
from the kit supplier. After RT reaction at 50 C for 30 min, PCR consisting of denaturing at 94 C for 30 s, annealing at 50 C for 30 s, and extension at 72 C for 1 min was carried out. The PCR products after 10, 15, 20, and 25 cycles for each gene were taken and analyzed by 1.2% agarose gel electrophoresis, followed by staining with ethidium bromide. The intensity of bands of RT-PCR products was quantitatively determined using ImageJ. The linearity of the amplification was observed up to the 25th or 35th cycle. Under our conditions, the RT-PCR was able to specifically detect mRNA because no band was observed when reverse transcriptase was omitted.
2.3.5 Determination of ROS
The level of intracellular ROS was determined using a fluorescence probe, 2 ,7 -dichlorofluorescin diacetate (H2DCFDA) (P rez-Gallardo et al., 2013), as described
previously (Kosaka et al., 2019). Cells that were grown for 12 h at 38 C in the first culture of the two-step cultivation assay were mixed with H2DCFDA at the final concentration of 5
The pellet was then washed with saline solution, resuspended in 10 mM potassium phosphate buffer (pH 7.0), and disrupted by sonic oscillation (Cosmo Bio Japan). The fluorescence was
measured using a POWERSCAN® HT microplate reader (DS Pharma Biomedical Osaka
Japan) with excitation at 485 nm and emission at 582 nm. Emission values were normalized by protein concentration, which was determined by the Lowry method (Dulley and Grieve, 1975).
2.3.6 Observation of stress resistance
To examine the effects of increased expression of genes on resistance to stresses
other than high temperatures, cells were precultured at 30 C until a mid-log phase, diluted (100 104 ), and spotted on YPD agar plates supplemented with 6 2% glucose, 3 5%
ethanol, or 0.03 0.3% acetic acid. The plates were then incubated at 30 C for 48 h. To examine the effect of H2O2on cell growth, precultured cells were inoculated and cultivated at
30 C in YPD liquid medium containing H2O2at a final concentration of 0.1 mM. The optical
density of the culture at OD550was then measured at 12 h. All experiments were triplicated.
2.4 Results
2.4.1 Effects of increased expression of genes for RSEs and HSPs on growth at the CHT
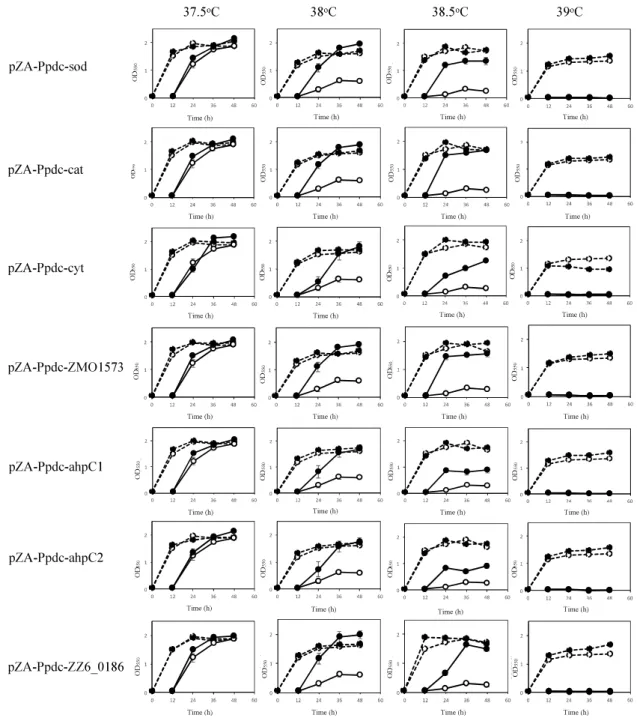
To examine the contribution of RSEs and HSPs to the survival of Z. mobilis at the CHT and to the improvement of the CHT, the genes coding for these enzymes and proteins (Table 2.1) were individually cloned into pZA22 under the control of the pdc promoter, which is a relatively strong promoter derived from Z. mobilis, and the effects of expression of these genes were evaluated by the two-step cultivation assay, which enables determination of the CHT of mesophiles (Kosaka et al., 2019). The expression of cloned genes was confirmed by RT-PCR, indicating 1.4-to 4.0-fold increases compared to the expression of intrinsic genes
in the genome (Supplementary Figure S1). Two-step cultivation assays for RSE genes were conducted at 37.5, 38, 38.5, and 39°C (Figure 2.1). At 38°C, all transformants with sod, cat, cyt, ahpC1, ahpC2, or pZA-Ppdc-ZMO1573, which bear sod, cat, cyt, ahpC1, ahpC2 [corresponding to ahpC (Charoensuk et al., 2011)], or ZMO1573, respectively, exhibited growth in the second culture, but the transformant with an empty vector as a control hardly grew. Among the genes tested, sod, cat, ZMO1573, and ZZ6-0186 had relatively stronger effects on cell growth, especially after 36 h. At 38.5°C, transformants with Ppdc-sod, Ppdc-cat, pZA-Ppdc-ZMO1573, or pZA-Ppdc-ZZ6-0186 showed clearly stronger growth than those with pZA-Ppdc-cyt, pZA-Ppdc-ahpC1, pZA-Ppdc-ahpC2, or pZA-Ppdc-ZMO1573 in the second culture. The two-step cultivation data indicated that the CHTs of transformants with pZA-Ppdc-sod, pZA-Ppdc-cat, pZA-Ppdc-ZMO1573, or pZA-Ppdc-ZZ6-0186 were 38.5°C and that the CHTs of the remaining transformants were between 38 and 38.5°C. The improvement of CHT in the former group was 1°C compared to the CHT, 37.5°C, of the transformant with an empty vector and that of the latter was more than 0.5°C and less than 1°C. These findings suggest that all of the tested genes are able to improve the CHT of Z. mobilis TISTR 548 and that sod, cat, and ZMO1573 are more effective.
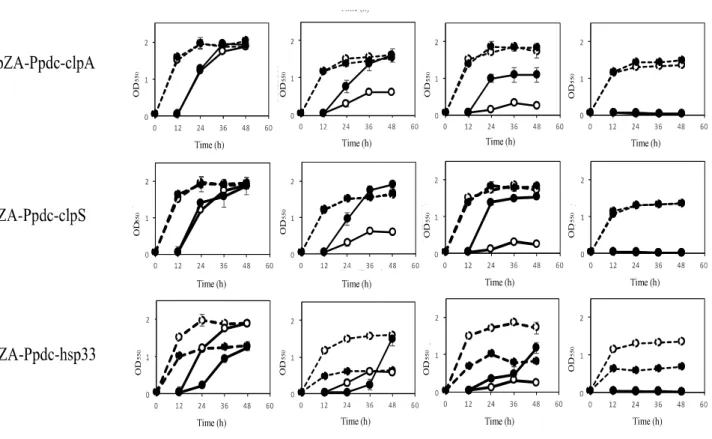
The effects of increased expression of genes for HSPs were also examined by two-step cultivation in the range of 37.5 39°C, in which transformants with pZA-Ppdc-degP, pZA-Ppdc-dnaKJ, pZA-Ppdc-groELS, pZA-Ppdc-hsp20, pZA-Ppdc-hisU, pZA-Ppdc-clpB, or pZA-Ppdc-clpPX, which bear degP, dnaKJ, groELS, hsp20, hisU, clpB, or clpPX, respectively, were used (Figure 2.2). At 38°C, all transformants except for a transformant with pZA-Ppdc-degP exhibited higher growth in the second culture than the growth of the transformant with an empty vector. Of these, transformants with Ppdc-dnaKJ,
pZA-Ppdc-Hsp20, pZA-Ppdc-clpB, pZA-Ppdc-clpA, or pZA-Ppdc-clpS exhibited higher turbidity than that of the other transformants. On the other hand, cells containing pZA-Ppdc-degP showed only slightly higher turbidity than that of cells harboring an empty vector. At 38.5°C, in comparison with cells harboring an empty vector, cells harboring Ppdc-dnaKJ, pZA-Ppdc-Hsp20, or pZA-Ppdc-clpS showed relatively high turbidity in the second culture, followed by cells harboring pZA-Ppdc-groELS, pZA-Ppdc-clpB, or pZA-Ppdc-clpA. In the case of transformants with pZA-Ppdc-hslU or pZA-Ppdc-hsp33, their growth in the second culture was greatly repressed until 36 h compared to the control, suggesting that overexpression of hslU or hsp33 somehow hampers the cell growth. Notably, the transformant with pZA-Ppdc-hsp33 showed lower turbidity even in the first culture. These findings suggested that increased expression of all of the genes tested except for degP, hslU, and hsp33 can improve the thermotolerance of Z. mobilis TISTR 548 and that dnaKJ, hsp20, and clpS can up-shift the CHT by 1°C and groELS, clpB, and clpA can up-shift the CHT by 0.5 1°C.
Table 2.1 Genes for reactive oxygen species (ROS)-scavenging enzymes (RSE) and heat shock proteins (HSPs) that were examined in this study
Genes Quary coveragea (%)
Identitiya (%)
Function Reference
Z. mobilis E. coli
sod sodB 98 52 Superoxide dismutase, Fe-Mn family Davidson et al., 1996
cat katE 51 49 Catalase Davidson et al., 1996
cyt yhjA 96 44 Predicted cytochrome C peroxidase Charoensuk et al., 2011
ZZ6_1529 yfeX 89 36 Dyp-type peroxidase family Matsushita et al., 2015
ahpC1 Not applicable ahpC/TSA family protein La Carbona et al., 2009
ahpC2 ahpC 88 38 Alkyl hydroperoxide reductase subunit C Seaver and Imlay, 2001
ZZ6_0186 trxB 95 55 Thioredoxin reductase William, 1995; Arner and Holmgen, 2000
degP degP 92 34 Serine protese Do Jones et al., 2002; Murata et al., 2011; Charoensuk et al., 2017
dnaK dnaK 99 66 Molecular chaperone DnaK Tomoyasu et al., 1998
dnaJ dnaJ 98 52 Molecular chaperone DnaJ Tomoyasu et al., 1998
groEL groEL 96 67 Chaperonin GroEL Tomoyasu et al., 1998
groES groES 97 52 Chaperonin GroES Tomoyasu et al., 1998
hslU hslU 98 53 ATP-dependent HslUV protease, ATP binding subunit HslU Seol et al., 1997; Yoo et al., 1998;
ibpA ibpA 99 50 Heat shock protein Hsp20 Kitagawa et al., 2002; Kuczynska-Wisnik et al., 2002
clpA clpA 97 59 ATP-dependent Clp protease, ATP-binding subunit ClpA Katayama et al., 1988; Kress et al., 2009
clpB clpB 99 58 ATP-dependent Clp protease, ATP-binding subunit ClpB Mogk et al., 2003; Kedzierska, 2003
clpS clpS 92 55 ATP-dependent Clp protease, adaptor protein ClpS Dougan et al., 2000; Roman-Hernandez et al., 2011
ZZ6_0844 hslO 91 33 Molecular chaperone Hsp33 Jakob et al., 1999
Figure 2.1. Effects of increased expression of genes for reactive oxygen species
(ROS)-scavenging enzymes (RSEs) on growth at the critical high temperature (CHT). Growth of cells harboring a recombinant plasmid with a gene for one of the RSEs (closed circles) or an empty plasmid (open circles) was examined by two-step cultivation at 37.5 39 C in YPD medium containing chloramphenicol. After 12 h in the first cultivation (dotted lines) at each temperature, an aliquot of the culture was transferred to a fresh medium, and the second cultivation was carried out (straight lines). At the times indicated, cell density was estimated by measuring OD550. Bars represent ± SD for three independent experiments.
Figure 2.2. Continued
Figure 2.2. Effects of increased expression of genes for heat shock proteins (HSPs) on
growth at the critical high temperature (CHT). Growth of cells harboring a recombinant plasmid with a gene for one of the HSPs (closed circles) or an empty plasmid (open circles) was examined by two-step cultivation at 37.5 39 C in YPD medium containing chloramphenicol as shown in Figure 2.1. Bars represent ± SD for three independent experiments.
2.4.2 Effects of increased expression of genes for RSEs and HSPs on accumulation of ROS at the CHT
When cells are exposed to a temperature close to the CHT, the level of intracellular ROS increases (Kosaka et al., 2019). Since enhancement of the expression of genes for RSEs and HSPs caused an up-shift of the CHT, it was assumed that increased expression of these genes prevented the accumulation of ROS. We thus examined the assumption at 38°C after 12 h in the first culture (Figure 2.3) because accumulation of ROS in the first culture has been reported to have an impact on the growth of cells in the second culture (Kosaka et al., 2019). As a result, the level of ROS of all of the transformants with a plasmid bearing one of the genes for RSEs and HSPs was lower than that of the control. However, the ROS level at the mid-log phase in the first culture was not always consistent with the level of improvement in the CHT because transformants with pZA-Ppdc-dnaKJ and pZA-Ppdc-clpA showed the lowest level of ROS but improved the CHT by 1°C and less than 1°C, respectively. This inconsistency may be due to other contribution of the genes, especially HSP genes, to the up-shift of the CHT in addition to the reduction of ROS.
Figure 2.3. Effects of increased expression of genes for reactive oxygen species
(ROS)-scavenging enzymes (RSEs) (A) and heat shock proteins (HSPs) (B) on accumulation of ROS at the critical high temperature (CHT). Cells were grown at 38 C in YPD medium containing chloramphenicol. Using the culture at 10 h, ROS were detected with H2DCFDA, and the
fluorescent intensity reflects the level of accumulation of ROS. Bars represent ± SD for three independent experiments.
2.4.3 Effects of increased expression of genes for RSEs and HSPs on cell morphology at the CHT
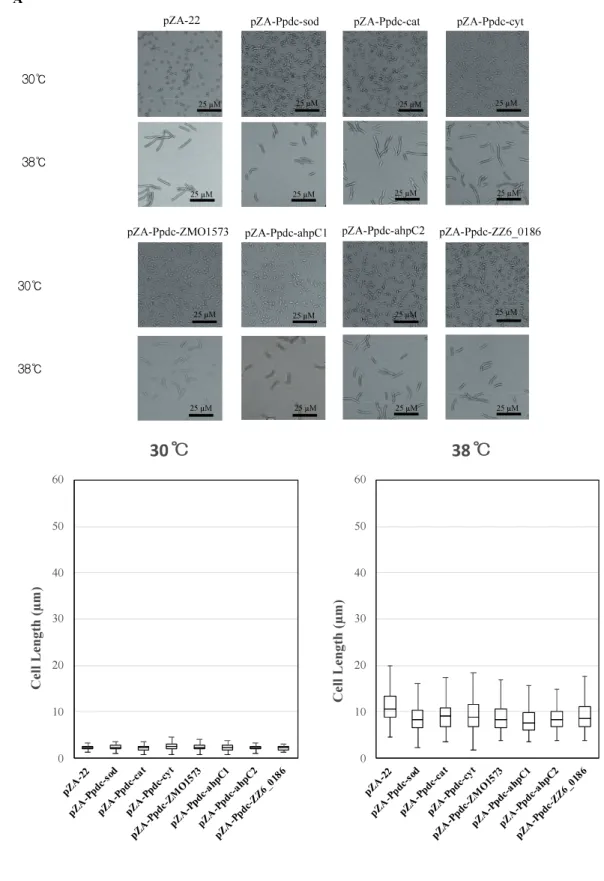
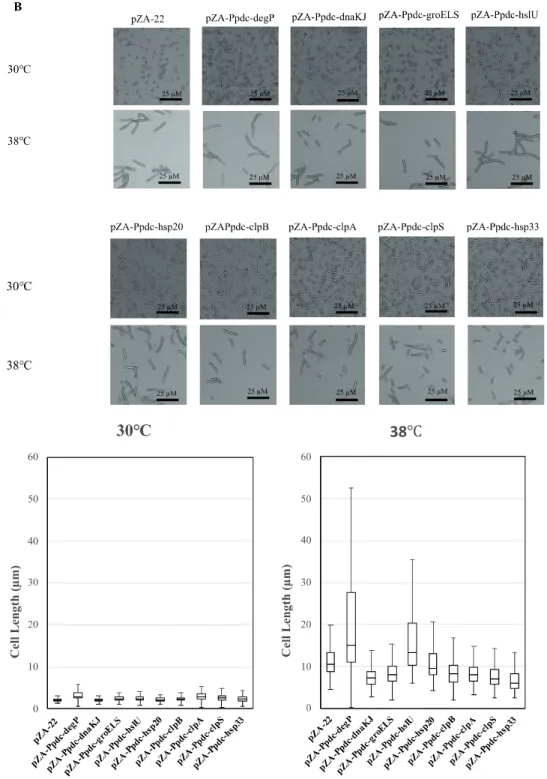
Cells become elongated when exposed to a temperature close to the CHT (Kosaka et al., 2019). The morphological change may be due to accumulation of stress including stress caused by ROS in cells, which presumably influences cell division. As mentioned above, the enhanced expression of genes for RSEs and HSPs reduced the intracellular level of ROS. We thus assumed that their enhanced expression prevents the morphological change. The assumption was examined by measurement of cell length at 38 C after 12 h in the first culture (Figure 2.4). As expected, all transformants with a plasmid bearing one of the genes for RSEs were shorter in cell length than the transformant with an empty vector, being consistent with the impact of the genes on cell growth at the CHT. While the transformants with dnaKJ, groELS, clpB, clpA, clpS, and hsp33 for HSPs were relatively short in cell length, the transformant with hsp20 showed no change, and the transformant with degP or hslU were much larger. Considering the lower levels of ROS in the transformants, increased expression of the latter three genes may somehow hamper cell division.
Figure 2.4 Effects of increased expression of genes for reactive oxygen species
(ROS)-scavenging enzymes (RSEs) (A) and heat shock proteins (HSPs) (B) on cell morphology at the critical high temperature (CHT). Cells were grown at 38 C in YPD medium containing chloramphenicol. Using the culture at 12 h, cell morphology was observed, and lengths of 100 cells were measured.
2.4.4 Effects of increased expression of genes for RSEs and HSPs on growth under condition of stress
The experiments described above, in which the effects of increased expression of genes for RSEs and HSPs were examined, revealed that most of the genes were effective for improvement of the CHT, accumulation of ROS, and change in cell morphology. We thus examined whether these genes allow cells to be resistant to various types of stress in addition to heat (Figure 2.5 and Supplementary Figure S2). When tested on plates containing different concentrations of glucose or ethanol, no transformant with any gene for RSEs and HSPs showed growth that was different from that of the control transformant. After addition of 0.03% acetic acid (about pH 5.0) and 0.3% acetic acid (about pH 4.0), all transformants including those with an empty vector grew better than those without the addition of acetic acid, which may be because the host strain has the optimal pH in the acidic range. Interestingly, transformants with some genes of RSEs, sod, cat, ahpC1, ahpC2, and ZZ6_0186, and transformants with some genes of HSPs, dnaK, hsp20, clpA, clpB, and clpS, exhibited better growth on a medium containing acetic acid, being almost consistent with their up-shift of the CHT. Therefore, it is likely that the presence of acetic acid causes the macromolecule damage by a similar mechanism to that at the CHT, but it might be more than such damage when cells are challenged by acetic acid, for example, ATP deprivation and lower pH inside the cell (Lawford and Rousseau, 1993; Ullah et al., 2013). Moreover, exogenous oxidative stress was examined by cultivation at 30 C in YPD liquid medium containing 0.1 mM H2O2. Most of the transformants with genes for RSEs and HSPs except
for degP showed better growth than that with an empty vector (Supplementary Figure S3), suggesting that increased expression of these genes alleviated the oxidative stress by H2O2.
These findings are essentially consistent with the results of measurement of ROS in these transformants, as shown in Figure 2.3.
Figure 2.5. Effects of increased expression of genes for reactive oxygen species
(ROS)-scavenging enzymes (RSEs) (A) and HSPs (B) on tolerance to acetic acid. Cells were grown at 30 C in YPD medium containing chloramphenicol overnight. The cell culture was serially diluted, spotted on YPD agar plates containing 0.03 or 0.3% acetic acid, and incubated at 30 C for 48 h.
2.5 Discussion
When exposed to a CHT, mesophiles exhibit several characteristic phenotypes, including cell elongation and accumulation of ROS (Kosaka et al., 2019). To determine the CHT of mesophiles, we had developed a two-step cultivation assay (Kosaka et al., 2019), which is much clearer and more precise than a general cultivation assay that shows an increase in turbidity even at a temperature above the CHT. On the other hand, a temperature around the CHT may cause instability of the membrane, resulting in leakage of electrons to generate ROS and may give rise to unfolding or denaturing of proteins or oxidation of proteins by accumulated ROS (Jan-Ulrik et al., 2015). In this study, we thus applied the two-step cultivation method to evaluate the contribution of genes for RSEs and HSPs to the CHT of Z. mobilis TISTR548. Their contribution was further examined by observation of the levels of ROS accumulation and cell elongation.
Among the genes tested, enhanced expression of sod, cat, ZMO1573, and ZZ6-0186 for RSEs and dnaKJ, hsp20, and clpS for HSPs up-shifted the CHT by 1 C, and most of the remaining genes up-shifted the CHT by 0.5 1.0 C. However, the contribution of these genes is less than the effect of thermal adaptation, which is able to increase the CHT by 2 3 C (Kosaka et al., 2019). Consistent with the weaker contribution to the up-shift of the CHT, the extents of reduction of ROS and of cell size seem to be relatively low. Nonetheless, it is likely that prevention of the accumulation of ROS is an effective way to improve the CHT.
The HSP genes tested in this study except for degP, hslU, and hsp33 were able to raise the CHT of Z. mobilis when their expression was increased (Figure 2.2). DnaKJ and GroELS function as molecular chaperones, which are involved in refolding of unfolded or denatured proteins (Narberhaus et al., 1998; Tomoyasu et al., 1998; Thanonkeo et al., 2007; Al Refaii and Alix, 2009). Hsp20 and ClpB as Hsp100 members prevent protein aggregation
and solubilize aggregated proteins, respectively (Zolkiewski et al., 2012; Mogk et al., 2015). These chaperones or Hsps deal with denaturated or aggregated proteins that are expected to appear at the CHT. ClpA and ClpS are ATP- binding subunits of ClpAP protease and its adapter, respectively (Dougan et al., 2002; Maglica et al., 2008). They may contribute to the removal of denatured or aggregated proteins at the CHT. On the other hand, increased expression of hslU and hsp33 seems to inhibit cell growth even at 37.5 and 38 C. The former product is an ATP-binding subunit of HslUV protease (Yoo et al., 1998; Baytshtok et al., 2017), and the latter is a redox-regulated chaperone, which is activated by dimerization via disulfide bonds (Graf and Jakob, 2002). Considering these functions and activation process, the negative effects of HslU and Hsp33 on growth at the CHT might be due to proteolysis of and abnormal interaction with crucial proteins for cellular activities. In contrast to the HSP genes tested except for hslU and hsp33, degP for a periplasmic chaperone hardly elevated the CHT when overexpressed. A knockout mutant of degP, however, reduced the CHT by 1 2 C, and the gene has thus been categorized as a thermotolerant gene, which is shared by E. coli, Z. mobilis, and A. tropicalis (Murata et al., 2011, 2018). The inconsistency between degP and effective HSP genes may be due to the different cellular localization of their gene products in cells: DegP localizes in the periplasmic space, but other gene products localize in the cytoplasm. Alternatively, DegP might be sufficient to perform its activity in the parental strain. The increased expression of most of the cytoplasmic HSPs, but not DegP, may thus contribute to the maintenance of homeostasis inside cells at a CHT.
All seven of the RSE genes tested decreased the level of ROS and increased the CHT of Z. mobilis by their increased expression (Figures 2.1, 2.3). Four of the genes are involved in degradation of H2O2, but regulation of their expression may be distinct under
37 C than at 30 C, whereas cat and ahpC exhibit the opposite expression pattern to that of cytC and ZMO1573 (Charoensuk et al., 2011). Such up-regulation of cytC and ZMO1573 at a high temperature may reflect insufficient H2O2-degrading activities for survival at the CHT,
being in agreement with the finding that all of the four genes are able to raise the CHT when overexpressed. On the other hand, the reduced form of thioredoxin plays an important role as an antioxidant, and its reduction requires NADPH in addition to the corresponding reductase. It is likely that NADPH is not limited in Z. mobilis cells at the CHT because increased expression of ahp1 for peroxiredoxin or ZZ6_0186 for thioredoxin reductase leads to an increase in the CHT.
This study was motivated by the surprising fact that only a few genes for RSEs and HSPs have been identified as thermotolerant genes (Charoensuk et al., 2017; Murata et al., 2018), which are essential for survival at a CHT. The finding presented suggests that many genes for RSEs and HSPs have the potential to improve the CHT, although the range of improvement is within 1 C. It is thus likely that there are several genes that have overlapping functions in cells, and thus, the disruption of one gene is complemented by another gene. In relation to this, a knockout mutant of cytC for a peroxidase involved in the respiratory chain exhibited filamentous shapes and reduction in growth under a shaking condition at a high temperature, and under the same condition, sod, ahpC, and ZMO1573 are complementarily expressed to the cytC mutation (Charoensuk et al., 2011). Such robustness by the existence of complementing genes would have hindered the identification of genes for RSEs and HSPs as thermotolerant genes.
CHAPTER 3
Enhancement of Thermal Resistance by Metal Ions in Thermotolerant
Zymomonas mobilis TISTR 548
3.1 Abstract
The thermal resistance of fermenting microbes is a key characteristic of stable fermentation at high temperatures. Therefore, the effects of various metal ions on the growth of Zymomonas mobilis TISTR 548, a thermotolerant ethanologenic bacterium, at a critical high temperature (CHT) were examined. Addition of Mg2+ and K+increased CHT by 1°C,
but the effects of the addition of Mn2+, Ni2+, Co2+, Al3+, Fe3+, and Zn2+ on CHT were
negligible. To understand the physiological functions associated with the addition of Mg2+ or
K+, cell morphology, intracellular reactive oxygen species (ROS) level, and ethanol
productivity were investigated at 39°C (i.e., above CHT). Cell elongation was repressed by Mg2+, but not by K+. Addition of both metals reduced intracellular ROS level, with only
K+ showing the highest reduction strength, followed by both metals and only Mg2+.
Additionally, ethanol productivity was recovered with the addition of both metals. Moreover, the addition of Mg2+ or K+ at a non-permissive temperature in 26 thermosensitive, single
gene-disrupted mutants of Z. mobilis TISTR 548 revealed that several mutants showed metal ion-specific growth improvement. Remarkably, K+ repressed growth of two mutants. These
results suggest that K+ and Mg2+ enhance cell growth at CHT via different mechanisms,
3.2 Introduction
Recently, bioethanol has gained attention as an alternative to fossil fuel because as a carbon-neutral fuel, it can potentially delay the progress of global warming (Hahn-Hägerdal et al., 2006; Chisti, 2008). However, industrial scale bioethanol production requires a more cost-effective process to be economically competitive. High-temperature fermentation (HTF; which enables fermentation at a temperature 5 10°C higher than that used in the conventional process) may reduce (1) cooling cost, (2) running cost at the simultaneous saccharification and fermentation stage, and (3) contamination risks (Abdel-Banat et al., 2010; Kosaka et al., 2018). Bioethanol production by HTF requires high-efficiency ethanol production and thermotolerant microorganisms. Zymomonas mobilis, a Gram-negative, facultative, anaerobic bacterium, performs high-speed ethanol production (He et al., 2014) compared with the conventional ethanol producer Saccharomyces cerevisiae, whose cultivation temperature of >35°C is not permissible for yeast growth (Aldiguier et al., 2004). Z. mobilis, which uses the Entner Doudoroff pathway and an incomplete TCA cycle, is facultatively anaerobic and requires no oxygen for its growth; conversely, it assimilates glucose, fructose, and sucrose as the sole carbon sources (Panesar et al., 2006; He et al., 2014). We focused on Z. mobilis TISTR 548, one of the thermotolerant Z. mobilis strains that grew at 39°C (Sootsuwan et al., 2007) and developed thermotolerant mutants by thermal adaptation enhancement of its critical high temperature (CHT), an upper limit for survival, up to 2°C (Matsushita et al., 2016; Kosaka et al., 2019). We subsequently used this mutant strain with HTF using a model fermentation and distillation system to reveal the effectiveness of this method and bioethanol productivity by HTF with Z. mobilis (Murata et al., 2015).
Metal ions enhance the growth of ethanologenic microorganisms at CHT. Microorganisms require several ions as essential metals for the normal function and
homeostasis of a wide range of cellular proteins (Reid et al., 2009), but these ions are toxic at high concentrations (Gadd, 1992). Among these ions, only Mg2+ has been reported to
enhance thermotolerance in Z. mobilis strains (Thanonkeo et al., 2007). Moreover, Mg2+ helped recover thermosensitive mutants of Z. mobilis TISTR 548, in which genes for
membrane stabilization or membrane formation were disrupted, suggesting that at CHT, Mg2+ stabilizes membrane structure and protects cells from heat (Charoensuk et al., 2017).
Mg2+ also stabilizes the outer membrane (OM) structure, at least of lipopolysaccharide (LPS),
of cells by divalent cation crossbridging (bridging action) in Gram-positive bacteria (Nikaido, 2003). Studies on several microorganisms, particularly Escherichia coli (Murata et al., 2011) and Lactobacillus strains (Yang et al., 2017), have revealed the thermotolerance-enhancing effect of Mg2+. However, although the enhancing effects of K+ and Ca2+ on S. cerevisiae
(Lam et al., 2014) and lactic acid bacteria (Huang and Chen, 2013), respectively, have been reported, there is no report about the enhancement effects of these and other metals on Z. mobilis growth at CHT. This evidence suggests that the concentration of several metals in a fermentation medium is important for efficient HTF for bioethanol production. However, the effect of a wide range of metals on Z. mobilis TISTR 548 at CHT is yet to be investigated. Besides, the mechanism underlying the effects of these metals, such as Mg2+, on cell
physiology at CHT remains unclear.
In this study, the effects of metal ions, i.e., Mn2+, Ni2+, Co2+, Al3+, Fe3+, Zn2+, Mg2+,
K+, and Ca2+, on Z. mobilis TISTR 548 growth at CHT were observed. Moreover, the effects
of Mg2+ and K+ (these metals enhanced growth at CHT) on the physiology
3.3 Materials and methods
3.3.1 Bacterial strains, media, and cultivation conditions
The bacterial strains used in this study are listed in Table 3.1. To grow Z. mobilis, a preculture was prepared in 2 mL of YPD medium (0.3% yeast extract, 0.5% peptone, and 3% glucose) and incubated overnight at 30 C. The overnight culture was subsequently inoculated into fresh YPD medium at an OD550 of 0.05. Cultivation was performed under non-shaking
(static) conditions.
3.3.2 Examination of the effects of various materials on cell growth
To compare the effects of additional reagents, cells were subjected to two-step cultivation (Kosaka et al., 2019) at the same temperature to observe the effect of temperature or additional reagents. Two-step cultivation can simply determine the temperature-upper limit for the survival of cells because when the first culture is performed at a temperature just above a CHT, cells cannot grow in the second culture at the same temperature (Kosaka et al., 2019). In the first culture, the OD value of the culture increases even at a temperature over CHT because of cell elongation. The CHT of Z. mobilis TISTR 548 has been determined to be 38 C by this method (Kosaka et al., 2019). Reagents were added to a medium at the desired condition before each inoculation. Briefly, the first cultivation was performed until the culture attained a late log phase at a temperature around a putative CHT; then, a portion of the first culture was transferred into a fresh medium at an OD550of 0.05 and cultured at the
3.3.3 Cell morphology
Cell morphology was observed using phase-contrast microscopy (E6F-RFK-1, Nikon, Tokyo, Japan). In total, 100 cells were randomly selected on microphotographs, and their length was measured using ImageJ (Schneider et al., 2012).
Table 3.1 List of Z. mobilis strains used in this study
Strains Genotypes References or Sources
TISTR548 TISTR collections
TC01 TISTR548 (ZZ6_0707::Tn10) Charoensuk et al., 2017 TC03 TISTR548 (ZZ6_1376::Tn10) Charoensuk et al., 2017 TE12 TISTR548 (ZZ6_1146::Tn10) Charoensuk et al., 2017 C12-36 TISTR548 (ZZ6_1551::Tn10) Charoensuk et al., 2017 C11-44 TISTR548 (ZZ6_1046::Tn10) Charoensuk et al., 2017 C13-36 TISTR548 (ZZ6_1210::Tn10) Charoensuk et al., 2017 TC04 TISTR548 (ZZ6_0923::Tn10) Charoensuk et al., 2017 1-2 TISTR548 (ZZ6_1043::Tn10) Charoensuk et al., 2017 3-24 TISTR548 (ZZ6_0929::Tn10) Charoensuk et al., 2017 TC14 TISTR548 (ZZ6_0158::Tn10) Charoensuk et al., 2017 C31-23 TISTR548 (ZZ6_1254::Tn10) Charoensuk et al., 2017 TC15 TISTR548 (ZZ6_1477::Tn10) Charoensuk et al., 2017 F32 TISTR548 (ZZ6_0616::Tn10) Charoensuk et al., 2017 C12-43 TISTR548 (ZZ6_0934::Tn10) Charoensuk et al., 2017 TC10 TISTR548 (ZZ6_0681::Tn10) Charoensuk et al., 2017 C12-44 TISTR548 (ZZ6_0023::Tn10) Charoensuk et al., 2017 C21-17 TISTR548 (ZZ6_1659::Tn10) Charoensuk et al., 2017 TC05 TISTR548 (ZZ6_0980::Tn10) Charoensuk et al., 2017 TC12 TISTR548 (ZZ6_0702::Tn10) Charoensuk et al., 2017 TE19 TISTR548 (ZZ6_0979::Tn10) Charoensuk et al., 2017 C31-15 TISTR548 (ZZ6_0019::Tn10) Charoensuk et al., 2017 TC11 TISTR548 (ZZ6_0840::Tn10) Charoensuk et al., 2017 C12-37 TISTR548 (ZZ6_0962::Tn10) Charoensuk et al., 2017 TC09 TISTR548 (ZZ6_0541::Tn10) Charoensuk et al., 2017 TC13 TISTR548 (ZZ6_0861::Tn10) Charoensuk et al., 2017 1-10 TISTR548 (ZZ6_1289::Tn10) Charoensuk et al., 2017
3.3.4 Intracellular reactive oxygen species Level
Zymomonas mobilis TISTR 548 cells were grown on YPD medium at 39 C. At 12
2DCFDA was added to the first culture, and further cultivation was performed at
39 C for 30 min. Then, cells were harvested by low-speed centrifugation and washed once with phosphate-buffered saline [130 mM NaCl, 10.8 mM Na2HPO4, 4.2 mM NaH2PO4 (pH
7.2)]. The washed cells were disrupted by sonication for 30 min using an ultrasonic cell disruptor (Bioruptor; Cosmo Bio, Tokyo, Japan) and subjected to low-speed centrifugation. Supernatant fluorescence was measured using a microplate reader (POWERSCAN® HT;
BioTek Instruments, Inc., Winooski, VT, United States). Protein concentration was determined using the Lowry method (Dulley and Grieve, 1975). The result obtained for intracellular reactive oxygen species (ROS) levels is expressed as fluorescence intensity per protein concentration, and the ratio of the number of cells grown in the presence of a metal ion to that of cells grown in its absence was estimated and expressed as percentage.
3.3.5 Ethanol concentration
Ethanol concentration was analyzed using a gas chromatograph (GC-2014, Shimadzu, Kyoto, Japan) equipped with a flame ionization detector and Gaskuropack 54-packed glass column (60/80 mesh; GL Science, Tokyo, Japan); nitrogen was used as a carrier gas (flow rate, 35 mL/min). Operating temperatures were as follows: injection temperature, 200 C; column temperature, 180 C; and detector temperature, 200 C.
3.4 Results
3.4.1 Effects of metal ions on Z. mobilis TISTR 548 growth at CHT
To explore the metal ions that enhance Z. mobilis TISTR 548 growth at putative CHT, the growth levels with and without the addition of Ni2+, Zn2+, Fe3+, Al3+, Mn2+, Co2+,
Mg2+, and K+ were compared. The effect of the addition of metal ions was evaluated with
two-step cultivation, wherein only viable and culturable cells grow, whereas dead or viable but non-culturable cells do not grow in fresh medium at the second cultivation (Kosaka et al., 2019). At 38 C and 39 C, the growth level under the conditions of 0.01 mM NiCl2, ZnCl2 ,
FeCl3 , AlCl3 , MnCl2 , and CoCl2 was the same as that without the addition of metal ions
(Figure 3.1). On the contrary, the addition of >0.1 mM NiCl2 and CoCl2 led to a lower
growth level than no addition of metal ions at the first stage of cultivation (Figures 3.1
A,B,K,L). Similarly, the growth level following the addition of ZnCl2 and MnCl2was lower
at 1 mM (Figures 3.1 C,D,I,J). The growth trend did not change distinctly between 38 and 39 C (Figure 3.1). Ten millimolar CaCl2 or 10 mM NaCl suppressed growth in the second
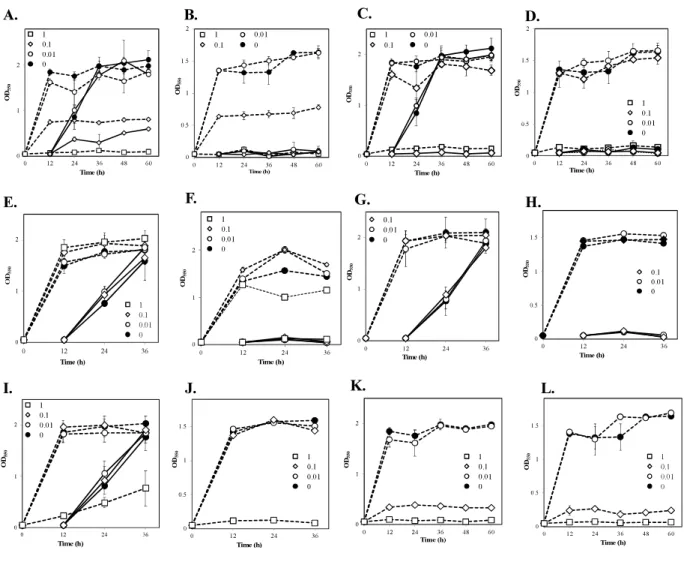
step of Z. mobilis TISTR 548 cultivation at 38 C (data not shown). On the other hand, when MgCl2 and KCl were added to the medium, there was a 1 higher growth than there was
without adding metals even at 39 C (Figures 3.2 A C). At 39.5 C, there was negligible growth in the presence of MgCl2 and KCl (Figure 3.2D). The results suggested that the
optimum concentrations of MgCl2 and KCl for growth enhancement at 39 C were 5 and 30
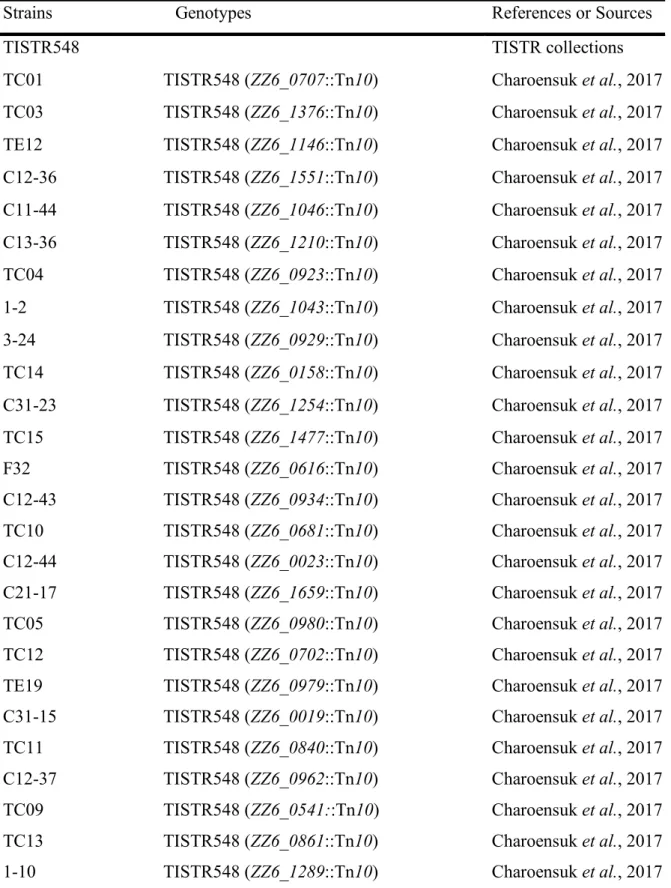
Figure 3.1 Effects of various metal ions on thr two-step cultivation of Zymomonas mobilis
TISTR 548. Cells were cultivated in YPD medium at 38oC with different concentrations of
NiCl2 (A), ZnCl2 (C), FeCl3 (E), AlCl3 (G), MnCl2 (I), or CoCl2 (K) and at 39oC with NiCl2
(B), ZnCl2 (D), FeCl3 (F), AlCl3 (H), MnCl2(J), or Cocl2 (L) under a static condition. These
symbols indicate the means of three replicates, and error bars indicate standard deviations: closed circle, control (0 mM), open circle, 0.01 mM; open diamond, 0.1 mM; and open square, 1.0 mM. Dotted and solid lines indicate the OD values of the first and second stages of cultivation, respectively.
Figure 3.2 Effects of Mg2+ and K+ on the growth of Zymomonas mobilis TISTR 548 at
critical high temperatures. Cells were cultivated in YPD medium with several concentrations of MgCl2 (A: closed circle, 0 mM; open circle, 5 mM: open diamond, 10 mM; open square,
20 mM; and open triangle, 40 mM) and KCl (B: closed circle, control, 0 mM; open circle, 10 mM; open diamond, 20 mM; open square, 50 mM; open triangle up, 100 mM; and close triangle, 200 mM) at 39oC under static condition. At 39oC (C) and 39.5 oC (D), 5 mM MgCl2
(open circle), 30 mM KCl (open diamond), and a combination of these metals (open square), were added, and two-step cultivation was performed. Values and error bars represent means and standard deviations, respectively, for triplicate cultures.
3.4.2 Physiological effects of Mg and K on Z. mobilis TISTR 548 at CHT
Our previous report indicated that the cell length of Z. mobilis increased at CHT, and this increase reduced in thermotolerance- enhanced mutants (Kosaka et al., 2019). Indeed, cells grown at 39 C had longer cells than those grown at 30 C, which had granular shapes (Figures 3.3 A, B). Cell morphology observed following the addition of MgCl2 or
KCl indicated that cell length increased, with the increase in cell length being relatively lower following the addition of Mg2+at 39 C than without the addition of metal ions (Figure 3.3C).
On the other hand, the addition of KCl had no clear effect on cell length at 39 C, with a predominance of longer filamentous cells (Figure 3.3D). Cells cultured with both metals showed a mixture of granular and long filamentous shapes (Figure 3.3E). Indeed, the median value of measured cell length at 30 C, at 39 C, with MgCl2 at 39 C, with KCl at 39 C, or
with both metals at 39 Figure 3.3F).
Ethanol productivity at 39 C was also recovered to be close to the theoretical yield by adding MgCl2 or KCl (Figure 3.3G). Accumulation of intracellular ROS was observed in Z. mobilis
TISTR 548 at CHT (Kosaka et al., 2019). Addition of MgCl2 or KCl considerably reduced
intracellular ROS levels at 39 C, and the reduction strength was the highest for only K+,
Figure 3. 3 Effect of Mg2+ and K+ on the physiology of Zymomonas mobilis TISTR 548 at
critical high temperatures. Under all conditions, the final concentrations of the added MgCl2
and KCl were 5 and 30 mM, respectively. (A-E) Morphology of cells grown in YPD medium at 30oC (A) or 39oC (B) with MgCl2 (C), or KCl (D), or both (E) for 7 h under a static
condition. Photographs were taken at a magnification of x400. Bars indicate 10 µm. (F) A box plot of cell length from 100 cells measured in these conditions. The median cell length under each condition is shown as a number. (G) Ethanol concentration was measured in culture at 39oC for 12 h in YPD medium under a static condition. (H) The intracellular ROS
level was measured in culture at 39oC for 12 h. Index was calculated as the ratio of the
fluorescence intensity and protein concentration to the values of the control. Values and error bars represent means and standard deviation, respectively, for triplicate experiments.
3.4.3 Effects of Mg2+and K+on Z. mobilis TISTR 548 growth at CHT
Previous results indicated that Mg2+and K+ somehow affect the cell physiology of
Z. mobilis TISTR 548 at CHT and reduce intracellular ROS levels but probably by different mechanisms. Several bacteria use glutathione as a reducing agent to maintain a strongly reducing environment in cells, and glutathione peroxidase is an ROS-scavenging enzyme (Cabiscol Catal et al., 2000). We observed the effect of glutathione with MgCl2 or KCl on
cell growth when glutathione was added at several concentrations: 4 mM glutathione inhibited cell growth at 39 C (data not shown) but 0.5 mM did not (Figure 3.4A). An Mg2+
plus glutathione effect was observed, but the effect was not considerably distinct from that observed following the addition of K+ or both metals (Figures 3.4 B D). Next, an effective
concentration of EDTA as a chelator of a divalent cation on cell growth at a CHT were explored, and then effects of metals under the presence of such a concentration of EDTA at a CHT were examined. When 0.05 mM EDTA was added to culture, cell growth was inhibited at 38 C (Figure 3.5A). MgCl2 or KCl was subsequently added under the above condition,
and the resulting effect was observed. The addition of Mg2+rescued EDTA inhibition at CHT
Figure 3.4 Effect of GSH with Mg2+ or K+ on the growth of Zymomonas mobilis 548. (A)
Cells were grown in YPD medium with (open diamond) or without 0.5 mM GSH) control, closed diamond) at 39oC under a static condition. (B-D) Cells were grown in YPD medium
containing 5 mM MgCl2 (B), 30 mM KCl (C), or both 5 mM MgCl2 and 30 mM KCl (D)
with (open circle) or without 0.5 mM GSH (closed circle) at 39oC under a static condition.
After 12 h, the first-stage culture (dotted lines) was inoculated into a fresh medium and subjected to sybsequent (second stage) cultivation (solid lines) under the same medium condition. Additional and non-additional conditions of GSH are shown as open and closed circles, respectively. Values and error bars represent means and standard deviations, respectively, for triplicate cultures.
Figure 3.5 Effect of EDTA with Mg2+ or K+ on the growth of Zymomonas mobilis TISTR
548. (A) Cells were subjected to two-step cultivation (dotted line, first; solid line, second) in YPD medium with 0.01 mM EDTA (open circle), 0.05 mM EDTA (open diamond) or without EDTA (closed circle at 38oC under a static condition. (B,C) At the first stage of
cultivation, cells were cultured in YPD medium containing 0.05 mM EDTA (open diamond) at 38 oC, and after 12 h, at the second stage of cultivation (open circle), 5 mM MgCl2(B) or
30 mM KCl (C) was added to YPD medium containing 0,05 mM EDTA. Values and error bars represent means and standard deviations, respectively, for triplicate cultures.
3.4.4 Effects of Mg2+and K+on the Growth of Thermosensitive Mutants
In a previous study, 26 thermosensitive single gene-disrupted mutants of Z. mobilis TISTR 548 were isolated (Charoensuk et al., 2017). To observe the effects of the addition of Mg2+and K+on these thermosensitive mutants, their growth upon the addition of each metal
was examined. Addition of Mg2+significantly enhanced the growth of three mutants, whereas
it inhibited the growth of one mutant (Table 3.2). Further, the addition of K+ enhanced the
growth of nine mutants, i.e., almost one-third of all thermosensitive mutants, but it inhibited the growth of one mutant (C13-36) at 39.5 C (Table 3.2). Remarkably, the addition of both Mg2+and K+enhanced the growth of only one mutant with gene encoding for phospholipase
D; they had the opposite effect on the mutant TC13 (Table 3.2). These results also suggest that Mg2+and K+affect the cell physiology of Z. mobilis TISTR 548 differently at CHT.