Correspondence: Koji Kadota, Graduate School of Agricultural and Life Sciences, The University of Tokyo, 1-1-1 Yayoi, Bunkyo-ku, Tokyo 113-8657, Japan. Tel: +81-3-5841-1295; Fax: +81-3-5841-1136;
Email: [email protected]
Please note that this article may not be used for commercial purposes. For further information please refer to the copyright statement at http://www.la-press.com/copyright.htm
Evaluation of Two Outlier-Detection-Based Methods for
Detecting Tissue-Selective Genes from Microarray Data
Koji Kadota1, Tomokazu Konishi2 and Kentaro Shimizu1
1Graduate School of Agricultural and Life Sciences, The University of Tokyo, 1-1-1 Yayoi,
Bun-kyo-ku, Tokyo 113-8657, Japan. 2Faculty of Bioresource Sciences, Akita Prefectural University,
Shimoshinjyo, Nakano, Akita 010-0195, Japan.
Abstract: Large-scale expression profi ling using DNA microarrays enables identifi cation of tissue-selective genes for which expression is considerably higher and/or lower in some tissues than in others. Among numerous possible methods, only two outlier-detection-based methods (an AIC-based method and Sprent’s non-parametric method) can treat equally various types of selective patterns, but they produce substantially different results. We investigated the performance of these two methods for different parameter settings and for a reduced number of samples. We focused on their ability to detect selective expres-sion patterns robustly. We applied them to public microarray data collected from 36 normal human tissue samples and analyzed the effects of both changing the parameter settings and reducing the number of samples. The AIC-based method was more robust in both cases. The fi ndings confi rm that the use of the AIC-based method in the recently proposed ROKU method for detecting tissue-selective expression patterns is correct and that Sprent’s method is not suitable for ROKU.
Keywords: microarray, tissue selectivity, differential expression, AIC.
Introduction
The majority of microarray studies have focused on the detection of differentially expressed genes. Of these, tissue-selective genes for which expression in a single or small number of tissues is signifi cantly different than in other tissues have attracted great interest due to their value in revealing the biological and physiological functions of tissues and organs at the molecular level (Kadota et al. 2006; Liang et al. 2006).
Numerous methods have been used to detect tissue-selective genes in microarrays (Greller and Tobin, 1999; Pavlidis and Noble, 2001; Kadota et al. 2003a; Schug et al. 2005; Ge et al. 2005; Yanai et al. 2005; Liang et al. 2006; Kadota et al. 2006). Of these, A recent study (ROKU; Kadota et al. 2006) demonstrated the effectiveness of using both Shannon entropy for ranking genes on the basis of their tissue selectivity (Schug et al. 2005) and an outlier-detection-based method for identifying tissues in which a gene is selective (the AIC-based method; Kadota et al. 2003a). However, it did not clarify why an AIC-based method was used even though other types of outlier-detection-based methods are applicable (Kadota et al. 2006). For example, Sprent’s non-parametric method could be used (Ge et al. 2005).
Methods
Gene expression data
Expression data for normal human tissues were obtained from a dataset consisting of data for 36 various types of tissues in Affymetrix high-density oligonucleotide microarrays representing 22283 clones and controls (http://www.genome.rcast. u-tokyo.ac.jp/normal/). The raw (probe-level) data were processed using the SuperNORM algorithm (Konishi, 2004 and 2006) and log2 transformed.
Detecting speci
fi
c tissues using
the AIC-based method
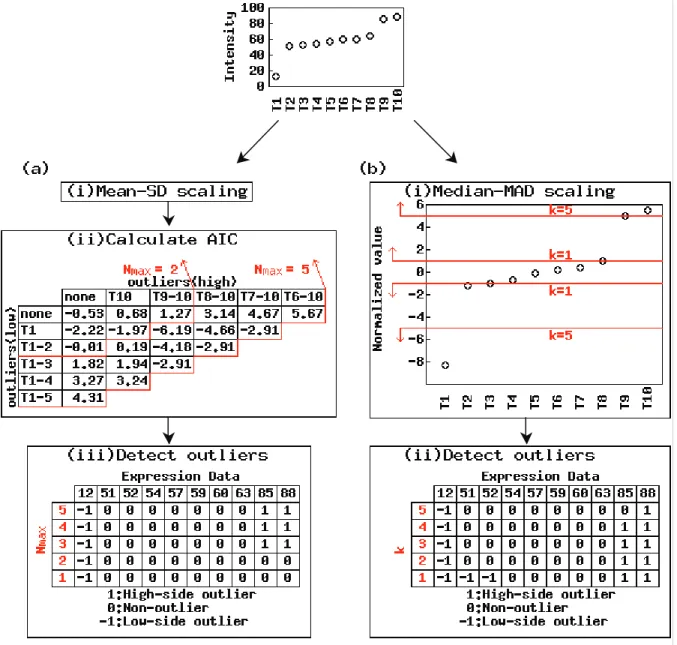
Detection of specifi c tissues using the AIC-based method (Kadota et al. 2003a) is performed as follows: (i) normalize gene vector x = (x1, x2, …, xN) for N
tissues (x1 < x2 … < xN) by subtracting the mean and dividing by the standard deviation (SD); (ii) calculate statistics U = n× logσ + 2× s × (logn!)/n
for various combinations of outlier candidates, where n and s denote the numbers of non-outlier and outlier candidates and σ denotes the SD of the observations of the n non-outlier candidates; and (iii) regard tissues corresponding to outliers detected in the combination of minimum U as specifi c. The maximum number, Nmax, of outlier candidates was originally set to N/2 (Kadota et al. 2003a). We analyzed the effect of changing Nmax. The R code is available in the additional fi le 2.
Detecting speci
fi
c tissues using
Sprent’s method
Detection of specifi c tissues using Sprent’s non-parametric method (Ge et al. 2005) is performed as follows: (i) normalize gene vector x = (x1, x2, …, xN) for N tissues by subtracting the median and dividing by the median absolute deviation (MAD); (ii) regard tissues corresponding to absolute values >k as specifi c. Parameter k was originally set to 5 (Ge et al. 2005). We analyzed the effect of changing k.
Results and Discussion
The purpose of this study was to compare two outlier-detection-based methods (the AIC-based method and Sprent’s non-parametric method) for the detection of tissues in which a gene is selective. Compared to other statistical methods excluding
ROKU, which uses the AIC-based method (Kadota et al. 2006), both methods have two advantages. First, they can treat equally various types of tissue-selective genes: (a) ‘up-type’ genes tissue-selectively over-expressed in a single or small number of tissues, (b) ‘down-type’ genes selectively under-expressed in some tissues, and (c) ‘mixed-type’ genes selectively over- and under-expressed in some tissues (Kadota et al. 2006). Second, they can extract genes whose expression is considerably different only in arbitrarily selected tissues. Other methods such as template matching (Pavlidis and Noble, 2001) and Schug’s Q-statistic (Schug et al. 2005) sometimes detect genes considerably different in other tissues in addition to the objective tissue (Kadota et al. 2003a; Kadota et al. 2006).
Although neither method can rank genes on the basis of their overall tissue selectivity, ROKU can compensate for this by adding an entropy-based score for individual genes (Kadota et al. 2006). For ROKU users who want to detect various types of tissue-selective patterns, the remaining issue is whether another published method (Sprent’s method; Ge et al. 2005) is suitable for ROKU. Fortunately, the two methods have two common characteristics: (i) the same output format and (ii) only one parameter can affect the output (Nmax for the AIC-based method and k for Sprent’s method). These similarities facilitate direct comparison with no modifi cations.
Here we examine the effects of (1) different parameter settings and (2) a reduced number of samples on robustness. We do this using the expression data for 22283 clones and 36 samples. We fi rst present an example using a hypothetical expression vector for ten tissues, x = (12, 51, 52, 54, 57, 59, 60, 63, 85, 88) and then evaluate the two methods using actual microarray data. Both methods output a vector (consisting of 1 for over-expressed outliers, –1 for under-over-expressed outliers, and 0 for non-outliers) that corresponds to the input expression vector. We only need compare these outlier vectors.
is small and k is large. For example, reducing Nmax, which is the maximum number of outlier candi-dates, from 5 to 1 produced two different outlier vectors: (–1, 0, 0, 0, 0, 0, 0, 0, 1, 1) for Nmax = 3 to 5 and (–1, 0, 0, 0, 0, 0, 0, 0, 0, 0) for Nmax = 1 and 2 (Figure 1a). This is not surprising since the latter values of Nmax are less than the number of outliers detected using the former values of Nmax (1 or 2 <3). There is also some variation in the outlier vectors produced using different values of parameter k in Sprent’s method (Figure 1b).
For the hypothetical vector, the two outlier-detection-based methods with the default parameter
settings (Nmax = k = 5) produce different outlier vectors. The difference is whether the second highest observation (the value of “85”) is detected as an over-expressed outlier (the AIC-based method) or a non-outlier (Sprent’s method). Since we designed the original hypothetical expression vector to have three significantly different observations than in the others (the same as the outlier vector obtained using the AIC-based method), the observation should be detected as an over-expressed outlier. Some researchers, however, disagree with our judgment and think, for example, there is only one tissue (T1) in which the
hypothetical vector is selective. The fi nal decision about tissue selectivity thus suffers from some subjectivity. Accordingly, we would be unable to determine which of the alternative methods performs better even if demonstrations for many hypothetical expression vectors and many actual vectors were provided. Figure 1 merely presents an example of producing different outlier vectors with different parameter settings.
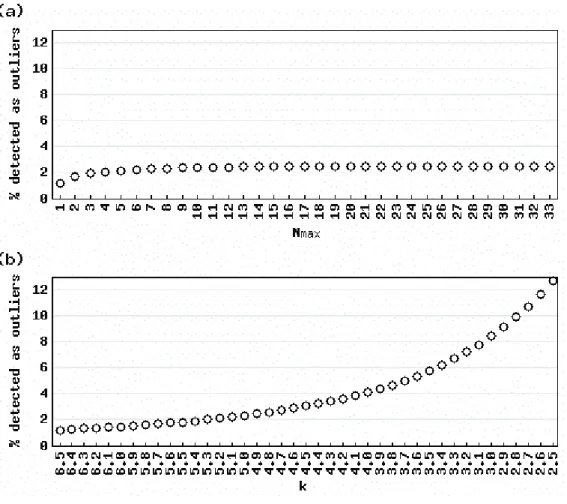
Figure 2 shows the average percentage of detected outliers for various values of Nmax
(Figure 2a) and k (Figure 2b) when actual gene expression vectors for 36 normal human tissues (Ge et al. 2005) were analyzed. The results with the default parameter settings (Nmax = N/2 = 18; k
= 5) yielded similar average percentages: 2.43% for the AIC-based method and 2.32% for Sprent’s method. Clearly, the percentages for the AIC-based method were insensitive to changes in the parameter value while those for Sprent’s method were sensitive. For example, changing Nmax from 9
(N*1/4) to 27 (N*3/4) yielded a difference of 0.06% (2.43– 2.37%) (Figure 2a), while changing
k from 4.0 to 6.0 yielded a difference of 2.64% (4.11–1.47%) (Figure 2b). Although the ranges for the AIC-based method (9–27) and Sprent’s method (4.0–6.0) are not directly comparable, these parameters are possible. These results suggest that researchers who want a method for detecting tissues in which a gene is selective that is insensitive to variations in these parameters should use the AIC-based method. The “outlier matrix” (consisting of 1 for over-expressed outliers, –1 for under-expressed outliers, and 0 for non-outliers) that corresponds to the actual gene expression matrix when the AIC-based method is used with the default parameter setting is available in the additional fi le 1.
An interesting exercise is to change the 2 in the AIC criterion for detecting outliers to other values such as 1 or 2 though the original equation (U = n × logσ + 2× s × (logn!)/n) has a solid
theoretical basis (Ueda T, 1996; Kadota et al. 2003a; Kadota et al. 2003b). A decrease (or increase) in the weight for the penalty results in an increased (or decreased) number of outliers. Changing 2 to 1 (or 2) with the default value of
Nmax (18) yielded 5.19% (or 1.13%) for the average percentage of detected outliers. The AIC-based method remained robust against changes in Nmax
when these other weights were used (data not shown).
Effect of reduced number of samples
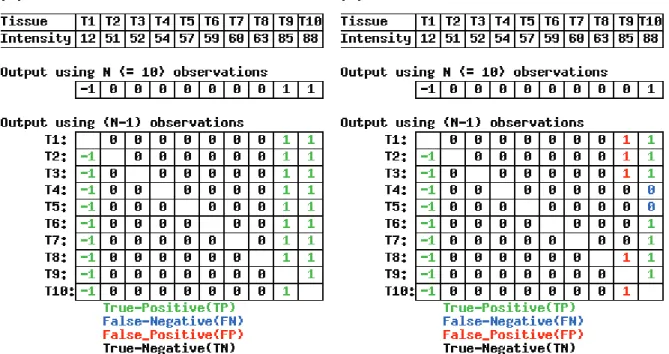
In addition to the effect of different parameter settings, outlier vectors could also vary with the addition or reduction of samples even when the same parameter values are used. To examine the effect of reducing the number of samples, we generatedN leave-one-out input vectors consisting of (N–1) samples from an expression vector originally consisting of N samples. Consider, for example, a hypothetical vector consisting of ten observations. Ten leave-one-out input vectors, each of which has nine observations, can be analyzed. If the method is good, the ten leave-one-out output vectors should be the same as the original output vector of ten observations.
Figure 3 shows the results of the “leave-one-out outlier detection” (LOOOD) analysis for the hypothetical vector using (a) the AIC-based method and (b) Sprent’s method, with the default parameter settings (Nmax = k = 5). Clearly, the AIC-based method is more robust against a reduction in the number of samples, at least for this hypothetical expression vector.
To examine the two methods further using actual data, we defi ned a basis for evaluation as follows: (i) the outlier vector obtained from the original vector (not a leave-one-out vector) is “true,” (ii) the outliers (“–1” or “1”) in the outlier vector are “positive,” and (iii) the non-outliers (“0”) are “negative.” Accordingly, the LOOOD results give rise to four quantities:
True positive (TP): outliers that are detected as outliers in the outlier vector obtained from the original expression vector consisting of N
observations
True negative (TN): non-outliers that are detected as non-outliers in the original outlier vector
False positive (FP): outliers that are detected as non-outliers in the original outlier vector
False negative (FN): non-outliers that are detected as outliers in the original outlier vector
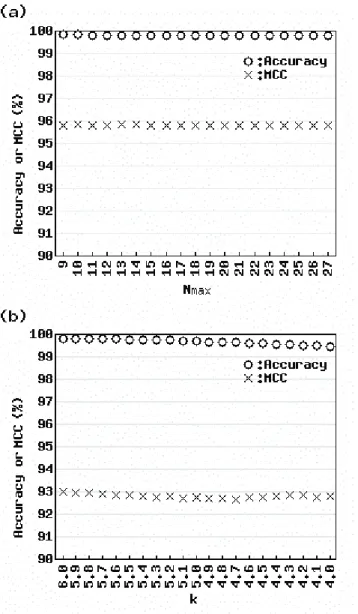
For example, the values for Sprent’s method (Figure 3b) were TP = 16, TN = 67, FP = 5, and FN = 2. Zviling et al. (2005) stated that any single number that represents the power of the method must account for all the categories listed above. We defi ne two such numbers: “accuracy” = (TP + TN)/ (TP + TN + FP + FN) and “Matthews correlation coeffi cient (MCC)” = (TP*TN - FP*FN)/((TP + FN)*(TN + FP)*(TP + FP)*(TN + FN))1/2 (Matthews, 1975). Accuracy represents the fraction of the unchanged vectors among LOOOD test, and MCC represents the correlation between the original vector and the LOOOD results when the Pearson correlation coeffi cient is used. These statistics can take values in the following ranges: 0 ⱕ accuracy
ⱕ1; –1 ⱕ MCC ⱕ1. The higher the value, the greater the robustness against a reduction in the number of samples. The LOOOD results for the hypothetical vector and Sprent’s method were accuracy = 92.22% and MCC = 77.50% (Figure 3b); for the AIC-based method (Figure 3a), they were accuracy = MCC = 100% since FP = FN = 0.
Figure 4 shows the LOOOD results for actual data using (a) the AIC-based method and (b) Sprent’s method. Accuracy and MCC were calculated for each parameter value (Nmax = 9 – 27 and k = 4.0 – 6.0) around the default values (Nmax = 18 and k = 5). Obviously, the values for the AIC-based method were higher than those for Sprent’s method. We verified these results by varying the value of N in leave-N-out outlier detection (data not shown). These results suggest that the AIC-based method is less affected by slight changes in the input vector than Sprent’s method.
As mentioned above, objective comparison of methods for detecting tissue-selective patterns is understandably diffi cult. We know of only two reports in which the authors explicitly compared their method to other methods using the same dataset: (i) Kadota et al. (2003a) reported that the AIC-based method is superior to template matching and ANOVA, and (ii) Kadota et al. (2006) reported that ROKU can compensate for the disadvantages of the AIC-based method and of the entropy-based method proposed by Schug et al. (2005). The reports on the consistency between the results for a reduced number of samples and those for all the samples (Broberg P, 2003; Breitling et al. 2004) are of limited value because the results for all the samples were assumed to be correct (Jeffery et al. 2006). There is of course no guarantee, but it is probably safe to say that a higher number of
samples should produce better results. Therefore, we still appreciate the advantages of the AIC-based method compared to Sprent’s method.
Conclusion
We compared two outlier-detection-based methods previously used for the detection of tissue-selective genes. The AIC-based method was found to be better than Sprent’s non-parametric method in terms of robustness of the output against (1) a change in the parameter settings and (2) a reduction in the numbers of samples. These fi ndings suggest that the use of the AIC-based method rather than Sprent’s method in the recently proposed ROKU
Figure 4.Effect of reduced number of samples for actual data.
method for detecting tissue-selective expression patterns was correct.
More work remains to be done. First, while the AIC-based method has clear advantages compared to Sprent’s method, the Bayesian information criterion (BIC) should also be applicable. It would be interesting to develop a BIC-based method and compare its performance to that of the AIC-based method. Second, the approach used here is not suitable for comparing ROKU with other methods such as the Tukey-Kramer’s honestly signifi cant difference test due to their different output formats and the lack of genuine tissue-selective genes. We plan to develop a better approach for comparing a number of methods for detecting tissue-selective expression patterns.
Acknowledgements
We are greatful to M. Abe for his helpful discus-sions and J. J. Rodrigue for helping to improve the English. This study was performed through Special Coordination Funds for Promoting Science and Technology of the Ministry of Education, Culture, Sports, Science and Technology, the Japanese Government. This study was also supported by a Grant-in Aid for Young Scientists (B) (19700273) to K. Kadota from the Ministry of Education, Culture, Sports, Science and Technology, the Japanese Government.
References
Breitling, R., Armengaud, P., Amtmann, A. et al. 2004. Rank products: a simple, yet powerful, new method to detect differentially regulated genes in replicated microarray experiments. FEBS Lett., 573:83–92. Broberg, P. 2003. Statistical methods for ranking differentially expressed
genes. Genome Biol., 4:R41.
Fan, W., Pritchard, J.I., Olson, J.M. et al. 2005. A class of models for analyzing GeneChip gene expression analysis array data. BMC Genomics, 6:16.
Ge, X.J., Yamamoto, S., Tsutsumi, S. et al. 2005. Interpreting expression profi les of cancers by genome-wide survey of breadth of expression in normal tissues. Genomics, 86:127–141.
Greller, L.D., Tobin, F.L. 1999. Detecting selective expression of genes and proteins. Genome Res., 9:282–296.
Jeffery, I.B., Higgins, D.G. and Culhane, A.C. 2006. Comparison and evaluation of methods for generating differentially expressed gene lists from microarray data. BMC Bioinformatics, 7:359.
Kadota, K., Nishimura, S.I., Bono, H. et al. 2003a. Detection of genes with tissue-specific expression patterns using Akaike’s Information Criterion (AIC) procedure. Physiol. Genomics, 12:251–259. Kadota, K., Tominaga, D., Akiyama, Y. et al. 2003b. Detecting outlying
samples in microarray data: A critical assessment of the effect of outliers on sample classifi cation. Chem-Bio Informatics J. 3:30–45. Kadota, K., Ye, J., Nakai, Y. et al. 2006. ROKU: a novel method for
identifi cation of tissue-specifi c genes. BMC Bioinformatics, 7:294. Konishi, T. 2004. Three-parameter lognormal distribution ubiquitously
found in cDNA microarray data and its application to parametric data treatment. BMC Bioinformatics, 5:5.
Konishi, T. 2006. Detection and restoration of hybridization troubles in Affymetrix GeneChip data by parametric scanning. Genome Inform., 17:100–109.
Liang, S., Li, Y., Be, X. et al. 2006. Detecting and profi ling tissue-selective genes. Physiol. Genomics, 26:158–162.
Matthews, BW. 1975. Comparison of the predicted and observed secondary structure of T4 phage lysozyme. Biochim. Biophys. Acta., 405:442–451.
Pavlidis, P. and Noble, WS. 2001. Analysis of strain and regional variation in gene expression in mouse brain. Genome Biol., 2: research 0042.
Schug, J., Schuller, W.P., Kappen, C. et al. 2005. Promoter features related to tissue specifi city as measured by Shannon entropy. Genome Biol., 6: R33.
Ueda, T. 1996. Simple method for the detection of outliers [in Japanese]. Japanese J. Appl. Stat., 25:17–26.
Yanai, I., Benjamin, H., Shmoish, M. et al. 2005. Genome-wide midrange transcription profi les reveal expression level relationships in human tissue specifi cation. Bioinformatics, 21:650–659.
Zviling, M., Leonov, H. and Arkin, I.T. 2005. Genetic algorithm-based optimization of hydrophobicity tables. Bioinformatics, 21:2651–2656.
Additional File
Additional fi le 1 (additional.txt) – includes all data analyzed using AIC-based method for dataset of Ge et al. (2005).
For the original gene expression matrix, an outlier matrix (consisting of 1 for over-expressed outliers, -1 for under-expressed outliers, and 0 for non-outliers) is provided. It also contains an entropy score (H’) measured by ROKU.
Additional fi le 2 (r_code.txt) – R function of AIC-based method. The R function for the AIC-based method is provided. An example analysis