studies; the EAT volume (EATV) was associated with a 2.6-fold higher odds ratio (OR) of the prevalence of AF (2.61 per SD increase), which contradicts the finding that the associations of abdominal and overall adiposities with the prevalence of AF were lesser (OR per SD: 1.32 for waist circumference, 1.11 for waist/hip ratio, and 1.22 for body mass index [BMI]).7
As just noted, the associations of the prevalence of AF with the EATV seem convincing; however, several impor-tant issues remain unresolved. It is controversial whether there is a dose-response relationship of increasing EATV along the continuum of no AF, paroxysmal AF (PAF),
O
besity is an important risk factor for atrialfibril-lation (AF),1,2 and recent evidence suggests that
obesity-related diseases can be mediated more intensely by ectopic fat deposits than by entire-body adi-posity.3–5 Epidemiological and clinical studies have
demon-strated that epicardial fat, a local adipose tissue deposit surrounding the heart, which can be assessed using non-invasive imaging techniques, is consistently associated with the presence, severity, and recurrence of AF.6–8 Wong et al
compared the associations of the prevalence of AF with the epicardial adipose tissue (EAT) and measures of abdominal and overall adiposities in a meta-analysis of observational
Received January 10, 2018; revised manuscript received March 17, 2018; accepted March 27, 2018; released online May 25, 2018 Time for primary review: 13 days
Department of Cardiology, Tomishiro Central Hospital, Okinawan (K.O., M.M., S. Yamaguchi, O.A., M. Shimabukuro); Department of Cardiovascular Medicine (G.M., S. Yagi, Y.H., S.N., T.I., K.K., H.Y., T.S., T.W., M. Sata), Department of Cardio-Diabetes Medicine (D.F., M. Shimabukuro), Department of Diagnostic Radiology (S.T.), Department of Radiology (M.H.), Institute of Biomedical Sciences, Tokushima University Graduate School, Tokushima; Division of Endocrinology, Diabetes and Metabolism, Hematology, Rheumatology (Second Department of Internal Medicine), Graduate School of Medicine, University of the Ryukyus, Okinawa (H.M.); and Department of Diabetes, Endocrinology and Metabolism, School of Medicine, Fukushima Medical University, Fukushima (M. Shimabukuro), Japan
Mailing address: Michio Shimabukuro, MD, PhD, Department of Diabetes, Endocrinology and Metabolism, School of Medicine, Fukushima Medical University, 1 Hikarigaoka, Fukushima 960-1295, Japan. E-mail: [email protected] ISSN-1346-9843 All rights are reserved to the Japanese Circulation Society. For permissions, please e-mail: [email protected]
Effect of the Epicardial Adipose Tissue Volume on the
Prevalence of Paroxysmal and Persistent Atrial Fibrillation
Kageyuki Oba, MD; Minetaka Maeda, MD; Gulinu Maimaituxun, MD; Satoshi Yamaguchi, MD; Osamu Arasaki, MD; Daiju Fukuda, MD, PhD;
Shusuke Yagi, MD, PhD; Yukina Hirata, PhD; Susumu Nishio, PhD;
Takashi Iwase, MD, PhD; Shoichiro Takao, MD, PhD; Kenya Kusunose, MD, PhD; Hirotsugu Yamada, MD, PhD; Takeshi Soeki, MD, PhD; Tetsuzo Wakatsuki, MD, PhD;
Masafumi Harada, MD, PhD; Hiroaki Masuzaki, MD, PhD; Masataka Sata, MD, PhD; Michio Shimabukuro, MD, PhD
Background: Although increasing evidence suggests that epicardial adipose tissue volume (EATV) is associated with atrial fibrillation (AF), it is controversial whether there is a dose-response relationship of increasing EATV along the continuum of AF. We evaluated the effect of the EATV on the prevalence of paroxysmal AF (PAF) and persistent AF (PeAF) and the relationships with cardiac structure and functional remodeling.
Methods and Results: Subjects who underwent multidetector computed tomography (MDCT) coronary angiography because of symptoms suggestive of coronary artery disease were divided into sinus rhythm (SR) (n=112), PAF (n=133), and PeAF (n=71) groups. The EATV index (EATV/body surface area, mL/m2) was strongly associated with the prevalence of PAF and PeAF on the model adjusted for known AF risk factors. The effect of the EATV index on the prevalence of PeAF, but not on that of PAF, was modified by the left atrial (LA) dimension, suggesting that extension of the LA dimension is related to EATV expansion in PeAF. The cutoff value of the EATV index for the prevalence was higher in PeAF than in PAF (64 vs. 55 mL/m2, P<0.01).
Conclusions: The EATV index is associated with the prevalence of PAF and PeAF, and its cutoff values are predictive for PAF and PeAF development independently of other AF risk factors.
Key Words: Atrial fibrillation; Epicardial adipose tissue volume; Obesity
Methods
Study Populations
We recruited subjects who underwent multidetector com-puted tomography (MDCT) coronary angiography between October 2013 and April 2016 at the Tokushima University Hospital, Tokushima, Japan or at the Tomishiro Central Hospital, Okinawa, Japan. The subjects underwent MDCT if they had symptoms suggestive of angina pectoris or asymptomatic coronary artery disease (CAD) in a moder-ate-to-high CAD risk category.13 All participants provided
written informed consent after they were advised regarding the radiation exposure-related risk and possible complica-tions of iodine-containing contrast.13
The subjects were then divided into the following groups persistent AF (PeAF), and long-lasting persistent
(perma-nent) AF.9–11 Previous studies showed that the EATV was
associated with measures of the left ventricular (LV) struc-ture and diastolic dysfunction;12 however, the causality of
the EATV-associated LV structure and functional remod-eling on AF prevalence has not been clarified.4
In this study, we evaluated: (1) the effect of the EATV on the prevalence of PAF and PeAF and the relationships with LV structure and functional remodeling; and (2) the cutoff value for estimating the prevalence of PAF and PeAF using the receiver-operating characteristic (ROC) curve method.
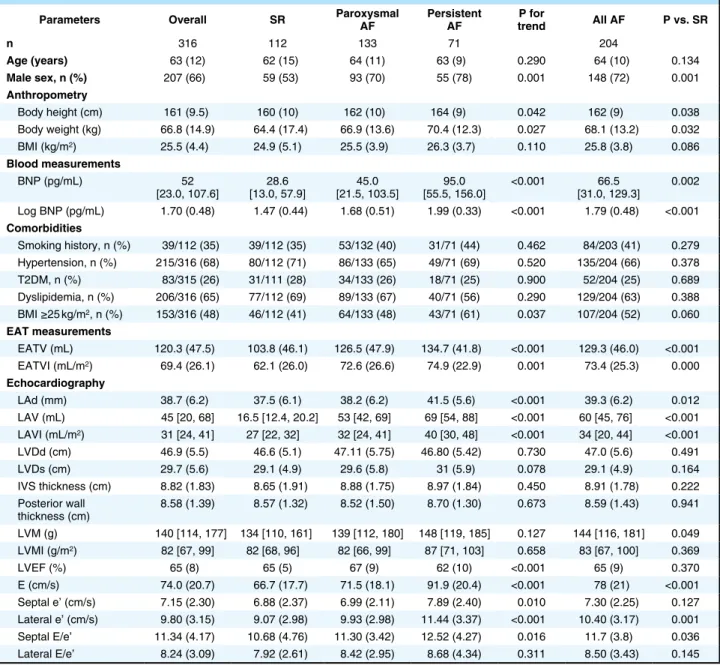
Table 1. General Characteristics of Patients
Parameters Overall SR Paroxysmal AF Persistent AF trendP for All AF P vs. SR
n 316 112 133 71 204 Age (years) 63 (12) 62 (15) 64 (11) 63 (9) 0.290 64 (10) 0.134 Male sex, n (%) 207 (66) 59 (53) 93 (70) 55 (78) 0.001 148 (72) 0.001 Anthropometry Body height (cm) 161 (9.5) 160 (10) 162 (10) 164 (9) 0.042 162 (9) 0.038 Body weight (kg) 66.8 (14.9) 64.4 (17.4) 66.9 (13.6) 70.4 (12.3) 0.027 68.1 (13.2) 0.032 BMI (kg/m2) 25.5 (4.4) 24.9 (5.1) 25.5 (3.9) 26.3 (3.7) 0.110 25.8 (3.8) 0.086 Blood measurements BNP (pg/mL) 52 [23.0, 107.6] [13.0, 57.9]28.6 [21.5, 103.5]45.0 [55.5, 156.0]95.0 <0.001 [31.0, 129.3]66.5 0.002 Log BNP (pg/mL) 1.70 (0.48) 1.47 (0.44) 1.68 (0.51) 1.99 (0.33) <0.001 1.79 (0.48) <0.001 Comorbidities Smoking history, n (%) 39/112 (35) 39/112 (35) 53/132 (40) 31/71 (44) 0.462 84/203 (41) 0.279 Hypertension, n (%) 215/316 (68) 80/112 (71) 86/133 (65) 49/71 (69) 0.520 135/204 (66) 0.378 T2DM, n (%) 83/315 (26) 31/111 (28) 34/133 (26) 18/71 (25) 0.900 52/204 (25) 0.689 Dyslipidemia, n (%) 206/316 (65) 77/112 (69) 89/133 (67) 40/71 (56) 0.290 129/204 (63) 0.388 BMI ≥25 kg/m2, n (%) 153/316 (48) 46/112 (41) 64/133 (48) 43/71 (61) 0.037 107/204 (52) 0.060 EAT measurements EATV (mL) 120.3 (47.5) 103.8 (46.1) 126.5 (47.9) 134.7 (41.8) <0.001 129.3 (46.0) <0.001 EATVI (mL/m2) 69.4 (26.1) 62.1 (26.0) 72.6 (26.6) 74.9 (22.9) 0.001 73.4 (25.3) 0.000 Echocardiography LAd (mm) 38.7 (6.2) 37.5 (6.1) 38.2 (6.2) 41.5 (5.6) <0.001 39.3 (6.2) 0.012 LAV (mL) 45 [20, 68] 16.5 [12.4, 20.2] 53 [42, 69] 69 [54, 88] <0.001 60 [45, 76] <0.001 LAVI (mL/m2) 31 [24, 41] 27 [22, 32] 32 [24, 41] 40 [30, 48] <0.001 34 [20, 44] <0.001 LVDd (cm) 46.9 (5.5) 46.6 (5.1) 47.11 (5.75) 46.80 (5.42) 0.730 47.0 (5.6) 0.491 LVDs (cm) 29.7 (5.6) 29.1 (4.9) 29.6 (5.8) 31 (5.9) 0.078 29.1 (4.9) 0.164 IVS thickness (cm) 8.82 (1.83) 8.65 (1.91) 8.88 (1.75) 8.97 (1.84) 0.450 8.91 (1.78) 0.222 Posterior wall thickness (cm) 8.58 (1.39) 8.57 (1.32) 8.52 (1.50) 8.70 (1.30) 0.673 8.59 (1.43) 0.941 LVM (g) 140 [114, 177] 134 [110, 161] 139 [112, 180] 148 [119, 185] 0.127 144 [116, 181] 0.049 LVMI (g/m2) 82 [67, 99] 82 [68, 96] 82 [66, 99] 87 [71, 103] 0.658 83 [67, 100] 0.369 LVEF (%) 65 (8) 65 (5) 67 (9) 62 (10) <0.001 65 (9) 0.370 E (cm/s) 74.0 (20.7) 66.7 (17.7) 71.5 (18.1) 91.9 (20.4) <0.001 78 (21) <0.001 Septal e’ (cm/s) 7.15 (2.30) 6.88 (2.37) 6.99 (2.11) 7.89 (2.40) 0.010 7.30 (2.25) 0.127 Lateral e’ (cm/s) 9.80 (3.15) 9.07 (2.98) 9.93 (2.98) 11.44 (3.37) <0.001 10.40 (3.17) 0.001 Septal E/e’ 11.34 (4.17) 10.68 (4.76) 11.30 (3.42) 12.52 (4.27) 0.016 11.7 (3.8) 0.036 Lateral E/e’ 8.24 (3.09) 7.92 (2.61) 8.42 (2.95) 8.68 (4.34) 0.311 8.50 (3.43) 0.145
Data are expressed as mean (SD), median [IQR] or n (%). P values calculated by one-way ANOVA. AF, atrial fibrillation; BMI, body mass index; BNP, B-type natriuretic peptide; BSA, body surface area; EATV, epicardial adipose tissue volume; EATVI, EATV index=EATV/BSA; EF, ejection fraction; IVS, interventricular septum; LAd, left atrial dimension; LAV, LA volume; LAVI, LAV index; LVDd and LVDs, LV diastolic and systolic dimensions; LVM, LV mass; LVMI, LVM index; LV, left ventricular; SR, sinus rhythm; T2DM, type 2 diabetes mellitus.
fasting plasma glucose level >126 mg/L, or current use of antidiabetic medication. Dyslipidemia was defined as either a serum level of low-density lipoprotein cholesterol ≥3.62 mmol/L (140 mg/L), serum level of triglyceride (TG) ≥150 mg/dL (1.69 mmol/L), and serum level of high-density lipoprotein cholesterol <40 mg/dL (1.04 mmol/L) and/or the current use of antilipidemic medication.
All data were collected retrospectively. The protocol of this study was approved by the institutional review boards of the University of Tokushima Hospital and the Tomishiro Central Hospital.
Biochemical Measurements
The blood samples were drawn, stored in ice-chilled tubes with and without ethylenediaminetetraacetic acid, and immediately centrifuged. All samples were frozen at −80°C until assayed by technicians blinded to all information regarding the participants. The HbA1c concentration was measured using high-performance liquid chromatography and B-type natriuretic peptide (BNP) by a chemilumines-cent enzyme immunoassay.
according to their medical history: sinus rhythm (SR), PAF, or PeAF. According to the ACCF/AHA/HRS guide-line,14 an episode of AF was defined as an event lasting
>30 s, PAF referred to patients with spontaneous termina-tion of the arrhythmia within 7 days of its onset, and PeAF was patients with arrhythmia sustained beyond 7 days. Subjects with permanent AF were excluded. To eliminate strong confounding effects of coronary atherosclerosis on the EAT, we excluded patients with CAD. Among patients who had undergone coronary CT angiography and/or invasive coronary angiography, those who had lost >50% of the luminal diameter in at least 1 major epicardial coro-nary artery or branch were excluded. The other exclusion criteria included: iodine-based contrast allergy, renal fail-ure (creatinine level >1.5 mg/mL), history of cardiomy-opathy, valvular or congenital heart disease, uncontrolled hypertension, malignancy, connective tissue disease, and any acute or chronic inflammatory disease. Hypertension was defined as a systolic blood pressure ≥140 mmHg and/ or diastolic blood pressure ≥90 mmHg or current use of antihypertensive medication. Diabetes mellitus was defined as a glycated hemoglobin (HbA1c) concentration ≥6.5%, a
Table 2. Simple Regression Analysis to Predict Paroxysmal or Persistent AF
Parameters Paroxysmal AF (n=133) Persistent AF (n=71) All AF (n=204)
Estimate 95% CI P value Estimate 95% CI P value Estimate 95% CI P value
Age (years) 0.020 0.000~0.040 0.140 0.010 −0.010~0.030 0.440 0.010 −0.010~0.030 0.130
Male sex (yes) 0.740 0.220~1.260 0.006 1.130 0.460~1.800 <0.001 0.860 0.380~1.340 <0.001
Anthropometry Body height (cm) 0.020 −0.010~0.050 0.190 0.040 0.010~0.070 0.014 0.030 0.010~0.050 0.039 BMI (kg/m2) 0.030 −0.030~0.090 0.290 0.060 −0.010~0.130 0.056 0.050 −0.010~0.110 0.089 Blood measurements BNP (pg/mL) 0.010 0.010~0.010 0.019 0.020 0.010~0.030 <0.001 0.010 0.000~0.020 <0.001 Log BNP (pg/mL) 0.410 0.140~0.680 0.003 1.480 0.970~1.990 <0.001 0.650 0.380~0.920 <0.001 Comorbidities Smoking history 0.230 −0.290~0.750 0.390 0.370 −0.240~0.980 0.230 0.280 −0.200~0.760 0.250 Hypertension (yes) −0.310 −0.850~0.230 0.260 −0.120 −0.770~0.530 0.730 −0.250 −0.750~0.250 0.340 T2DM (yes) −0.120 −0.690~0.450 0.680 −0.130 −0.810~0.550 0.700 −0.120 −0.640~0.400 0.640 Dyslipidemia (yes) −0.080 −0.620~0.460 0.760 −0.530 −1.150~0.090 0.090 −0.250 −0.740~0.240 0.330 BMI ≥25 kg/m2, n (%) 0.290 −0.220~0.800 0.270 0.790 0.180~1.400 0.011 0.460 −0.010~0.930 0.054 EAT measurements EATV (mL) 0.010 0.000~0.020 <0.001 0.020 0.010~0.030 <0.001 0.010 0.000~0.020 <0.001 EATVI (mL/m2) 0.020 0.010~0.030 0.003 0.020 0.010~0.030 0.001 0.020 0.010~0.030 <0.001 Echocardiography LAd (mm) 0.020 −0.020~0.060 0.380 0.110 0.050~0.170 <0.001 0.050 0.010~0.090 0.013 LAVI (mL/m2) −0.010 −0.070~0.050 0.640 0.060 −0.020~0.140 0.140 0.010 −0.050~0.070 0.750 LVDd (cm) 0.020 −0.030~0.070 0.430 0.010 −0.050~0.070 0.760 0.020 −0.020~0.060 0.490 IVS thickness (cm) 0.070 −0.070~0.210 0.330 0.090 −0.070~0.250 0.260 0.080 −0.050~0.210 0.220 LVMI (mL/m2) 0.000 −0.010~0.010 0.490 0.000 −0.010~0.010 0.440 0.000 −0.010~0.010 0.400 LVEF (%) 0.050 0.010~0.090 0.008 −0.040 −0.080~0.000 0.047 0.010 −0.020~0.040 0.370 Septal E/e’ 0.040 −0.020~0.100 0.240 0.090 0.020~0.160 0.013 0.060 0.000~0.120 0.038 Lateral E/e’ 0.070 −0.030~0.170 0.200 0.070 −0.040~0.180 0.200 0.060 −0.030~0.150 0.150
ment software of Vincent was used. In a semi-automated process, the pericardium counter was first manually traced in each transaxial slice, followed by an automated step of processing all continuous voxels with a density range of −190 to −30 Hounsfield units within the pericardial sac for the calculation of the EATV. The upper border of the EATV measurements represented the lower surface of the left pulmonary artery origin, and the lower border repre-sented the LV apex. The EAT area of each slice was then summed and multiplied by the slice thickness and number MDCT Scan Protocol and Analysis of the EATV
MDCT scanning was performed as previously described.15,16
Briefly, the coronary artery tree was segmented in accor-dance with the modified American Heart Association clas-sification;17 the coronary vessel and diameter were assessed
using 2D multiplanar reconstruction and 2D thin slab maximum intensity projection images. The patients were suspected to have CAD when they had a plaque resulting in >50% luminal narrowing in the major coronary arteries. For the measurement of the EATV, the volume
measure-Table 3. Multivariate Regression Analysis to Predict Paroxysmal, Persistent or All AF PAF
Model 1 Model 2 Model 3 Model 4 Model 5
Corrected R2 0.045 0.073 0.096 0.065 0.095
P value 0.003 0.006 0.001 0.002 0.000
Parameter Estimate P value Estimate P value Estimate P value Estimate P value Estimate P value
Age (years) 0.006 0.026 0.006 0.016 0.003 0.252 0.003 0.256 0.002 0.553
Male sex (yes) 0.205 0.002 0.205 0.002 0.199 0.002 0.199 0.002 0.198 0.002
BMI (kg/m2) 0.012 0.086 0.015 0.045 0.007 0.344 0.007 0.379 0.008 0.280 Smoking history (yes) 0.065 0.321 0.061 0.344 0.061 0.345 0.046 0.477 Hypertension (yes) −0.114 0.096 −0.126 0.064 −0.127 0.065 −0.126 0.060 T2DM (yes) −0.067 0.360 −0.077 0.292 −0.077 0.293 −0.079 0.274 EATVI (mL/m2) 0.003 0.015 0.003 0.017 0.003 0.010 LAd (mm) 0.000 0.934 LVEF (%) −0.012 0.005 PeAF
Model 1 Model 2 Model 3 Model 4 Model 5
Corrected R2 0.092 0.102 0.096 0.167 0.130
P value 0.000 0.000 0.001 <0.0001 <0.0001
Parameters Estimate P value Estimate P value Estimate P value Estimate P value Estimate P value
Age (years) 0.010 0.0655 0.012 0.037 0.003 0.252 0.003 0.631 0.005 0.487
Male sex (yes) 0.571 0.000 0.613 <0.0001 0.199 0.002 0.551 0.000 0.547 0.000
BMI (kg/m2) 0.042 0.007 0.045 0.004 0.007 0.344 0.013 0.445 0.029 0.088 Smoking history (yes) 0.276 0.056 0.061 0.344 0.247 0.077 0.234 0.101 Hypertension (yes) −0.159 0.309 −0.126 0.064 −0.074 0.626 −0.109 0.481 T2DM (yes) −0.071 0.658 −0.077 0.292 −0.126 0.416 −0.117 0.464 EATVI (mL/m2) 0.003 0.015 0.005 0.130 0.007 0.031 LAd (mm) 0.039 0.001 LVEF (%) −0.016 0.076 All AF
Model 1 Model 2 Model 3 Model 4 Model 5
Corrected R2 0.062 0.066 0.085 0.087 0.086
P value <0.0001 0.000 <0.0001 <0.0001 <0.0001
Parameters Estimate P value Estimate P value Estimate P value Estimate P value Estimate P value
Age (years) 0.006 0.009 0.007 0.004 0.004 0.150 0.003 0.185 0.003 0.192
Male sex (yes) 0.228 <0.0001 0.223 <0.0001 0.215 0.000 0.211 0.000 0.219 <0.0001
BMI (kg/m2) 0.014 0.019 0.017 0.008 0.010 0.142 0.007 0.306 0.011 0.120 Smoking history (yes) 0.064 0.236 0.058 0.280 0.062 0.248 0.056 0.295 Hypertension (yes) −0.088 0.127 −0.094 0.100 −0.097 0.089 −0.097 0.088 T2DM (yes) −0.066 0.283 −0.070 0.246 −0.072 0.238 −0.069 0.252 EATVI (mL/m2) 0.003 0.007 0.003 0.014 0.003 0.007 LAd (mm) 0.006 0.214 LVEF (%) −0.004 0.217
pattern was recorded from the apical 4-chamber view with the sample volume located at the lateral or septal side of the mitral annulus using pulsed tissue Doppler echocar-diography. The mean peak early diastolic mitral annular velocity (e’) in the septal and lateral sides was measured, and the ratio of E to e’ (E/e’) was then calculated as a marker of LV filling pressure. In addition to these diastolic parameters, routine echocardiographic parameters were also measured and included the left atrial dimension (LAd), LV end-diastolic dimension (LVDd) and LV end-systolic dimension (LVDs) measured from the M-mode or 2D echocardiogram of the LV. The LV ejection fraction (LVEF) was measured and calculated from the apical 2- and 4-chamber views using a modified Simpson’s method. LA volume, LV volume index (LAV/BSA), LV mass (LVM), and LVM index (LVMI:LVM/BSA) were calculated as reported previously.18,19 Relative wall thickness was
of slices to determine the total EATV. The EATV index (EATVI: mL/m2) was defined as EATV (mL)/body surface area (BSA, m2). In selected patients who had undergone cardiac CT at least twice at more than 1 year’s interval, we evaluated the longitudinal changes in the EATVI.
Echocardiographic Measurements
Echocardiography was performed in a standard manner using commercially available ultrasound diagnostic machines. The recordings and measurements were performed in accordance with the guidelines issued by the American Society of Echocardiography.18 Transmitral flow (TMF)
velocity was recorded from the apical long-axis or 4-chamber view. The ratio of the peak early diastolic (E) and the peak atrial systolic (A) TMF velocities was calculated, if applicable. The deceleration time of the early TMF velocity was also measured. The mitral annular motion velocity
Figure 1. Receiver-operating characteristic (ROC) curves for predicting the prevalence of paroxysmal atrial fibrillation (AF), per-sistent AF, and both types of AF (All AF) in all ages, <65 years old (yo) and ≥65 yo. The cutoff values on the basis of the epicardial adipose tissue volume index were calculated to obtain the maximal area under the curve (AUC). The cutoff value and its sensitiv-ity and 1-specificsensitiv-ity for detecting AF are shown. The subjects included the following groups: sinus rhythm (n=112), paroxysmal AF (n=133), and persistent AF (n=71).
LAd, and septal E/e’. The LVEF was associated positively with PAF and negatively with PeAF.
The multivariate analysis revealed that age, male sex, and BMI were associated with PAF and PeAF (Model 2). Even after adjusting for confounding factors, including male sex, BMI, smoking history, hypertension, and T2DM, the EATVI was strongly associated with PAF and PeAF (Model 3). When the LAd was included in the multivariate model, the EATVI was associated with PAF, but not with PeAF (model 4). When the LVEF was included, the EATVI was still associated with both PAF and PeAF (model 5).
In the ROC curve analysis for predicting the prevalence of PAF and PeAF based on the EATVI, the cutoff values for PAF and PeAF were 55 and 64 mL/m2, respectively, in all age subjects (Figure 1). When stratified by age <65 and ≥65 years (Figure 1, Tables S1–S3), the EATVI was sig-nificantly associated with PAF and PeAF in age <65 years, but not in ≥65 years (Table S3) and the area under the curve (AUC) for EATVI was larger in <65-year-old sub-jects for PAF, PeAF and both types of AF (Figure 1). calculated as twice the posterior wall thickness divided by
LVDd.18 All Doppler recordings were performed during an
end-expiratory breath hold. The mean values of 3 consecu-tive cardiac cycles were used in the analysis. Measurement and interpretation of the echocardiography were per-formed locally at each institution.
Statistical Analysis
Continuous variables with a normal distribution are expressed as mean ± standard deviation (SD) and those with an unequal variance as median and interquartile range (25–75th percentiles); categorical variables are expressed as numbers and frequencies. The group means for the con-tinuous variables with normal distributions and the group median for non-normal distributions were compared using one-way analysis of variance and Kruskal-Wallis test, respectively, among the 3 groups. The two-tailed unpaired Student’s t-test or Mann-Whitney U test was used for con-tinuous variables with a normal distribution or skewed distribution for the comparison of 2 groups. Categorical variables were compared using Fischer’s exact test. Univariate and multivariate regression models were used to identify the factors that had associations with the preva-lence of PAF and PeAF. Associated factors with a signifi-cance level of P<0.05 in the univariate analysis were entered into the multivariate model. The optimal cutoff values of the EATVI for the prediction of PAF and PeAF develop-ment were identified using the ROC curve. Prediction score models for detecting the prevalence of PAF, PeAF, and both were produced by employing rational covariates in the multiple logistic regression analysis.20 All statistical
analyses were performed using JMP 13.2.0 (SAS Institute Inc. Cary, NC, USA) or R application.
Results
General Characteristics of the Patients With SR, PAF, and PeAF (Table 1)
Among the subjects in this study, 112 had SR, 133 had PAF, and 71 had PeAF. The mean age of all subjects was 63±12 years, and 207 (66%) were men. The patient age was comparable among the SR, PAF, and PeAF groups, and the male sex was prevalent in the PAF and PeAF groups. The height and BMI were higher, and BMI ≥25 kg/m2 was prevalent in the PAF and PeAF groups. The BNP and log BNP levels were higher in the PAF and PeAF groups. The prevalence of smoking history, hypertension, type 2 diabe-tes mellitus (T2DM), and dyslipidemia was all comparable among the SR, PAF, and PeAF groups. The EATV and EATV index were higher in the PAF and PeAF groups. Regarding the echocardiographic parameters, the LAd and LAVI were larger, and the LVEF was lower in the PeAF group. The LVM was larger in the PAF and PeAF groups; however, the LVMI was comparable among the 3 groups. In the PAF and PeAF groups, the septal e’ was slightly larger; however, the E-wave was much taller, resulting in a higher septal E/e’.
Simple and Multivariate Regression Analyses for Predicting the Prevalence of PAF, PeAF, and Both (Tables 2,3)
The univariate analysis revealed that the risk factors asso-ciated with PAF and PeAF were male sex, BNP and log BNP levels, EATV, and EATVI. The risk factors associ-ated only with PeAF were body height, BMI ≥25 kg/m2,
Table 4. Prediction Score Model for Paroxysmal, Persistent or All AF Score Age (years) <20 3 21–30 5 31–40 6 41–50 8 51–60 9 61–70 11 71–80 12 81–90 14 91– 15 Sex Female 0 Male 10 BMI (kg/m2) <15 5 15≤BMI<20 6 20≤BMI<24 8 24≤BMI<28 9 >28 10 LAd (mm) <35 10 35≤LAd<40 11 40≤LAd<45 13 45≤LAd<50 14 >50 16 EATVI (mL/m2) <50 8 50≤EATVI<100 15 100≤EATVI<150 23 150≤EATVI<200 30 200≤EATVI<250 38 >250 45 Total 96 points Abbreviations as in Table 1.
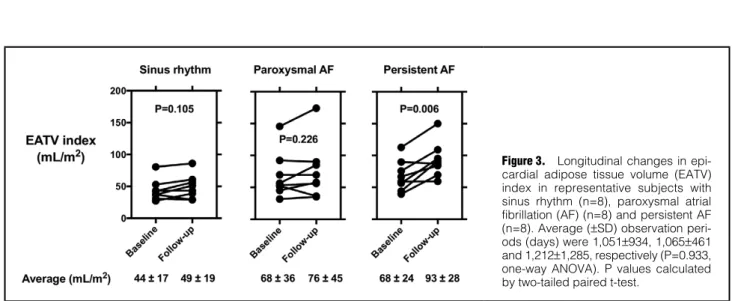
(days) was 1,051±934, 1,065±461 and 1,212±1,285, respec-tively (P=0.933, one-way ANOVA). P values were calcu-lated by two-tailed paired t-test. We found that the EATVI was almost comparable during a period of ~1,000 days in subjects with SR and PAF, but was significantly increased in subjects with PeAF during almost the same period. Baseline EATVI was comparable between PAF and PeAF (68 vs. 68 mL/m2), but the longitudinal change was larger in the PeAF group.
Discussion
In the current Japanese participants without CAD, we observed 3 major findings. First, the EATVI was strongly associated with the prevalence of PAF and PeAF in the model adjusted for known AF risk factors, such as age, male sex, BMI, smoking history, hypertension, and T2DM (Table 3, Model 3). Second, the effect of the EATVI on the prevalence of PeAF, but not on that of PAF, was modified by the LAd, suggesting that extension of the LAd is related Prediction Score Model for Detecting the Prevalence of
PAF, PeAF, and Both
We created a prediction score model for detecting the prevalence of PAF, PeAF, and both by using rational covariates in the multiple logistic regression analysis (Model 4, Table 3). For clinical utility of the prediction score, β-coefficients were multiplied 10 times and rounded to create integral numbers for categorical covariates. Finally, we adopted categorical covariates for age, sex, BMI, LAd and EATVI (Table 4). As shown in Figure 2, ROC curve analysis showed that the cutoff for total points of categorical covariates (prediction score) in PAF (51 points), PeAF (53 points), and both (53 points) correlated relatively well with the prevalence of AF.
Longitudinal Changes in EATVI in Subjects With SR, PAF and PeAF
Longitudinal changes in the EATVI in representative subjects with SR (n=8), PAF (n=8) and PeAF (n=8) are shown in Figure 3. Average (±SD) observation period
Figure 2. Receiver-operating characteristic (ROC) curves of predicting score models for the prevalence of paroxysmal atrial fibrillation (AF), persistent AF, and both types of AF (All AF). The area under the curve (AUC) of AF and the cutoff values (sensitiv-ity, 1-specificity) and P values are shown. The subjects included the following groups: sinus rhythm (n=112), paroxysmal AF (n=133), and persistent AF (n=71).
Figure 3. Longitudinal changes in epi-cardial adipose tissue volume (EATV) index in representative subjects with sinus rhythm (n=8), paroxysmal atrial fibrillation (AF) (n=8) and persistent AF (n=8). Average (±SD) observation peri-ods (days) were 1,051±934, 1,065±461 and 1,212±1,285, respectively (P=0.933, one-way ANOVA). P values calculated by two-tailed paired t-test.
adopted the EATVI as a measure of the EATV. By using the ROC curve for predicting the prevalence of PAF and PeAF based on the EATVI, the cutoff values for PAF and PeAF were 55 and 64 mL/m2, respectively (Figure 1). Chao et al reported that at a cutoff value of 6 mm for PAF and 6.9 mm for non-PAF, the EAT thickness measured on transthoracic echocardiography could help identify patients at risk of recurrence after AF ablations.32 To our
knowledge, no report has evaluated the cutoff value of the EATV for predicting the development of AF.33 Shmilovich
et al evaluated the threshold for the upper normal limit of the EATVI measured on non-contrast cardiac CT; the 95th-percentile definition of the upper normal limit of the EATVI was 68 mL/m2 (equivalent to EATV of 125 mL), and this value can be an independent predictor (OR, 2.8; 95% confidence interval, 1.3–6.4, P=0.012) of major adverse cardiovascular events (MACEs) consisting of cardiovascu-lar death, myocardial infarction, stroke, and percutaneous or surgical coronary artery revascularization.34 Interestingly,
the cutoff values of the EATVI in the study by Shmilovich et al34 for MACEs and in the current study for PAF and
PeAF are comparable. Future prospective studies are war-ranted to evaluate the prognostic value of these cutoff values for the onset of new AF under common conditions.
We produced a prediction score model for detecting the prevalence of PAF, PeAF, and both by using rational covariates. AUCs for detecting PAF, PeAF, and both were larger in this model (Figure 2) than with only the EATVI (Figure 1). Because the cutoff for the prediction score cor-related relatively well with the prevalence of AF, it may be reasonable to test the utility of this prediction score in other study populations. Of importance, the baseline EATVI was comparable between PAF and PeAF, but the longitudinal change was larger in PeAF, suggesting that an increase in the EATVI is at least partly a consequence of PeAF existence. Therefore, the cause-and-effect relationship between any type of AF and EATV should be considered in future studies.
Study Limitations
First, the cross-sectional design of this study limits inter-pretations of causality. Second, the predominantly Japanese patient sample also limits the generalizability of our find-ings to other ethnicities. Third, we did not measure the waist circumference or waist-to-hip ratio; these measures may have added incremental information on the effects of local vs. systemic adiposity. Fourth, AF frequently devel-ops in elderly populations, who are typically lean. Our study subjects were relatively young and obese and this may bias the study results. To minimize a biased interpre-tation, we stratified subjects to age <65 and ≥65 years and reanalyzed the relationship between the EATVI and AF; it was somewhat weaker in our elderly group, suggesting that the effect of the EATVI may be larger in relatively young populations. Finally, because of the relatively small sub-group sizes, the number of variables adjusted for in the binary logistic regression models was limited to avoid over-fitting the models.
Conclusions
In the present Japanese participants without CAD, the EATVI was strongly associated with the prevalence of PAF and PeAF in the model adjusted for known AF risk factors. The effect of the EATVI on the prevalence of PAF, to the EATV expansion in PeAF. Third, the cutoff value
of the EATVI for the prevalence of PeAF and PAF was higher in the former than in the latter (64 vs. 55 mL/m2, P<0.01). As such, it suggested that the EATVI is associated with the prevalence of PAF and PeAF, and its cutoff values predict PAF and PeAF development independently of other AF risk factors.
EATV and the Prevalence of PAF and PeAF
The EAT is structurally located next to the myocardium and the coronary arteries and can play a beneficial role in the non-obese state by serving as a local TG storage in metabolic stress and by releasing protective adipocyto-kines, supporting normal cardiovascular homeostasis.3,21,22
However, the EAT can accumulate in the setting of meta-bolic derangement, such as obesity and T2DM, promoting vascular and myocardial dysfunction. The accumulation of the EAT is associated strongly with visceral fat adiposity, and it is thought that hypertrophied and dysfunctional EAT promotes cardiovascular injuries, such as CAD.3,23,24
Recent studies support that EAT accumulation is also more closely associated with the presence and severity of AF than measures of abdominal and overall adiposity.6–8
Several studies have reported that the EATV is higher in patients with PeAF than in those with PAF.9–11 Won et al
demonstrated that the EATV increased stepwise according to the presence and severity of AF (no AF, PAF, PeAF, and permanent AF), suggesting a dose-response relation-ship of increasing epicardial fat along the continuum of AF. Similarly, the current study showed that both the EATV and EATVI increased stepwise by SR<PAF<PeAF and that the EATVI was associated with the prevalence of PAF and PeAF (Model 3) after adjusting for confounding AF factors, including male sex, BMI, smoking history, hypertension, and T2DM. By contrast, when the LAd was included in the multivariate model, the EATVI was not associated with PeAF, but with PAF.
Increased epicardial fat is associated with various car-diac structural changes that could affect the propensity for AF development.6,8 Increased EATV is reported to be
associated with increased LAd independent of other AF risk factors.25 Infiltration of the EAT to the atrium may
lead to electromechanical changes in the atrial tissue caused by local inflammation and resulting fibrosis, pro-moting the development of AF.26 This suggests that the
EAT may alter atrial conduction, promoting atrial electri-cal remodeling and thus favoring the development of AF.6,27
Al Chekakie et al reported that LA dilatation (LAd >42 mm), as well as the EATV, was an independent risk factor of PeAF, but not of PAF.9 Inclusion of LA
dilata-tion in the multivariate model might abolish the effect of the EATVI, because the LAd is associated more closely with PeAF than with PAF.12,28 Septal E/e’ was associated
with PeAF, but not with PAF. LV diastolic dysfunction could be induced by expansion of the EATV;28–30 this could
coexist with LA burden and LA dilatation12 more severely
in PeAF.
Cutoff Value of the EATVI for Predicting the Prevalence of PAF and PeAF
Since we previously reported that compared with the EATV, the EATVI was a suitable marker for predicting a candidate for coronary bypass surgery,15,31 and significant
Cardiol 2014; 176: 841 – 846.
12. Fox CS, Gona P, Hoffmann U, Porter SA, Salton CJ, Massaro JM, et al. Pericardial fat, intrathoracic fat, and measures of left ventricular structure and function: The Framingham Heart Study. Circulation 2009; 119: 1586 – 1591.
13. Taylor AJ, Cerqueira M, Hodgson JM, Mark D, Min J, O’Gara P, et al. ACCF/SCCT/ACR/AHA/ASE/ASNC/NASCI/SCAI/ SCMR 2010 appropriate use criteria for cardiac computed tomography. A report of the American College of Cardiology Foundation Appropriate Use Criteria Task Force, the Society of Cardiovascular Computed Tomography, the American College of Radiology, the American Heart Association, the American Society of Echocardiography, the American Society of Nuclear Cardiology, the North American Society for Cardiovascular Imaging, the Society for Cardiovascular Angiography and Interventions, and the Society for Cardiovascular Magnetic Resonance. J Am Coll Cardiol 2010; 56: 1864 – 1894.
14. Wann LS, Curtis AB, January CT, Ellenbogen KA, Lowe JE, Estes NA 3rd, et al. 2011 ACCF/AHA/HRS focused update on the management of patients with atrial fibrillation (Updating the 2006 Guideline): A report of the American College of Cardiology Foundation/American Heart Association Task Force on Practice Guidelines. J Am Coll Cardiol 2011; 57: 223 – 242.
15. Shimabukuro M, Hirata Y, Tabata M, Dagvasumberel M, Sato H, Kurobe H, et al. Epicardial adipose tissue volume and adipo-cytokine imbalance are strongly linked to human coronary ath-erosclerosis. Arterioscler Thromb Vasc Biol 2013; 33: 1077 – 1084. 16. Dagvasumberel M, Shimabukuro M, Nishiuchi T, Ueno J,
Takao S, Fukuda D, et al. Gender disparities in the association between epicardial adipose tissue volume and coronary athero-sclerosis: A 3-dimensional cardiac computed tomography imag-ing study in Japanese subjects. Cardiovasc Diabetol 2012; 11: 106. 17. Gensini GG. A more meaningful scoring system for determining
the severity of coronary heart disease. Am J Cardiol 1983; 51: 606.
18. Lang RM, Bierig M, Devereux RB, Flachskampf FA, Foster E, Pellikka PA, et al. Recommendations for chamber quantifica-tion: A report from the American Society of Echocardiography’s Guidelines and Standards Committee and the Chamber Quantification Writing Group, developed in conjunction with the European Association of Echocardiography, a branch of the European Society of Cardiology. J Am Soc Echocardiogr 2005; 18: 1440 – 1463.
19. Devereux RB, Alonso DR, Lutas EM, Gottlieb GJ, Campo E, Sachs I, et al. Echocardiographic assessment of left ventricular hypertrophy: Comparison to necropsy findings. Am J Cardiol 1986; 57: 450 – 458.
20. Ruopp MD, Perkins NJ, Whitcomb BW, Schisterman EF. Youden Index and optimal cut-point estimated from observa-tions affected by a lower limit of detection. Biomed J 2008; 50: 419 – 430.
21. Zhou YT, Grayburn P, Karim A, Shimabukuro M, Higa M, Baetens D, et al. Lipotoxic heart disease in obese rats: Implications for human obesity. Proc Natl Acad Sci USA 2000; 97: 1784 – 1789.
22. Fitzgibbons TP, Czech MP. Epicardial and perivascular adipose tissues and their influence on cardiovascular disease: Basic mech-anisms and clinical associations. J Am Heart Assoc 2014; 3: e000582.
23. Lee HY, Despres JP, Koh KK. Perivascular adipose tissue in the pathogenesis of cardiovascular disease. Atherosclerosis 2013; 230: 177 – 184.
24. González N, Moreno-Villegas Z, González-Bris A, Egido J, Lorenzo Ó. Regulation of visceral and epicardial adipose tissue for preventing cardiovascular injuries associated to obesity and diabetes. Cardiovasc Diabetol 2017; 16: 44.
25. Thanassoulis G, Massaro JM, O’Donnell CJ, Hoffmann U, Levy D, Ellinor PT, et al. Pericardial fat is associated with prevalent atrial fibrillation: The Framingham Heart Study. Circ Arrhythm
Electrophysiol 2010; 3: 345 – 350.
26. Shirani J, Berezowski K, Roberts WC. Quantitative measurement of normal and excessive (cor adiposum) subepicardial adipose tissue, its clinical significance, and its effect on electrocardio-graphic QRS voltage. Am J Cardiol 1995; 76: 414 – 418. 27. Friedman DJ, Wang N, Meigs JB, Hoffmann U, Massaro JM,
Fox CS, et al. Pericardial fat is associated with atrial conduction: The Framingham Heart Study. J Am Heart Assoc 2014; 3: e000477.
28. Evin M, Broadhouse KM, Callaghan FM, McGrath RT, Glastras S, Kozor R, et al. Impact of obesity and epicardial fat but not on that of PeAF, was modified by the LAd,
indi-cating that extension of the LAd is related to EATV expan-sion in PAF. It is suggested that the EATVI is associated with the prevalence of PAF and PeAF, and its cutoff val-ues predict PAF and PeAF development independently of other AF risk factors.
Acknowledgments
We are deeply grateful to Mr. Hiroyuki Okumura, Department of Radiology, Tomishiro Central Hospital, for devoted assists in MDCT measurements and to the staff in Echo Center at the Tomishiro Central Hospital and Tokushima University Hospital.
Declarations
Ethics Approval and Consent to Participate: The protocol of this study was approved by the institutional review boards of the Tomishiro Central Hospital and University of Tokushima Hospital.
Consent for Publication: Not applicable
Competing Interests: The authors declare that they have no compet-ing interests.
Funding: This work was supported by: Japan Society for the Promotion of Science KAKENHI Grants (Number 16H05299 and 26248050), Takeda Science Foundation, the Fugaku Trust for Medical Research and the Vehicle Racing Commemorative Foundation (M. Sata): Japan Society for the Promotion of Science KAKENHI Grants (Number 16K01823 to M. Shimabukuro).
Authors’ Contributions: K.O., M.M. and M. Shimabukuro designed the research, analyzed the data, and wrote the manuscript; M.M. and G.M. measured the epicardial adipose tissue volume; S. Yamaguchi and M. Shimabukuro provided statistical analysis; K.O., M.M., O.A., D.F. and S. Yagi provided patient management and collected the samples; Y.H., S.N., K.K. and H.Y. postulated echocardiographic measurements; T.I., S.T. and M.H. contributed to MDCT measure-ments; T.S., T.W., H.M. and M. Sata supervised the study; all authors discussed the data and reviewed the manuscript.
References
1. Wang TJ, Parise H, Levy D, D’Agostino RB Sr, Wolf PA, Vasan RS, et al. Obesity and the risk of new-onset atrial fibrillation.
JAMA 2004; 292: 2471 – 2477.
2. Lavie CJ, Pandey A, Lau DH, Alpert MA, Sanders P. Obesity and Atrial fibrillation prevalence, pathogenesis, and prognosis: Effects of weight loss and exercise. J Am Coll Cardiol 2017; 70: 2022 – 2035.
3. Shimabukuro M. Cardiac adiposity and global cardiometabolic risk: New concept and clinical implication. Circ J 2009; 73: 27 – 34. 4. Iacobellis G. Local and systemic effects of the multifaceted epi-cardial adipose tissue depot. Nat Rev Endocrinol 2015; 11: 363 – 371.
5. Chistiakov DA, Grechko AV, Myasoedova VA, Melnichenko AA, Orekhov AN. Impact of the cardiovascular system-associated adipose tissue on atherosclerotic pathology. Atherosclerosis 2017; 263: 361 – 368.
6. Al-Rawahi M, Proietti R, Thanassoulis G. Pericardial fat and atrial fibrillation: Epidemiology, mechanisms and interventions.
Int J Cardiol 2015; 195: 98 – 103.
7. Wong CX, Sun MT, Odutayo A, Emdin CA, Mahajan R, Lau DH, et al. Associations of epicardial, abdominal, and overall adiposity with atrial fibrillation. Circ Arrhythm Electrophysiol 2016; 9: e004378.
8. Wong CX, Ganesan AN, Selvanayagam JB. Epicardial fat and atrial fibrillation: Current evidence, potential mechanisms, clinical implications, and future directions. Eur Heart J 2017; 38: 1294 – 1302.
9. Al Chekakie MO, Welles CC, Metoyer R, Ibrahim A, Shapira AR, Cytron J, et al. Pericardial fat is independently associated with human atrial fibrillation. J Am Coll Cardiol 2010; 56: 784 – 788.
10. Wong CX, Abed HS, Molaee P, Nelson AJ, Brooks AG, Sharma G, et al. Pericardial fat is associated with atrial fibrillation sever-ity and ablation outcome. J Am Coll Cardiol 2011; 57: 1745 – 1751.
11. Kim TH, Park J, Park JK, Uhm JS, Joung B, Lee MH, et al. Pericardial fat volume is associated with clinical recurrence after catheter ablation for persistent atrial fibrillation, but not parox-ysmal atrial fibrillation: An analysis of over 600 patients. Int J
review of the literature. Eur Radiol 2015; 25: 3372 – 3381. 34. Shmilovich H, Dey D, Cheng VY, Rajani R, Nakazato R, Otaki
Y, et al. Threshold for the upper normal limit of indexed epicar-dial fat volume: Derivation in a healthy population and valida-tion in an outcome-based study. Am J Cardiol 2011; 108: 1680 – 1685.
Supplementary Files Supplementary File 1
Table S1. General characteristics of patients either with age <65 or age ≥65 years
Table S2. Simple regression analysis to predict paroxysmal or persistent AF
Table S3. Multivariate regression analysis to predict paroxysmal, persistent or all AF
Please find supplementary file(s); http://dx.doi.org/10.1253/circj.CJ-18-0021 on early left atrial dysfunction assessed by cardiac MRI strain
analysis. Cardiovasc Diabetol 2016; 15: 164.
29. Park HE, Choi SY, Kim M. Association of epicardial fat with left ventricular diastolic function in subjects with metabolic syn-drome: Assessment using 2-dimensional echocardiography.
BMC Cardiovasc Disord 2014; 14: 3.
30. Chu CY, Lee WH, Hsu PC, Lee MK, Lee HH, Chiu CA, et al. Association of increased epicardial adipose tissue thickness with adverse cardiovascular outcomes in patients with atrial fibrilla-tion. Medicine (Baltimore) 2016; 95: e2874.
31. Maimaituxun G, Shimabukuro M, Salim HM, Tabata M, Yuji D, Morimoto Y, et al. Gender-linked impact of epicardial adi-pose tissue volume in patients who underwent coronary artery bypass graft surgery or non-coronary valve surgery. PLoS One 2017; 12: e0177170.
32. Chao TF, Hung CL, Tsao HM, Lin YJ, Yun CH, Lai YH, et al. Epicardial adipose tissue thickness and ablation outcome of atrial fibrillation. PLoS One 2013; 8: e74926.
33. Spearman JV, Renker M, Schoepf UJ, Krazinski AW, Herbert TL, De Cecco CN, et al. Prognostic value of epicardial fat vol-ume measurements by computed tomography: A systematic