Litter
Size of Apodemus
argenteus
in Relation
to the
Population
Cycle
Kelsuke
NAKATA
Hokkaido Forest Experiment Station
Bibai, Hokkaido 079-01, Japan
(Accepted May 8, 1986)
ABSTRACT. - Litter size of the small Japanese field mouse, Apodemus argenteus,
was examined in relation to its population fluctuation in a natural mixed forest of
Hokkaido. Overwintered females had a slightly higher litter size than did current
year's females, although the difference was not significant. There was a significant positive relationship between litter size and body size ; the correlation coefficient
obtained for current year's females was higher than that for overwintered females.
There was a significant negative relationship between litter size and population
density ; a higher correlation was detected for overwintered mice than for current year's mice. Pregnant females were captured only in the increase phase, except for a few in the decline phase in May of 1979. Litter size significantly varied from year to year. Higher litter sizes were closely associated with the autumn breeding, a prolon-gation of the breeding season related to the population cycle.
Introduction
Changes in litter size of small rodents
are possibly influenced by a complex
interaction
of environmental,
genetic, and maternal factors (cf. KREBS,1964 ; KELLER
&
KREBS,1970 ; KREBS & MYERS, 1974). In spite of many studies on natural populations
of Apodemus argenteus
(e. g., KINOSHITA & MAEDA, 1961; FUJIMAKI, 1969; YUKAWA,
1973, NISHIKATA,1979), little information
is available concerning relationships
between
litter size and such interrelated
variables.
In the research of population dynamics of small rodents, several authors
discount-ed the role of litter size in explaining the density change (e. g., KREBS & MYERS, 1974),
while the others considered it to be a driving force to produce oscillations in numbers
(e. g., HAMILTON, 1937; NAKATA, 1984).
In the studies of A. argenteus
and other
Apodemus species, there have been few discussions on the possible role of litter size in
their population fluctuations
(or cycles).
The purpose of this study is (1) to evaluate the factors affecting litter size in a
natural population
of A. argenteus, and (2) to discuss the importance
of changes in
litter size in relation to population cycle.
Materials
and Methods
The study was conducted in a natural mixed forest at Mizuho (43•K 42' N, 142•K 39'
area of 140 ha, consists of coniferous and broad-leaved deciduous trees and belongs to the pan-mixed forest which is characterized by a mixture of the subarctic and temper-ate tree species (TATEWAKI, 1958). The dominant tree species are Abies sachalinensis,
Picea yezoensis, Cercidyphyllum japonicum, Tilia japonica and Acer mono. The ground
was covered with a dense Sasa senanensis, with scattered Cacalia hastata var. orientalis,
Pachysandra terminalis and Osumunda asiatica.
One grid, at an elevation of about 460 m, was established for conducting capture-mark-release studies of small rodents. The grid had 100 trap stations set 10 m apart in a 10 x 10 pattern. Within 1 m of each station, two Sherman type live-traps were placed. As exceptions, a 5 x 6 pattern was arranged in June 1975 ; 7 •~ 6 pattern in
August and October 1975 ; 5 x 10 pattern in May and September 1976. Rodents were
sampled for three successive days in each during the snow-free seasons from May 1975
to October 1979. The survey conducted in 1975 was preliminary and samplings were
made in June, August and October of this year. The live-traps were baited with oats, and cotton was supplied in early spring and late autumn. The traps were checked once a day. Rodents were toe-clipped for identification. In addition to A. argenteus, the
following mammals were captured in the grid : Clethrionomys rufocanus bedfordiae, C.
rutilus mikado, C. rex, A. speciosus ainu, Tamias sibiricus, Sorex unguiculatus, S.
caecutiens seavus, S. gracillimus, Mustela nivalis and M. sibirica itatsi.
Assuming that marked individuals were removed, estimated number of each
species was calculated by applying the method of ZIPPIN (1956). The effective trapping
area was estimated from the method of DICE (1938). Mean observed range length
(STICKEL, 1954) was calculated among mice captured three times during the three
successive trapping days. The population density per hectare was determined by
dividing the estimated number by the effective trapping area. In August and Septem-ber 1977, the number of mice captured on the third day of trapping was larger than that on the first day. In these cases, ZIPPIN's method was not applied : estimated number was calculated by means of multiplying the actual number captured by the mean ratio
(estimated number/actual number captured).
Mice for autopsy were captured in trap lines located 250•`500 m apart from the
live-trapping grid. The vegetation along the traplines was almost the same as that in the grid. The line-trappings were carried out on the same schedule as in the grid, with some additional ones operated in several months of the snow season. The fluctuation of the number of mice per trap-night was similar to that in the grid. A small number of mice killed by accidents in the grid was also used for autopsy. The following data were recorded : body weight, total length, tail length, embryos, placental scars and
some measurements of the uterus. Skulls were removed for aging. The morphology,
development and wear of the third upper molar (M3) were used as indices of age
(FUJIMAKI, 1966).
Litter size was counted by embryos : resorting embryos were excluded from the
data. The number of placental scars was not used in this study.
Reproductive females were separated into females of the current year and
over-wintered females. Females were considered primiparous if there were embryos but no
Results
Population dynamics
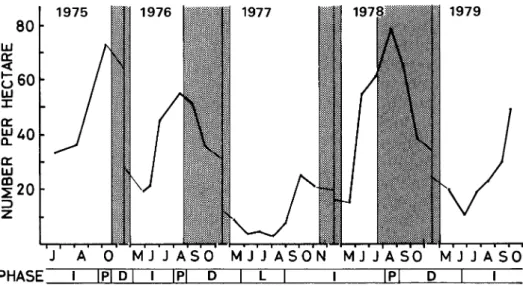
Figure 1 shows the change of density in A, argenteus during five years.
The
population
fluctuated
at a two-year
cycle in the sense of KRESS & MYERS (1974),
excluding the census of 1975. In 1976 and 1978, the population showed a peak density
in summer.
Such a peak density in summer in high density years has been often found
(FUJIMAKI,
1969). In these years, the breeding ceased early in July or August. In 1975,
1977 and 1979, the populations
were low in summer, then increased toward autumn :
these breeding periods extended from spring to autumn (until November, particularly
in 1977). The decline phase in the spring of 1979 rapidly turned into the increase phase
without entering the low phase.
The highest density recorded in this study was 78.5
individuals per hectare in August of 1978, and the lowest one was 2.8 individuals per
hectare in August of 1977. Population
dynamics will be discussed in detail elsewhere
(NAKATA, in prep.).
The process of population
changes was arbitrarily
divided into four phases (Fig.
1). Although it was difficult to determine
precisely, the phase of low numbers was
assigned to a period of density below 8 individuals per hectare.
The increase phase was
defined as a period of rapid increase in numbers, the peak phase to one month at the
peak because the mouse number rapidly decreased
just after attainment
of peak
number, and the decline phase as a period of decrease in numbers.
All the decline
phases recorded in this study were of the type M (CHITTY, 1955).
Fig. 1. Fluctuations in population density of A. argenteus and divisions of phase. L, low phase ; I, increase phase ; P, peak phase ; D, decline phase. Shaded part shows non-breeding season defined as a period of less than 20 % maturation rate in both sexes (NAKATA, in prep.). Densities of 1975 were considered to be overestimated because the small trapping grid was placed in an area with a rather high density of mice.
Age, parity and litter size
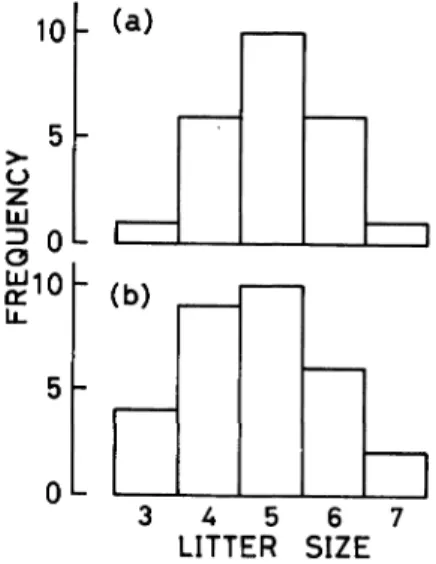
The modal of litter size was 5 with a range of 3-7 in this study (Fig. 2). The overwintered females had a slightly higher litter size than the current year's females although not significantly (t = 0.80, df = 53, P>0.4): the mean litter size •} SE was 5.00•}0.19 (sample size, 24) in the former, and 4.77•}2.0 (31) in the latter.
Figure 3 shows the relationship
between litter size and the age of female at pregnancy. A one-way analysis of variance
revealed no significant age variation in
litter size (F=0.34, df = 3.51, P>0.5).
Table 1 shows the mean litter sizes in
primiparous and multiparous females. No
significant difference between these two
groups was found for both the current
year's mice (t = 0.02, P>0.5) and the over-wintered mice (t = 0.24, P>0.5). Thus, litter size was not influenced by parity.
Body size and litter size
A linear correlation analysis showed that there was a significant correlation
between body size (length of head and
body) and litter size for the current year's females (r=0.574, df = 28, P<0.01) (Fig. 4).
For the overwintered females, on the
contrary, body size hardly explained the
change of litter size (r = 0.243, df = 20, P > 0.2). In overall samples, a significant positive relationship was also obtained (r = 0.461, df = 50, P<0.01).
Fig. 2. Frequency distribution of litter size based on counts of embryos. a, overwintered females ; b, current year's females.
Fig. 3. Age variation in litter size (mean •} SE). Age class : II, 1-2 months old ; III, 2•`4 months old ; IV, 4.10 months old ;
V,10-18 months old. Number at the top of rec-tangle indicates sample size.
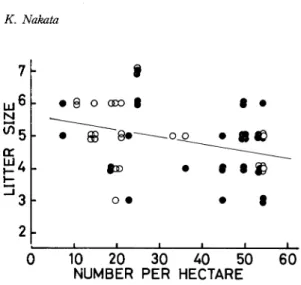
Population density and litter size
The relationships
between density (X) and litter size (Y) were expressed
:
In the overwintered
females,
Y=5.689-0.024X
(r= -0.429, df = 22, P<0.05)
In the current year's females,
Y=5.525-0.019X
(r= -0.256, df =29, P>0.1)
Thus negative correlation coefficients were detected in both the overwintered
and
current year's mice, although the coefficient in the latter was not significant. In overall
samples, there was also a negative relationship
with significant level (r= -0.340, df =
53, P < 0.05)(Fig. 5).
Table 1. Parity variation in litter size (mean •} SE).
N, sample size.
Most of the multiparous females had one set of scars plus embryos.
Fig. 4. Relationship between litter size and body size. Solid circle, current year's female ; open circle, overwintered female.
Population phase and litter size
Since no pregnant female was captured in the low and the peak phases (NAKATA,
in prep.), comparison of litter size among phases was capable only between the
increase phase and the decline phase. Litter size in the increase phase (mean •} SE, 4.90±0.14 ; sample size, 52) was higher than that in the decline phase in May of 1979 (4.33 •} 0.88; 3), although not significant (t = 0.93, df = 53, P >0.2). Pregnant females were thus captured only in the increase phase, except for the three overwintered females in the decline phase.
Season, year and litter size
Figure 6 shows a significant seasonal variation in litter size in overall samples (F= 2.37, df = 6, 48, P<0.05): mean litter size in autumn (September-October) was higher than that in spring (May-June), and a depression in litter size was found in summer
(July-August). In these the data of spring were derived from the samples of 1975
(sample size, 1), 1976 (3), 1978 (19) and 1979 (5) ; and those of summer from 1975 (2), 1976 (4) and 1979 (5) ; and those of autumn from 1977 (7) and 1979 (8). Thus the seasonal
variation was closely related to the yearly variation in litter size shown as follows.
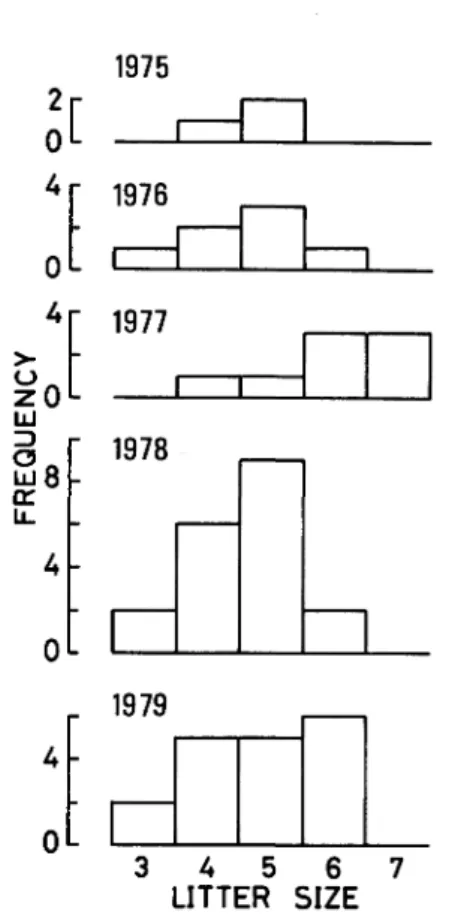
Litter size clearly varied
among years at a significance level (F = 3.46, df = 4, 50, P<0.05) (Fig. 7). Yearly mean litter sizes
+ SE were as follows : 4.67•}0.33 (sample size, 3) in 1975, 4.57•}0.37 (7) in 1976, 6.00•}0.38 (8) in 1977, 4.58•}0.19 (19) in 1978, and 4.83•} 0.25 (18) in 1979, respectively. The litter size was thus higher in
years when breeding periods
ex-tended to October or November re-sulting in increase of number in
au-tumn, and lower in years when
breeding ceased in July or August with a peak of number in summer.
Fig. 5. Relationship between litter size and population density. Solid circle, current year's female ; open circle, over-wintered female.
Discussion
Litter size of A. argenteus did not vary significantly with age of pregnant females,
nor with parity.
Furthermore,
there was a slight and insignificant difference in litter
size between the current year's females and the overwintered
females.
But FUJIMAKI
(1969) reported
a rather
clear difference
in litter size between the current
year's
females
(a mean of 3.2 embryos)
and the overwintered
ones (a mean of 4.1) at
Moiwayama
in Sapporo, Hokkaido ; the difference in litter size between two groups of
females was larger at Moiwayama
than at the present study area. This result seems
to be explained by the difference
of breeding period : at Moiwayama,
the breeding
ceased early by August or September
(discussed later).
Although SUZUKI (1972) found no correlation
between litter size and body size for
A. argenteus in Tohoku district, the litter size in the present survery tended to increase
with the increase of body size at a significance level. A similar correlation
has been
obtained
for A. agrarius (PELIKAN, 1965). Since the correlation
coefficient of the
overwintered
females was small and insignificant
(r = 0.243), the relationship
becomes
obscure when the majority
of pregnant
females in the population
are overwintered
mice.
There was a negative relationship between population density and litter size. This
fact is interpreted
as a mechanism of regulating
the number of newborns. However,
litter size in the current year's females was weakly correlated with density in contrast
to the overwintered
females. A similar result was obtained for C. rufocanus (NAKATA,
1984). Thus the litter size of the current year's females was not critically controlled
by population
density, which was rather associated with the drastic susceptibility
of
young females to inhibition of reproductive
maturation
(e. g., KREBS & MYERS, 1974;
NAKATA, in prep.).
In C. rufocanus, litter size of the
current year's females was related to
population phase at the time when they
were born and undergoing growth
(NAKATA, 1984). This finding is possi-bly applied to the case of A. argenteus.
However, this kind of analysis could not be made in this species because the
method of age determination was not
so accurate as in the vole. Seasonal variation in litter size was found to be significant (Fig. 6). Since litter size did not vary greatly with age, changes in
age composition of pregnant females
hardly explained the seasonal changes of litter size. This result differed from the usual explanation for microtine
rodents (INNES, 1978; NAKATA, 1984;
etc.).
Litter size varied from year to
year. Higher litter sizes were closely associated with the autumn breeding, a
prolongation of the breeding season
related to the population cycle. Then
most of the current year's females
became pregnant and the population
rapidly increased. The current year's
females were thus shown to make an
important contribution to the popula-tion growth in such years as having the
autumn breeding. The higher litter
sizes were related partly to larger
body sizes of females born in the
cur-rent year, because the pregnant
females of the current year were
slightly larger in mean body size in
autumn during the increase phase
(mean •} SD mm, 85.18•}1.11; sample
size, 14) than in spring (82.75•}1.10, 8) (t =1.44 ; P>0.1). Since the effects of
individual and population factors
dis-cussed above did not appear to be
enough to account for the higher litter size observed in this study,
environ-Fig. 6. Seasonal variation in litter size (mean •} SE). Number at the top of rectangle indicates sample size. Shaded part of rectangle shows current year's females in sample. Sample in November represents one overwintered female.
Fig. 7. Yearly variation in frequency distribution of litter size.
mental factors (e. g., temperature
regime) and other population
factors
(e. g., phase
and/or density at the time when the females were born and undergoing growth:
see
NAKATA, 1984) may be further important.
Why was apparent
yearly variation
in litter size detected
in A. argenteus, in
contrast to the cases of microtine rodents (e. g., KREBS & MYERS, 1974; NAKATA,
1984) ?
The reasons were probably that the samples of the whole year were (1) almost derived
from one phase, viz., the increase phase, and (2) free from the variation related to age
of females.
Acknowledgements
I wish to thank
Drs. H. ABE, and Y. SAITO in Hokkaido
University,
and K. KAMIJO
in our Station
for reading
the manuscript
and offering
many
helpful
comments.
References
CHITTLY, D. 1955. Adverse effects of population density upon the viability of later generation. In •g The Number of Man and Animals.•h ed. by J. B. CRAGG & N. W. PIRIE. Edinburgh. p. 57-67
(cited from KREBS & MYERS, 1974).
DICE, L. R. 1938. Some census methods for mammals. J. Wildl. Manage., 2: 119-130.
FUJIMAKI, Y. 1966. Age variations in the external characters of Apodemus argenteus. Mem. Fac. Agric. Hokkaido Univ., 5: 212-217 (in Japanese with English summary).
FUJIMAKI, Y. 1969. Reproductive activity of Apodemus argenteus TEMMINICK. J. Mamm. Soc. Japan, 4: 74-80 (in Japanese with English summary).
HAMILTON, W. J. Jr. 1937. The biology of microtine cycles. J. Agric. Res., 54: 779-790.
INNES, D. G. 1978. A reexamination of litter size in some North American microtines. Can. J. Zool., 56: 1488-1496.
KELLER, B. L. & C. J. KREBS. 1970. Microtus population biology ; III. Reproductive changes in fluctuating populations of M. ochrogaster and M. pennsylvanicus in southern Indiana, 1965-67. Ecol. Monogr., 40: 263-294.
KINOSHITA, E. & M. MAEDA. 1961. Field experiments on the biology of field mice in the woodland. Bull. Gov. For. Exp. Sta., 127: 61-98 (in Japanese with English summary).
KREBS, C. J. 1964. The lemming cycle at Baker Lake, Northwest Territories, during 1959-62. Arctic Inst. N. Amer. Tech. Paper, (15): 1-104.
KREBS, C. J. & J. H. MYERS. 1974. Population cycles in small mammals. Adv. Ecol. Res., 8: 267-399. NAKATA, K. 1984. Factors affecting litter size in the red-backed vole, Clethrionomys rufocanus
bedfordiae, with special emphasis on population phase. Res. Popl. Ecol., 26: 221-234.
NISHIKATA, S. 1979. Ecological studies on the population of Apodemus argenteus argenteus in Mt. Kiyosumi, Chiba Pref. I. A life cycle and fluctuations of population size. J. Mamm. Soc. Japan, 7: 240-253 (in Japanese with English abstract).
PELIKAN, J. 1965. Reproduction, population structure and elimination of males in Apodeums agrarius (PALL.). Zool. Listy, 14: 317-332.
STICKEL, L. F. 1954. A comparison of certain methods of measuring ranges of small mammals. J. Mamm., 35: 1-15.
SUZUKI, M. 1972. Ecology and Reproduction of small rodents in the Gomyojin Experiment Forest of Iwate University. Bull. Iwate Univ. For., 4: 83-108 (in Japanese).
TATEWAKI, M. 1958. Forest ecology of the islands of the north Pacific Ocean. J. Fac. Agri. Hokkaido Univ., 50: 371-486.
YUKAWA, M. 1973. Reproduction in the Japanese long-tailed field mouse (Apodemus argenteus argenteus TEMMINCK) in Hiroshima-Pref. Misc. Rep. Hiwa Mus. Nat. His., 16: 1-16 (in