Polyethylene Glycols for the Dispersion Development of Graphene in an Aqueous Surfactant Solution Studied by Affinity Capillary Electrophoresis
7
0
0
全文
(2) 308 the graphene.12 Fractions of the eluate after CE separation of graphene oxide were collected for Raman spectroscopy and atomic force microscopy.13 It was found that stacked graphene oxide migrated toward the anode, while the thin-layer graphene oxide sheet migrated toward the cathode.13 When less charged graphene was examined by CE, an anionic surfactant of sodium dodecylbenzenesulfonate (SDBS) was found to be useful to disperse the graphene in an aqueous solution.14 It was shown through electropherograms that the graphene was less aggregated in an aqueous surfactant solution with a single broad peak and few shot signals.14 Several approaches have been proposed to disperse carbon-based nanomaterials in an aqueous solution. Anionic surfactant of sodium dodecylbenzenesulfonate,15 anionic tripheneyele,16 and photo-reactive dispersant17 were examined to disperse CNT in an aqueous solution. Combinations of an anionic surfactant of SDS and nonionic polymers were Conjugated also investigated for dispersing the CNT.18 polyelectrolyte was developed for the dispersion of graphene in an aqueous solution.19 Polyaromatic anions of small molecule were utilized to exfoliate and solubilize graphene sheets from natural graphite.20 Polyvinylpyrrolidone (PVP) was found to stabilize graphene solubilization in an aqueous solution.21–23 The PVP-stabilized graphene was used as a separation modifier of tanshiones by micellar electrokinetic chromatography (MEKC).23 In this way, CE analysis is useful to examine the dispersion of carbon-based nanomaterials in an aqueous solution through the number of the shot signal of the graphene aggregates. In this study, the present authors aimed to develop the dispersion of graphene in an aqueous solution with water soluble nonionic polymers, in addition to the anionic surfactant of SDBS. The water soluble polymers examined were polyethylene glycol (PEG), poly(vinyl alcohol) (PVA), and PVP with their different molecular masses. The number of shot signals corresponding to the graphene aggregates was reduced with the nonionic polymers. Changes in the effective electrophoretic mobility of graphene was also examined to evaluate the effective charge of the dispersed graphene on the basis of the affinity interaction in the separation buffer. The effective electrophoretic mobility of graphene decreased with increasing concentrations of the nonionic polymer, and the results suggested that anionic DBS– was competitively substituted with the nonionic polymer.. Experimental Reagents and chemicals Graphene Nanoplatelets was purchased from XG Sciences (xGnP, grade C, 750 m2 g–1, Lansing, MI, USA). It was used by dissolving/dispersing in the separation buffer containing sodium tetraborate (borax) and SDBS under ultrasonic radiation. The separation buffer components of borax and SDBS were from Kanto Chemical (Tokyo, Japan). Polyethylene glycols (average molecular masses of 1000, 4000, 6000 and 20000) were from Kishida Chemical (Osaka, Japan). Polyethylene glycol (average molecular mass of 10000) and poly(vinyl alcohol) (average molecular mass of 10000, 80% hydrolyzed) were from SigmaAldrich Japan (Tokyo, Japan). Polyvinylpyrrolidones (average molecular masses of 3500, 8000 and 24500) were from Acros Organics (NJ, USA), Alfa Aesar (MA, USA), and Nacalai Tesque (Kyoto, Japan), respectively. Other reagents used were of analytical grade. Water used was purified by Milli-Q Gradient A10 (Merck Millipore Japan, Tokyo, Japan) throughout.. ANALYTICAL SCIENCES MARCH 2019, VOL. 35 Apparatus An Agilent Technologies 3DCE (Agilent Technologies, Waldbronn, Germany) was used as a CE system equipped with a photodiode array detector. A fused-silica capillary was purchased from GL Sciences (Tokyo, Japan), and it was attached to the CE system after being cut to the required length. The dimensions of the capillary were 375 μm o.d., 50 μm i.d., 64.5 cm in total length, and 56 cm in the effective length from the injection end to the detection point. A photometric detection window was made to the capillary by burning a small portion of the polyimide coating. The capillary was held in a cassette cartridge and the cartridge was set in the CE system. The capillary was flushed daily with 0.1 mol dm–3 NaOH for 2 min and with purified water for 2 min to refresh the inner wall of the capillary. An Elma-Hans Schmidbauer Transsonic T310 was used for ultrasonic radiation (35 kHz, 45 W, Singen, Germany). A TOA DKK (Tokyo, Japan) pH meter, HM-25G, was used for pH measurements with a combined glass electrode. The pH meter was calibrated daily with standard pH solutions and used. Procedure An aliquot of 0.02 g of the graphene was dissolved in a 20 mmol dm–3 SDBS solution in a 10-mL volumetric flask; the concentration of graphene was thus 2 mg/mL. Ethanol was added to the graphene solution at an amount of 1% (v/v) to monitor the electroosmotic flow (EOF). The solution was ultrasonicated for 5 min, and then the solution was stood for 12 h. A small portion of the graphene solution was filled in a sample vial, and the vial was used for the CE measurements. Separation buffers of the CE were prepared with 5 mmol dm–3 borax (pH 9.2) and 20 mmol dm–3 SDBS. An adequate amount of a water-soluble nonionic polymer was added to the separation buffer as an affinity reagent. The separation buffer thus prepared was filled in both a cathodic and an anodic reservoir vials, and the vials were set in a vial tray of the CE system. After flushing the capillary with a separation buffer for 2 min, the graphene solution was introduced into the capillary from its anodic end by applying a pressure of 50 mbar for 5 s. Each end of the capillary was dipped in the cathodic and anodic buffer vials, and a DC voltage of 20 kV was applied to the capillary for CE separation. An analyte of graphene was photometrically detected at 420 nm to obtain a sufficiently high CE peak of graphene and stable baseline, although the baseline was somewhat noisy. Photometric detection at 200 nm was also made to monitor the electroosmotic flow with the ethanol. The capillary cassette was a thermostat at 25° C by circulating temperature-controlled air. Electropherograms were recorded and analyzed by a ChemStation software (Agilent Technologies, Ver. B04.02).. Results and Discussion Development of dispersion of graphene in the surfactant solution with polyethylene glycol We have reported that SDBS is effective for the dispersion of graphene in an aqueous surfactant solution.14 By adding SDBS in the separation buffer, shot signals of the graphene aggregates were suppressed, and the dispersed graphenes in an aqueous solution were detected as a broad peak on the basis of the wide Shot signals were variety of the graphene structure.14 simultaneously detected in the electropherograms with lessreproducible, and the shot signals were attributed to the aggregated graphenes.14 In CE separation, the graphene.
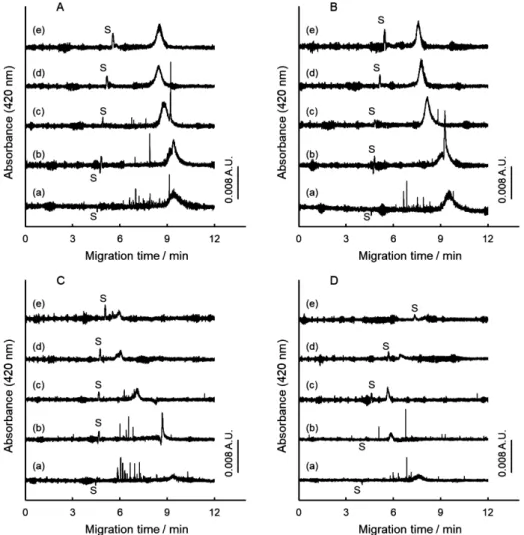
(3) ANALYTICAL SCIENCES MARCH 2019, VOL. 35. 309. Fig. 1 Electropherograms of Graphene Nanoplatelets with varying concentrations of PEG. Average molecular mass of PEG: A, 1000; B, 4000; C, 6000; D, 10000; E, 20000. Concentration of the graphene in the sample solution, 2 mg/mL. Separation buffer: 5 mmol dm–3 borax + 20 mmol dm–3 SDBS + PEG. Concentration of PEG in the separation buffer (% (w/v)): (a), 0.0; (b), 1.0; (c), 2.0; (d), 4.0; and (e), 6.0. CE conditions: 250 mbar·s sample injection, 20 kV separation voltage, 420 nm detection wavelength, and 25° C capillary temperature. S: Solvent (EOF).. electrophoretically migrated toward the anode in the presence of SDBS, and electrophoretic separation was also made between graphene and graphene oxide.14 In this study, some water-soluble nonionic polymers have been examined to develop the dispersion of graphene in an aqueous surfactant solution. Electropherograms of Graphene Nanoplatelets are shown in Fig. 1, when the PEG has been. added in the separation buffer. Five kinds of PEGs were examined with respect to the average molecular-mass ranging from 1000 to 20000. It is noted from the electropherograms (a) that some shot signals are still detected in the presence of SDBS. Therefore, it is difficult to disperse graphene homogeneously in the surfactant solution only with SDBS. The problems on the shot signals are: they are not reproducible on the number,.
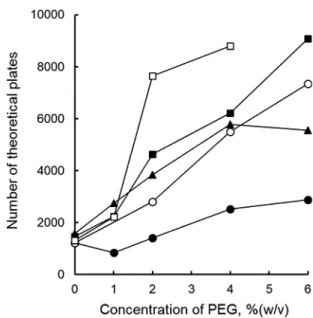
(4) 310. ANALYTICAL SCIENCES MARCH 2019, VOL. 35. the migration time, and the signal height. Thus, the shot signals would be suppressed. It would be necessary to establish the quantitative evaluation of the shot signals, alternative to the direct presentation of the electropherograms. Concerning the repeatability of the broad peak in the electropherograms of five (a), the peak height or the peak area were not reproducible, while its migration time agreed well with each other. Less reproducibility of the peak height of the broad peak comes from the dispersed amount of graphene. Therefore, the shot signals should be suppressed to obtain a reproducible broad peak. When the PEG was added in the separation buffer, the number of shot signals was well reduced, as is noted from the electropherograms in Fig. 1, especially (d) and (e). The results suggest that the dispersion of graphene is developed with the PEG. The signal shape of the broad peak, representing the dispersed graphenes, is preferable typically in B (e) and C (d) from the view point of the peak height to be high and the peak width to be narrow. Signal shape of the broad peak will be discussed in the latter section. Changes in the effective electrophoretic mobility of graphene with polyethylene glycol It is also noted from the electropherograms in Fig. 1 that the migration time of the broad peak is changed by the addition of PEG; the migration time of the broad peak got closer to the migration time of the electroosmotic flow (EOF). The result is similar to the CE separation of CNT with SDS and nonionic polymer.18 In Fig. 1A, the migration time of graphene became longer upon the addition of the PEG 1000; all details will be discussed on the basis of the effective electrophoretic mobility as in the following paragraphs. Although a surfactant of SDBS was used as a retention modifier of the non-charged graphenes, electrophoretic migration would not be the partition to the anionic micelle. Thus, an effective electrophoretic mobility of the dispersed graphenes, the broad peak, was used to examine the migration behavior of the graphene quantitatively. The effective electrophoretic mobility of the dispersed graphene, μeff, was calculated in an ordinary manner, as follows: ⎞ ⎛ µ eff = L D × L T ⎜ 1 − 1 ⎟ , ⎝ t G t EOF ⎠ V. Fig. 2 Changes in the effective electrophoretic mobility of graphene with increasing concentrations of PEG. The CE conditions are the same as in Fig. 1. Symbols: ●, PEG 1000; ○, PEG 4000; ▲, PEG 6000; ■, PEG 10000; □, PEG 20000.. (1). where LD, LT, V, tG, and tEOF are the effective length of the capillary from the injection point to the detection point (cm), the total length of the capillary (cm), the applied voltage (V), the migration time of the broad peak (s), and the migration time of the EOF (s), respectively. Changes in the μeff value are shown in Fig. 2. Since the graphene and PEG are not of fixed molecular size or molecular weight, as well as the wide variety of the existence forms of the solutes, the μeff value is just the averaged one calculated from the peak top of the broad peak. The μeff value decreased with increasing concentrations of the PEG in the separation buffer. This result suggested that the apparent anionic charge of graphene decreased by the addition of the PEG. The change in the μeff value is based on the affinity interactions in the separation buffer between graphene and DBS–, as well as between graphene and PEG, while the graphene migrating in the separation buffer. Since the anionic charge on the graphene is introduced with DBS–, the decrease in the μeff value suggests that the net charge of the dispersed graphene is decreased by the addition of PEG in the separation buffer. By the migration of the graphene from the sample solution zone to the separation buffer zone, the DBS– adsorbed on the graphene would be substituted with the PEG molecule competitively.. Fig. 3 Changes in the number of theoretical plates of the broad peak of graphene. The CE conditions are the same as in Fig. 1. Symbols: ●, PEG 1000; ○, PEG 4000; ▲, PEG 6000; ■, PEG 10000; □, PEG 20000.. In other words, an equilibrium between graphene and DBS– in the sample zone changed to another equilibrium among graphene, DBS– and PEG in the separation buffer. The degree of the decrease in the μeff value is more significant with highmolecular-mass PEG; such a large PEG would have interacted with graphene more strongly at many interaction points, and it substituted DBS– effectively. The variation of the changes in the electrophoretic mobility also suggests that the dispersion equilibrium in the sample solution quickly shifts to another dispersion equilibrium in the separation buffer solution; affinity with PEG is involved to change the effective electrophoretic mobility of graphene..
(5) ANALYTICAL SCIENCES MARCH 2019, VOL. 35 Water-soluble polymers may increase the viscosity of the separation buffer and, as a result, the electrophoretic mobility may be affected. However, the migration time or the mobility of the EOF is less affected by the PEG, and therefore the decrease in the effective electrophoretic mobility would be attributed to the decrease in the anionic charge by the substitution of the anionic DBS– with nonionic PEG. Changes in the number of theoretical plate with polyethylene glycol It is also noted from the electropherograms in Fig. 1 that the signal shape of the broad peak became sharper upon the addition of the PEG in the separation buffer. The peak shape is popularly evaluated through the number of theoretical plates. Since the graphenes are not of uniform shape or size, band broadening is not only the diffusion in the separation buffer, but the continuity of the graphene forms. Thus, the number of theoretical plates calculated from the signal shape is an apparent one. Changes in the number of theoretical plates are shown in Fig. 3. The number of theoretical plates increased with increasing concentrations of PEGs. Although the increase in the number of theoretical plates was also observed on CNT with nonionic polymers,18 the effect of nonionic PEG on sharpening the CE. 311 signal is still difficult to understand. From the view point of the signal shape, the peak height of the broad peak became smaller with high-molecular-mass PEGs, and the average molecular mass of 4000 or 6000 is favorable. Comparison of water-soluble nonionic polymers Nonionic polymers of PVP and PVA were also examined to develop the dispersion of graphene. The electropherograms are shown in Fig. 4. When PVA was added in the separation buffer, buffer components of 5 mmol dm–3 N-cyclohexyl-2-aminoethanesulfonic acid (CHES) + 2 mmol dm–3 NaOH (pH 9.2) were used instead of the borate buffer to prevent the gel formation. The shot signals of the graphene aggregates were also reduced with PVP and PVA. The broad peak was also developed with PVP 3500 and PVP 8000, although it was difficult to recognize the broad peak with PVP 24500 and PVA 10000. It has been reported that PVP (MW = 10000) is useful for the solubilization of graphene in an aqueous solution.21,22 This study also verified the dispersion of graphene with PVP even in the presence of the SDBS surfactant. The dispersion of graphene with PEG is found to be as effective as PVP from the comparison of the electropherograms in Figs. 1B, 1C, and 4B. Changes in the electrophoretic mobility of the broad peak. Fig. 4 Electropherograms of Graphene Nanoplatelets with varying concentrations of PVP or PVA. Average molecular mass of the polymer: A, PVP 3500; B, PVP 8000; C, PVP 24500; D, PVA 10000. Concentration of the graphene in the sample solution, 2 mg/mL. Separation buffer: A – C, 5 mmol dm–3 borax + 20 mmol dm–3 SDBS + PVP; D, 5 mmol dm–3 CHES + 2 mmmol dm–3 NaOH + 20 mmol dm–3 SDBS + PVA. Concentration of PVP or PVA in the separation buffer (% (w/v)): (a), 0.0; (b), 1.0; (c), 2.0; (d), 4.0; and (e), 6.0. The CE conditions are the same as in Fig. 1. S: Solvent (EOF)..
(6) 312. ANALYTICAL SCIENCES MARCH 2019, VOL. 35. Fig. 5 Changes in the effective electrophoretic mobility of graphene with increasing concentrations of nonionic polymer. The CE conditions are the same as in Fig. 1. Symbols: ●, PVA 10000; ▲, PEG 10000; ■, PVP 8000.. Fig. 6 Changes in the number of theoretical plates of the broad peak of graphene. The CE conditions are the same as in Fig. 1. Symbols: ●, PVA 10000; ▲, PEG 10000; ■, PVP 8000.. were similarly examined with PVP and PVA. The average molecular mass of around 10000 was adopted for a comparison. The result is shown in Fig. 5. The degree of the decrease in μeff was of the order of PVP 8000 < PEG 10000 < PVA 10000. The decrease in μeff corresponded to the competitive substitution of DBS–. Nonionic polymers of PVP and PEG would moderately substitute the DBS–, and the solvation/dispersion of graphene would be developed synergistically. The number of the theoretical plates on the broad peak was also compared among three kinds of the nonionic polymers with their average molecular mass of around 10000. The result is shown in Fig. 6. The broad peak was not so much sharpened by the addition of PVP or PVA, as in the case of PEG. Since the peak broadening of the dispersed graphene is introduced by the wide variety of its shape and size, the sharpening of the broad peak would be introduced by the relatively tight variation of the effective shape and size of the polymer-surrounded graphenes.. Acknowledgements. Conclusions In this study, the addition of water-soluble nonionic polymers was examined to develop the dispersion of the graphene in the SDBS surfactant solution. Polyethylene glycol was found to be effective for the dispersion of graphene in an aqueous surfactant solution, as well as PVP previously reported. Shot signals coresponding to the graphene aggregates were suppressed with PEG, and only a broad peak corresponding to a series of the dispersed graphene was detected in the electropherograms. Therefore, DBS– and PEG synergistically worked on the dispersion of graphene in an aqueous surfactant solution. On the other hand, the effective electrophoretic mobility of the broad peak decreased with increasing concentrations of the PEG, which suggested the competitive substitition of DBS– on the graphene. Polyethylene glycol was also found to sharpen the broad peak with an increased number of the theoretical plates.. This study was supported by JSPS KAKENHI Grant No. 17K05903.. References 1. K. Scida, P. W. Stege, G. Haby, G. A. Messina, and C. D. García, Anal. Chim. Acta, 2011, 691, 6. 2. J. Pauwels and A. Van Schepdael, Cent. Eur. J. Chem., 2012, 10, 785. 3. M. Á. González-Curbelo, D. A. Varela-Martínez, B. SocasRodríguez, and J. Hernández-Borges, Electrophoresis, 2017, 38, 2431. 4. S. Benítez-Martínez, B. M. Simonet, and M. Valcárcel, Electrophoresis, 2013, 34, 2561. 5. N. Ye, J. Li, Y. Xie, and C. Liu, Electrophoresis, 2013, 34, 841. 6. Z. Liu, Y. Du, and Z. Feng, Microchim. Acta, 2017, 184, 583. 7. S. K. Doorn, R. E. Fields, H. Hu, M. A. Hamon, R. C. Haddon, J. P. Selegue, and V. Majidi, J. Am. Chem. Soc., 2002, 124, 3169. 8. S. K. Doorn, M. S. Strano, M. J. O’Connell, E. H. Haroz, K. L. Rialon, R. H. Hauge, and R. E. Smalley, J. Phys. Chem. B, 2003, 107, 6063. 9. M. López-Pastor, A. Domínguez-Vidal, M. J. Ayora-Cañada, B. M. Simonet, B. Lendl, and M. Valcárcel, Anal. Chem., 2008, 80, 2672. 10. B. Suárez, B. M. Simonet, S. Cárdenas, and M. Valcárcel, J. Chromatogr. A, 2006, 1128, 282. 11. T. Yamamoto, Y. Murakami, J. Motoyanagi, T. Fukushima, S. Maruyama, and M. Kato, Anal. Chem., 2009, 81, 7336. 12. M. B. Müller, J. P. Quirino, P. N. Nesterenko, P. R. Haddad, S. Gambhir, D. Li, and G. G. Wallace, J. Chromatogr. A, 2010, 1217, 7593. 13. J. Zhao, G. Chen, W. Zhang, P. Li, L. Wang, Q. Yue,.
(7) ANALYTICAL SCIENCES MARCH 2019, VOL. 35. 14. 15. 16. 17. 18.. H. Wang, R. Dong, X. Yan, and J. Liu, Anal. Chem., 2011, 83, 9100. T. Takayanagi, M. Morimoto, and T. Yabutani, Anal. Sci., 2013, 29, 769. O. Matarredona, H. Rhoads, Z. Li, J. H. Harwell, L. Balzano, and D. E. Resasco, J. Phys. Chem. B, 2003, 107, 13357. T. Yamamoto, S. Murayama, and M. Kato, J. Sep. Sci., 2011, 34, 2866. Y. Matsuzawa, Y. Takada, T. Kodaira, H. Kihara, H. Kataura, and M. Yoshida, J. Phys. Chem. C, 2014, 118, 5013. T. Takayanagi, K. Ikeuchi, and H. Mizuguchi,. 313 Chromatography, 2017, 38, 101. 19. H. Yang, Q. Zhang, C. Shan, F. Li, D. Han, and L. Niu, Langmuir, 2010, 26, 6708. 20. A. Viinikanoja, J. Kauppila, P. Damlin, E. Mäkilä, J. Leiro, T. Ääritalo, and J. Lukkari, Carbon, 2014, 68, 195. 21. A. B. Bourlinos, V. Georgakilas, R. Zboril, T. A. Steriotis, A. K. Stubos, and C. Trapalis, Solid State Commun., 2009, 149, 2172. 22. A. S. Wajid, S. Das, F. Irin, H. S. Tanvir Ahmed, J. L. Shelburne, D. Parviz, R. J. Fullerton, A. F. Jankowski, R. C. Hedden, and M. J. Green, Carbon, 2012, 50, 526. 23. H. Yang, Y. Ding, W. Gao, L.-W. Qi, J. Cao, and P. Li, Electrophoresis, 2015, 36, 2874..
(8)
図

関連したドキュメント
We use these to show that a segmentation approach to the EIT inverse problem has a unique solution in a suitable space using a fixed point
In this case, the extension from a local solution u to a solution in an arbitrary interval [0, T ] is carried out by keeping control of the norm ku(T )k sN with the use of
A new method is suggested for obtaining the exact and numerical solutions of the initial-boundary value problem for a nonlinear parabolic type equation in the domain with the
Xiang; The regularity criterion of the weak solution to the 3D viscous Boussinesq equations in Besov spaces, Math.. Zheng; Regularity criteria of the 3D Boussinesq equations in
Next, we prove bounds for the dimensions of p-adic MLV-spaces in Section 3, assuming results in Section 4, and make a conjecture about a special element in the motivic Galois group
Transirico, “Second order elliptic equations in weighted Sobolev spaces on unbounded domains,” Rendiconti della Accademia Nazionale delle Scienze detta dei XL.. Memorie di
Then it follows immediately from a suitable version of “Hensel’s Lemma” [cf., e.g., the argument of [4], Lemma 2.1] that S may be obtained, as the notation suggests, as the m A
A Darboux type problem for a model hyperbolic equation of the third order with multiple characteristics is considered in the case of two independent variables.. In the class
