Original Article
Remote Sensing and GIS Based Approach for estimating
Land Use/Land Cover Change:
Case Study of Forêt Classée de la Mondah
(Gabon)
Mariano MBOUMBA
*, Ichio ASANUMA
**, Jonggeol PARK
**,
Keitarou HARA
**and Mizuki TOMITA
**Abstract: The Land Use/Land Cover (LUCL) changes in Forêt Classée de la Mondah (FCM) in Gabon was studied to account for changes occurred in the past as a categorical and numerical changes and to explain their main driving causes. For this purpose, the LULC changes were analyzed using post-classification comparison technique, following to the maximum likelihood supervised classification, between two multi-temporal Landsat images of ETM+ and OLI, which were acquired on April 7th 2000 and April 6th 2014, respectively. Results highlighted irreversible human-induced changes, where the rapid growth of built-up areas exhibited 20 times from its initial area, because of the anthropogenic pressure of surrounding population. In addition, major changes occurred mainly in forested area with the loss of 9.77% of its initial area. During the classification process, the use of collateral data, such as GPS coordinates and high resolution images retrieved from ground survey and Google Earth, were extremely relevant to enhancement of sample selection of ROSs and for the validation of classification map as well. However, this study provided relevant findings which could be used as a reference for decision makers while developing conservation policies in order to generate sustainable LULC management practices.
Keywords: LULC, Post classification comparison, Maximum likelihood, Remote sensing, GIS
リモートセンシングとGISによる土地利用・土地被覆の変化の推定について
―ガボン国デ・ラ・モンダ保護林の場合 ―
マリアノ
ムボンバ
*・浅
沼
市
男
**・朴
鍾
杰
**・原
慶
太
郎
**・富
田
瑞
樹
**要旨:Forêt Classée de la Mondah(FCM)ラ・モンダ保護林の土地利用・土地被覆(LULC)の変 化について、定性的及び定量的に説明し、主な変動因子を求めた。このため、2000年4月7日に ETM+、及び、2014年4月6日に OLI による2時期の観測データについて、最尤法により分類後 にLULC の変化を求めた。この結果、周辺地域の人口増加にともない宅地面積が20倍に急増し、不 可逆的な人為的変化が見いだされた。これに加え、森林地域の面積が9.77%減少した。現地調査に おけるGPS により特定した位置情報、Google Earth による高解像度データをサンプル領域の抽出あ るいは分類結果の検証に利用した。LULC の持続的な管理を可能とするための保全政策を検討する 段階で、政策立案者に対して、参照データとなる関連情報を見出すことができた。 キーワード:土地利用土地被覆,分類比較,最尤法,リモートセンシング,地理情報システム *
Graduate School of Informatics, Tokyo University of Information Sciences Received: 7 May 2018
東京情報大学 大学院総合情報学研究科 Accepted: 7 August 2018
**
Faculty of Informatics, Tokyo University of Information Sciences 東京情報大学 総合情報学部
accessible online, a LULC change study is proposed using remote sensing and GIS. A satellite remote sensing approach has the advantage to provide an economical and much more convenient tools and advanced techniques for exploring land cover dynamic, namely in remote areas compared to traditional approach based solely on field surveys or aerial photography[6][7].
Successful applications of remote sensing and GIS for monitoring LULC change been reported[8][9][10], using satellite images including Landsat images[11], and with LULC change detection study as the second most common application[12]. Although there is no unique solution for all LULC change studies, the latter requires an appropriate change detection technique and methodology for achieving suitable results[13]. Several change detection techniques have been used for monitoring LULC changes[14], including in monitoring ecosystems[15]; and post-classification comparison was widely applied for its advantage that data from two dates are separately classified, and therefore minimizes the issue related to normalization for atmospheric and sensor differences between the two dates[16].
This study is therefore likely to provide relevant scientific information as a reference for better understanding land use practice and land cover change occurred in the study area in order to support decision makers in landscape planning and resource management as well[17], for conservation reasons, to qualitatively and quantitatively account for changes occurred in FCM through time from 2000 to 2014.
More specifically, the study intends to analyze LULC changes so as to identify the nature of the changes occurred in the study area as well as to estimate the rate of these changes, locate where they happened and explain the main driving causes. For this purpose, a LULC status for the years 2000 and 2014 was analyzed using Landsat (ETM+ and OLI) images, and post-classification comparison technique was applied as a change detection strategy.
2.Materials and Methods
2.1 Study areaFCM (Figure 1) is a reserved forest dedicated for
1.Introduction
Forest is one of the ecosystems playing a vital role in the balance of the planet for its numerous ecosystem ser vices. It significantly contributes namely for maintaining life on earth by supplying for food needs of the terrestrial biosphere in general as well as to socio-cultural and economic needs of human populations, together with its participation in the global climatic equilibrium[1]. An uncontrolled use of forest and its resources could have serious consequences for the present and the future. It appears then urgently important to sustainably manage forest, especially those located nearby growing urban areas, as they are likely to undergo continuous human pressure, which is a severe and rapid threat for the conservation of forest landscape[2][3].
In Gabon, previous studies revealed the impacts that affected forests located close to (peri-) urban areas, including reserved forests like Forêt Classée de la Mondah (FCM). Walters et al., for instance, stated that FCM has undergone multiple anthropogenic impacts for the last eight decades, while describing a case study of how the assessment of endemic species was used to improve the delimitation of a protected area and prevent further downsizing of FCM[4]. That study highlighted that, FCM has usually undergone a strong anthropogenic pressure since its creation in 1934, resulting in the landscape shift causing a loss of 40% of forested area due to drivers such as urban and peri-urban needs, including agriculture, sand extraction and housing construction[4]. As for Hamelin and Lanteigne[5], the real pressure to FCM comes from the population from Libreville whose impact is growing, owing to the road linking the South of FCM (north of Libreville) to the National College of Water and Forest located at the northern part of FCM. This has resulted in practices that have strongly affected the landscape of the area. It therefore appears necessary to account for the land use / land cover dynamic occurred in FCM, especially from early 2000s while the study area experienced major changes.
As little land use / land cover (LULC) studies were held in FCM, and even those which have been held are not always internationally published and therefore hardly
in the region since the 1950s resulted in the arrival of forestry workers, who will gradually become sedentary, constituting a mosaic of scattered villages, with an economic activity turned towards the subsistence agriculture as the forest sector activities gradually declined[18]. Walters et al.[4] stated that, not only most of the previously downsized forest had been cleared for peri-urban land use, but increasing human activity was also encroaching upon the remaining protected area, and management capacity was inadequate by 2010. As a result, the boundary of FCM was redefined and, since 2012, the name changed into Arboretum Raponda-Walker for the new area[4][19][20][21].
2.2 Data and pre-processing
Satellite images together with ancillary data were used in this study, especially GPS coordinates for locating LULC features and high resolution images for visually identifying them. Four Landsat tiles, including two Landsat ETM+ acquired on April 7th 2000 and July 31st 2001 as well as two Landsat OLI acquired on April 6th 2014 and July 27th 2014 were downloaded from United States Geological Survey (USGS), with the same paths and rows of 186 and 60 respectively. As cloud cover limits the number of usable satellite images in Gabon, especially in the coastal region[22], the selected satellite scientific researches of the National College of Water and
Forest of Gabon (In French: Ecole National des Eaux et Forets, shortened as ENEF), under the administrative authority of National Agency of National Parks of Gabon. Gabon, located in the west central Africa, is a country covered 85% of tropical rainforest. There are four seasons in the study area : two rainy seasons, long (February - May, warm weather with lots of precipitations and a cloudy sky) and short (September - November, warm weather with lots of precipitations and a cloudy sky); and two dry seasons, long (June - August, cool weather with a negligible rate of precipitation and a clear sky) and short (December - January, few precipitations, pretty warm weather and a cloudy sky). The average annual precipitations are from 3,000mm to 4,000mm while the monthly mean temperature is around 25°. Its climate is classified to the Equatorial of transition.
FCM spans about 10 kilometers from 9°18’ to 9°24’ East longitude, and approximately 11km from 0°37’ to 0°29’ North latitude. Figure 1 shows the location in the country and administrative boundaries of the study area in 2011[5]. The area is characterized by valleys and rivers, often creating hyper humid climates and diverse vegetation types. The development of logging
A
B
Figure 1. Location of Forêt Classée de la Mondah (FCM) (Circle) in the center of the left side map (A), and the location of Gabon in Africa (B) (Since Hamelin and Lanteigne[5])
applied in order to match UTM projections and reduce the effect of atmosphere. The atmospheric correction was performed using the QUAC (QUick Atmospheric Correction) module of ENVI 4.7. The QUAC method can be reached through at the Basic tools / Preprocessing/
Calibration utilities/Quick Atmospheric Correction menu.
Further details about the QUAC method is available in ENVI User’s Guide at http://www.harrisgeospatial.com/
portals/0/pdfs/envi/ flaash_module.pdf. The calculation
of some spectral indices such as normalized difference vegetation index (NDVI), normalized difference water index (NDWI), normalized difference built-up index (NDBI) and normalized difference soil index (NDSI) images were those with a sufficiently low total
cloud-cover (11.00%, 10.00%, 31.78%, 32.34%, for the Landsat scenes of April 2000, July 2001, April 2014 and July 2014, respectively) within the study area for the time period of interest. Landsat images ETM+ acquired on April 7th 2000 and OLI acquired on April 6th 2014 were used mainly for change detection analysis, while the others were used during the post-classification processing in order to fix some possible confusion between built-up area and cloud cover.
Some pre-processing operations were performed using the ENVI 4.7 software. In addition to radiometric correction, geometric and atmospheric corrections were
were used for the learning phase while validation samples helped assess the accuracy of classification results.
2.3 Classification procedure 2.3.1 Classification schemes
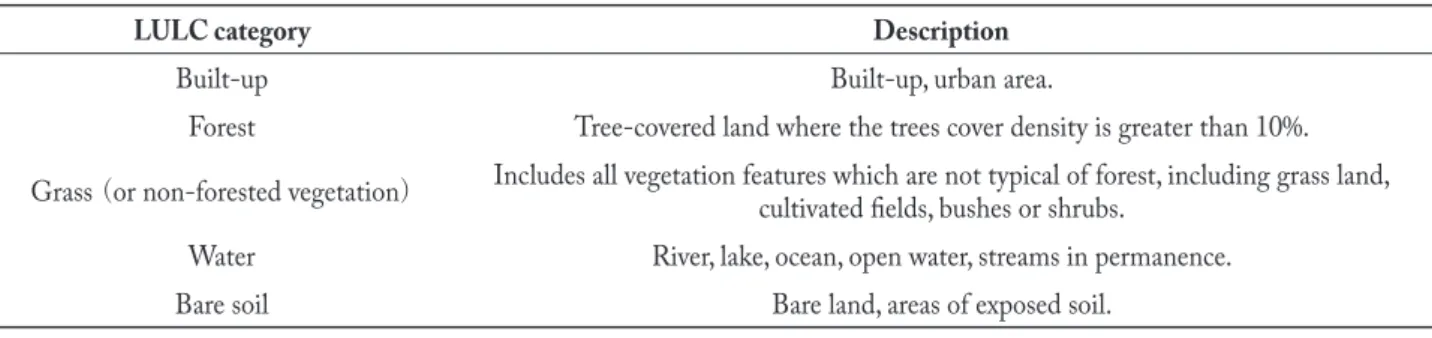
Five thematic land cover classes, as described in Table 1, were defined for this study. The classes were selected considering the major land cover categories in the study area used in previous study performed in FCM[5], taking into account the knowledge of the area and observations during field survey as well as VHR images from Google earth pro. The Non-Forested Vegetation land cover category includes grass land, cultivated fields, bushes or shrubs, and was referred to as grass for convenience reasons, as data and means used during the study did not allow to effectively distinguish cultivated fields from grass lands due to their similar spectral signatures and no particular shape typical to crop lands was observed. In previous study held in FCM bare soil and cultivated fields were combined as a same LULC category, probably for analogous reasons.
2.3.2 Classification approach and algorithm Based on the training samples produced from reference data, a supervised classification was performed to create the thematic maps of 2000 and 2014. In this process, spectral signatures of representative samples corresponding to the above classification schemes are developed then each unknown pixel are compared to spectral pattern and then the most similar land cover class is assigned to it in the entire image[25]. Supervised classification was chosen in this study because the study area was well-known, small and non-complex.
Maximum likelihood algorithm was selected as classification algorithm both for its efficiency to classify pixels of satellite image and its advantage from the point were created (Equations 1 to 4), facilitating to distinguish
features corresponding to different land cover types[23] [24]. Subsetting was generated for each image and layers
were stacked.
(1)
(2)
(3)
(4)
Where NIR is the near infra-red band corresponding to band 4 in Landsat ETM+ and band 5 in Landsat OLI; R is the red band corresponding to band 3 in Landsat ETM+ and band 4 in Landsat OLI; SWIR is the short wave infra-red 2 band corresponding to band 7 in both Landsat ETM+ and OLI.
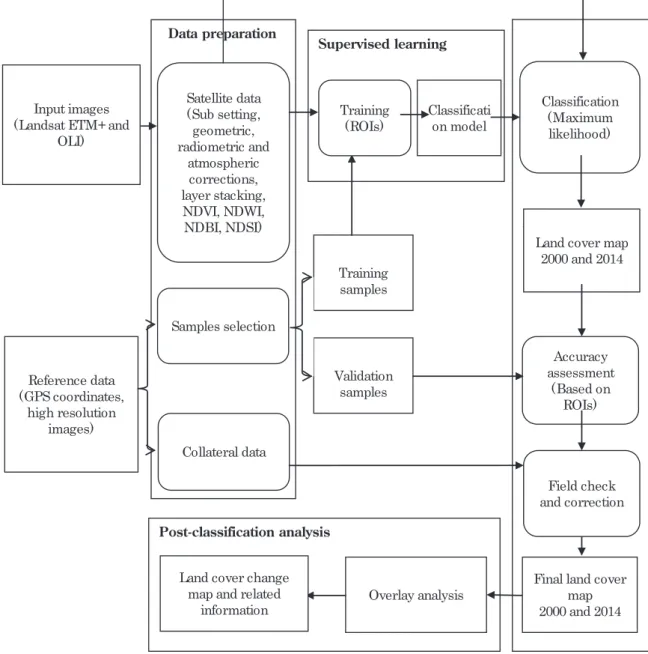
Reference data, collected from ground survey provided by the National College of Water and Forest of Gabon together with very high resolution (VHR) images, retrieved from Google Earth pro and TerraIncognita software, the latter available at https://sourceforge.net/ projects/terraincognita2/, allows to work with various map sources such as Google satellite maps, ESRI ArcGIS, OpenStreetMap, etc., were relevantly important for a better identification of LULC in Landsat images and also for validation of classification results. As illustrated in Figure 2, two samples selections, training samples and validation samples, were generated using both VHR images and satellite images as well as GPS coordinates of some LULC categories provided by ENEF for the classification process. The training samples
Table 1. Classification schemes
LULC category Description
Built-up Built-up, urban area.
Forest Tree-covered land where the trees cover density is greater than 10%. Grass (or non-forested vegetation) Includes all vegetation features which are not typical of forest, including grass land,
cultivated fields, bushes or shrubs.
Water River, lake, ocean, open water, streams in permanence.
2.3.3 Post-classification processing A smoothing was applied on classified images using sieve, clump and majority filters in order to remove salt and pepper look and to generalize classification images. Since spectral signal carries much more information about the land surface than what is immediately visible to human eye[31], further post classification operation was performed on the classified images using collateral data in order to effectively enhance classification results and correct error especially due to cloud contamination.
In fact, because of similar spectral signature between cloud and built-up, cloud contamination could lead misclassification in up area. The presence of built-up area, for instance in forested area, is not impossible and could be interpreted as the reflectance of camps built by people camping at an open forest or villagers’ housings at the so-said location. However, if the presence of built-up area in forested area can be explained as the presence of camps built in forest, it does not necessarily mean that every pixel classified as built-up is not the result of cloud contamination. So then, two additional images (Images of July 2001 and July 2014) were used so as to correct the possible miss-classification due to cloud. It has been done the assumption that, considering the Landsat image pixel size of 30 meters by 30 meters together with the context of increasing urban sprawl going to this region as stipulated by[32] and since the April and July images belong to different seasons (long rainy season and long dry season respectively), every pixel classified as built-up in the April images should be also classified as built-up in the July images to be considered as built-up. Otherwise, it is assumed to be the result of cloud contamination. For this purpose, a computer program was therefore written so that every pixel belonging to built-up category in the April images was replaced by the one at the same location from the July images. The pixel remained the same if both images classified it as built-up.
On the other hand, because change detection analyses strongly depend on the accuracy of classified images, accuracy assessment of the classified maps was performed based on ROIs from validation samples and then lead to the production of a confusion matrix. The accuracy of the land cover change map was determined by multiplying of view of probability theory and also because it is the
widely used algorithm in supervised classification[26][27]. Nonetheless, appropriate training sample data is required for using the maximum likelihood algorithm. So then, regions of interest (ROIs) were iteratively created for the supervised learning stage and the measure of spectral separability was calculated by using Jeffries-Matusita distance (JMD)[28] according to equation 5. JMD is a statistical distance measure of spectral separability between two classes, being among the commonly used spectral separability measures in remote sensing applications. It provides a much reliable criterion because as a function of class separability, and behaves much more like probability of correct classification as well[29][30].
(5)
Where DJM is the Jeffries-Matusita distance;
and are the conditional density function given two classes ω1 and ω2, respectively.
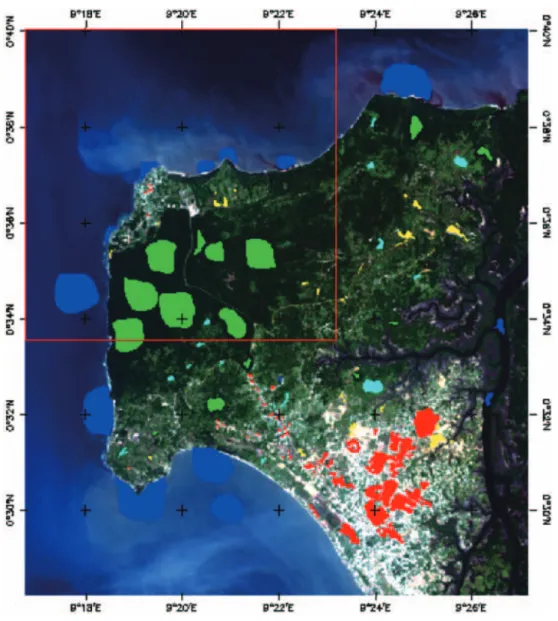
The more are the training samples in ROIs the better is spectral separability between ROIs and, consequently, the higher is the classification accuracy. The samples for ROIs were collected based on ground survey information collected in 2016 together with the use of high resolution (HR) images through Google Earth, which provides different temporal and spatial scales of visualization. During the process, care was taken so that training and validation polygons for ROIs in the satellite images were not overlapped and matched the same location in the HR images. The sample polygons of ROIs for validation were selected taking into account GPS coordinates from ground survey, the latter being located in Google Earth in order to check the accordance and then the same coordinates where used in ENVI 4.7 software to draw the polygons for the corresponding ROIs in satellite data. For the case of sample polygons for training GPS coordinates, only visual interpretation of satellite data and Google Earth were performed, as the study area was small and the Landsat data were nearly clear pixels. Figure 3 depicts the training sample ROIs for 2014 in the study area.
well[14]. In order to detect changes in LULC, an overlay analysis was conducted, resulting in the production of a cross matrix. It is therefore critical for the classified images to be accurately classified. In this study, accuracy assessment was performed by producing a confusion matrix for both LULC map of 2000 and 2014, and the accuracy of the LULC change map was determined by the product of the accuracies of the two classified images[16]. Figure 2 gives an overview of the overall methodology.
the individual classification map accuracies[33]. 2.4 Change detection technique
Among the available change detection techniques, post-classification comparison was used for change detection analysis in this study. This technique is a comparative pixel by pixel analysis of spectral classification images produced independently to match a common LULC type. The resulted image produces areas of each change class. It is the most common used technique in change detection. It has the advantage to be intuitive, to provide change matrix and direction, and to minimize the impact of atmospheric, sensor and environmental differences as
Figure 3. Training sample ROIs for 2014 in the study area
Polygons were extracted across the study area taking into account the extent of diverse classes. Plus, care was taken such that a maximum of pixels and polygons were selected for classes likely to show some variation in their spectral signatures, as for instance water.
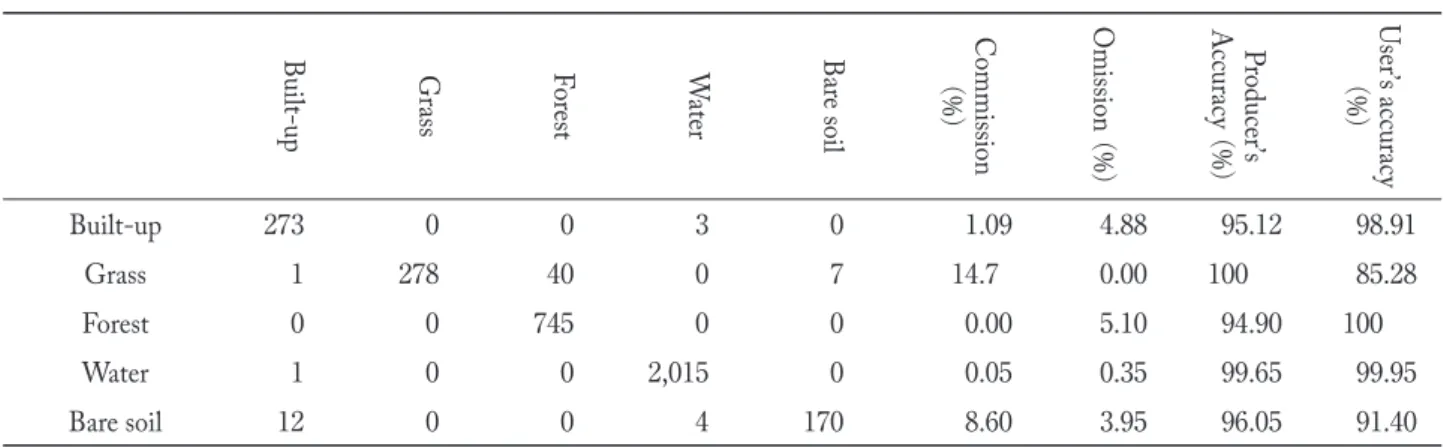
as displayed in Table 3-a and Table 3-b, while 2014 has an overall accuracy of 98.084% and kappa coefficient of 0.969. The high value of accuracy and kappa coefficient was due to the fact that the study area was small and not complex, having nearly clear pixels. In addition, the post-classification processing based on computer programming appeared provided further improvement to visual interpretation of satellite data, and was extremely effective for enhancing classification results accuracy. The use of computer programming for improving classification results is not typical to the current study. In previous studies such as the one conducted by Chica-Olmo and Abarca-Hernández[35], a computer program was successfully written for creating a multi-band image texture which was used with the classification process as additional information.
3.Results and discussion
3.1 Accuracy assessment of the classification images
In order to ensure a good accuracy of classified maps, the calculation of spectral separability was performed using the Jeffries-Matusita distance. The result of spectral separability between land cover classes through the corresponding ROIs is reported in Table 2. The JMD of all ROIs were close to 2.000, indicating a good spectral separability between ROIs. The overall spectral separability was better in validation data rather than training data due to the fact that sample selection was more carefully performed for validation data as stipulated by Olofsson et al.[34].
The result of the overall accuracy and the kappa coefficient for 2000 were 98.694% and 0.975 respectively,
Table 2. Jeffries-Matusita distance for each combination of region of interest
Combination of regions of interest ROIs of for training2000 ROIs of for validation2000 ROIs of for training2014 ROIs of for validation2014
Built-up and Bare soil 1.853 1.899 1.858 1.928
Forest and Bare soil 1.892 1.981 1.979 1.996
Grass and Bare soil 1.937 1.976 1.986 1.998
Water and Bare soil 2.000 1.998 2.000 2.000
Grass and Built-up 1.997 1.987 1.999 2.000
Forest and Grass 1.775 1.840 1.992 2.000
Forest and Built-up 1.994 1.998 2.000 2.000
Water and Built-up 2.000 2.000 2.000 2.000
Water and Forest 2.000 2.000 2.000 2.000
Water and Grass 2.000 2.000 2.000 2.000
Table 3-a. Confusion matrix for LULC classification map of 2000
Built-up Gr ass F or est Wa te r Bar e soil Commission ( % ) Omission ( % ) P roducer ’ s A ccurac y ( % ) U ser ’ s accurac y ( % ) Built-up 125 1 0 2 7 7.41 1.57 98.43 92.59 Grass 0 102 19 0 0 15.7 4.67 95.33 84.3 Forest 0 4 1,092 2 0 0.55 1.71 98.29 99.45 Water 0 0 0 2,533 0 0 0.74 99.26 100 Bare soil 2 0 0 15 77 18.09 8.33 91.67 81.91
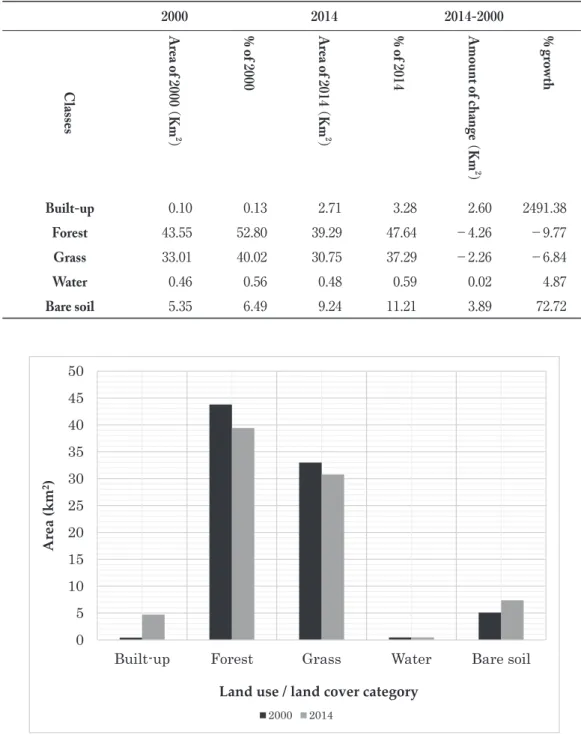
4) indicates that urban area increasingly changed in size reaching even more 20 times the initial surface going from 0.10km2 to 2.71km2. Bare soil and water also show a positive change from 5.35km2 to 9.24km2, whereas forest and grass decreased by 9.77% and 6.84% respectively. Figure 5 is a LULC chart for 2000 and 2014, allowing to quickly visualize the rate of change from the total area of FCM for each land cover category, highlighting negative and positive percentage of change respectively for vegetation and other land cover categories. The rapid increase of built-up around and even in the study 3.2 Analysis of LULC status in 2000 and
2014
Figure 4 provides the spatial distribution of major land cover categories across the study area for the years 2000 (Figure 4-a) and 2014 (Figure 4-b). It reveals that urban area has considerably developed from the south part and spreading to the north while grass land increased in the north and north-east. The 2014 map indicates the apparition of water in the center of the study area. The application of GIS techniques allowing to extract zonal geometry from classified maps (Table
Table 3-b. Confusion matrix for LULC classification map of 2014
Built-up Gr ass Fo re st Wa te r Bar e soil Commission ( % ) Omission ( % ) P roducer ’ s A ccurac y ( % ) U ser ’ s accurac y ( % ) Built-up 273 0 0 3 0 1.09 4.88 95.12 98.91 Grass 1 278 40 0 7 14.7 0.00 100 85.28 Forest 0 0 745 0 0 0.00 5.10 94.90 100 Water 1 0 0 2,015 0 0.05 0.35 99.65 99.95 Bare soil 12 0 0 4 170 8.60 3.95 96.05 91.40
A
B
be an important factor for the extension of built-up area together with economic activities and other anthropogenic impacts.
Hamelin and Lanteigne[5] depicted the gravel pit extraction in the FCM, which has been confirmed by the analysis of multi temporal high resolution images retrieved from Google earth pro, indicating that after the prohibition by the Government to extract gravel pit and sand, this part of the area was changed into a area was anticipated by previous researchers in Gabon.
Nguema[32], in his analysis of the expansion of Libreville, designated the south part of FCM as a target for the increasing population of Libreville. Hamelin and Lanteigne[5] stated that FCM is the most favorable sector to welcome new inhabitants from Libreville; the road linking the south of the study area to the National College of Water and Forest plus enhancement of life conditions for surrounded population would
Figure 5. LULC chart for 2000 and 2014
Table 4. LULC area and rate of change for the years 2000 and 2014
2000 2014 2014-2000 C lasses Ar ea of 2000 ( Km 2 ) % of 2000 Area of 2014 ( Km 2 ) % of 2014 Amount of change ( Km 2 ) % g row th Built-up 0.10 0.13 2.71 3.28 2.60 2491.38 Forest 43.55 52.80 39.29 47.64 −4.26 −9.77 Grass 33.01 40.02 30.75 37.29 −2.26 −6.84 Water 0.46 0.56 0.48 0.59 0.02 4.87 Bare soil 5.35 6.49 9.24 11.21 3.89 72.72
highlighting the major changes and a LULC change matrix as well in order to figure out conversion of LULC categories across the study period are displayed respectively in Figure 6 and Table 5. The map locates the changes occurred while the matrix indicates the rate of these changes from one category to another one out of the total area of FCM.
The map shows that changes in the south of the study area together with unchanged areas look like a mosaic of several land cover categories converted mainly into built-up area and bare soil. Forested area was affected in its northern part being converted into grass while a gain of forest from grass was observed in the southern part of the main bloc of the forested area. A comparison with GTZ (1997) map, used by Hamelin, C. and Lanteigne[5] revealed that the remaining forested area covered by plantation of the tree species Okoume (Aucoumea klaineana) has been converted lake as revealed in the 2014 classification map. This
was also validated by a survey held in December 2016. The available Google Earth information revealed that activities related to gravel pit extraction were performed between June 12th 2007 and February 11th 2009 and the lake appeared on May 3rd 2011. Given that no official data was provided about the real beginning of either the gravel pit extraction activities nor its ban and that Google Earth Pro did not provide further information in the study area between January 6th 2001 and June 12th 2007 and between February 11th 2009 and May 3rd 2011, it can be thought that the exploitation of gravel pit and the apparition of the lake might have started earlier than the date Google Earth Pro indicated. Further investigation is however necessary to validate this statement.
3.3 LULC conversion from 2000 to 2014 Further information through a change detection map
Legend Forest Forest to grass Forest to build-up Water Water to build-up Water to bare soil Grass to water Grass to forest Grass
Grass to build-up Grass to bare soil Bare soil to water Bare soil to forest Bare soil to grass Bare soil to build-up Bare soil
categories to other LULC categories are depicted in Figure 7. Almost all LULC categories contributed negatively to net change in forested area. Forest area has mainly been affected by built-up and grass land.
Water did not experience significant changes. Grass land was extended by the reduction of forest and was reduced due to the extension of built-up area and bare soil. The major enlargement of bare soil was due to grass land while its reduction was caused by the expansion of built-up area. Except water, built-up area spread across almost all other LULC categories without having been converted into any of them.
4.Conclusions
Satellite remote sensing and GIS techniques provided relevant information so as to improve understanding of the process of changes in LULC patterns within FCM. Landsat data combined with high resolution images derived from Google Earth appeared to be highly effective in this study namely for accurately sampling ROIs. Ground survey data were extremely helpful as collateral information in order to enhance the satellite-based analysis, especially for accurately validating results produced through the processing of remotely sensed data. Moreover, Google Earth pro provided relevant information which helped explain and determine the approximate period of the apparition of a lake as a result of irreversible impact of anthropogenic activity in the center of the study area. Vegetation (Grass and forested areas) was the LULC category which experienced the most severe impacts from other LULC categories, namely built-up and bare soil, during the study period 2000∼ 2014, while built-up area expanded at the expense of into bare soil, grass land and, at a less extent, built-up area.
Further analysis of the LULC change map (Figure 6) revealed a conversion from grass (non-forested vegetation) to forested area mainly in the south part of Parcelle des conservateurs. Parcelle des Conservateurs is the most densely forested area in FCM and is known to contain various rapid growth tree species at the top of which
Aucoumea klaineana, commonly called Okoume. The
conversion from grass to forested area could therefore be explained as being the result of natural regeneration of rapid growth tree species which colonized the area, consecutively to the Agency of National Park (ANPN) action which consisted in rigorous and regular controls in the area and preventing surrounded population to have severe impacts on both forested and non-forested vegetation by evading them from that area.
Further analysis reveals (Table 5) important rate of change from the initial surface of each LULC category, indicating that : (1) about 9.41% of forested area has been converted into grass, 1.65% area into built-up area and 0.1% area into bare soil; (2) around 5.74% area of grass land has been converted into forest, 5.97% into bare soil and 1.91% into built-up ; (3) approximately 1.69% of area of bare soil has been converted into grass, 0.20% area into forest and 1.10% area into built-up area; (4) nearly 0.02% area of water has been converted into bare soil, the same amount was converted into built-up area; and (5) Built-up area has not been changed into another LULC category except about 0.03% of its initial surface into bare soil.
3.4 Contribution to net change in LULC categories
The contribution in conversion of some LULC
Table 5. Land cover change matrix of FCM from 2000 to 2014
Built-up Forest Grass Water Bare soil
km2 % km2 % km2 % km2 % km2 % Built-up 0.07 0.08 1.36 1.65 1.58 1.91 0.02 0.02 0.91 1.10 Forest 0.00 0.00 34.55 41.90 4.73 5.74 0.00 0.00 0.17 0.20 Grass 0.00 0.00 7.76 9.41 21.72 26.33 0.00 0.00 1.39 1.69 Water 0.00 0.00 0.00 0.00 0.05 0.06 0.47 0.57 0.01 0.02 Bare soil 0.02 0.03 0.09 0.10 4.92 5.97 0.02 0.02 2.66 3.22
Agency (JICA). The authors acknowledge the National College of Water and Forest of Gabon for further ground truth data provided during field survey.
Author Contributions
Mboumba Mariano designed the study, performed analyses and wrote the paper; Ichio Asanuma supervised the research and revised the paper; Jong-Geol Park wrote the computer program, supervised the experiments and revised the paper; Keitarou Hara and Mizuki Tomita revised the paper. All the authors approved the final paper before submission.
Conflicts of Interest
The authors declare no conflict of interest. The founding sponsors had no role in the design of the study; in the collection, analyses, or interpretation of data; in the writing of the manuscript, and in the decision to publish the results.
【References】
[1] FAO: A statement by FAO Director-General, International Day of Forests, 2014. (online), available from 〈 http://www.fao.org/about/who-we-are/director-gen/faodg-statements/detail/en/c/217820/〉(accessed other LULC categories caused by urban sprawl occurring
in the southern part of the study area.
On the other hand, the use of computer programming as a post-classification task together with the use of satellite images acquired at different season for discriminating possible cloud contamination and built-up in forested area appeared to be promising for further investigation within the context of a study area where cloud cover is not seldom.
This study is likely to be used as a scientific reference accounting for changes happened in FCM for the time period of 2000∼2014 and also for decision makers while developing conservation policies in order to generate sustainable LULC management practices for conservation purpose.
The lack of literatures available about classical satellite-based LULC change analysis in FCM is a limitation to this study, especially because the current study does not have any similar study conducted in FCM which is likely to be used as a reference for a rigorous comparison.
Acknowledgments
This study was supported by the African Business Education Initiative for youth program of Japanese government, under Japan International Cooperation
-4.00 -3.00 -2.00 -1.00 0.00 1.00 2.00 3.00 4.00
Built-up Forest Grass Water Bare soil
Area (k m 2) Built-up Forest Grass Water Bare soil
(2005).
[14] Singh, A.: Review Articlel: Digital change detection techniques using remotely-sensed data, Int. J. Remote
Sens., Vol.10, No.6, pp.989-1003(1989).
[15] Coppin, P., Jonckheere, I., Nackaerts, K., Muys, B. and Lambin, E.: Digital change detection methods in ecosystem monitoring: A review, Int. J. Remote Sens, Vol.25, No.9, pp.1565-1596(2004).
[16] Bhatt, A.: A review of change detection techniques, I N D I A N I N S T I T U T E O F T E C H N O LO G Y ROORKEE, 2012. (online), available from 〈https:// www.slideshare.net/abhishek_bhatt/a-review-of-change-detectiontechniques〉(accessed 2017-12-03).
[17] Al-doski, J., Mansor, S. B., Zulhaidi, H. and Shafri, M.: Image Classification in Remote Sensing, J. Environ. Earth
Sci., Vol.3, No.10, pp.141-148(2013).
[18] UICN: Réalisation d’un Diagnostic territorial et Suivi des dynamiques d’Occupation des Sols dans l’Arc d’Emeraude, J-Géo 2014 COMPTE RENDU (2015). [19] RÉPUBLIQUE GABONAISE, Décret no.719/PR/
MECV du 3 juillet 2001 portant déclaration d’utilité publique de I’occupation de zones bordant la route départementale du Cap-Estérias. GABON (2001). [20] RÉPUBLIQUE GABONAISE, Décret no.34/PR/
MEFEPEPN du 22 janvier 2004 portant déclassement de deux parcelles à l’intéieur de la forêt classée de la Mondah. GABON (2004).
[21] RÉPUBLIQUE GABONAISE, Decret no.0460/PR/ MEF portant classement de l’Arboretum Raponda-Walker. GABON: SAFI (2012).
[22] MALOBA MAKANGA, J. D.: Reseaux de mesure meteorologiques au Gabon: Pour quelle evaluation des changements climatiques?, Libreville (GABON), 14 (2011).
[23] Xu, H.: Fast information extraction of urban builtup land based on the analysis of spectral signature and normalized difference index, Geogr. Res., Vol.24, No.2, pp.311-320 (2005).
[24] Young, N. E., Anderson, R. S., Chignell, S. M., Vorster, A. G., Lawrence, R. and Evangelista, P. H.: A survival guide to Landsat preprocessing, Ecology, Vol.98, No.4, pp.920 -932(2017).
[25] Gisgeography.: Image Classification Techniques in Remote Sensing, Gisgeography, (online), available From 〈
http://gisgeography.com/image-classificationtechniques-remote-sensing/〉(accessed 2017-12-03).
[26] Abburu, S. and Babu Golla, S.: Satellite Image Classification Methods and Techniques: A Review, Int. J.
Comput. Appl., Vol.119, No.8, pp.20-25(2015).
2017-12-03)
[2] Mdemu, M. V. and Burra, M. M.: Drivers of Land Cover Dynamics for Pugu and Kazimuzumbwi Forest Reserves in Kisarawe, Tanzania, Open J. For, Vol.6, No.5, pp.348 -360(2016).
[3] Turner, M.G. and Gardner, R. H.: Landscape Ecology in
Theory and Practice: Pattern and Process, Springer-Verlag
(2001).
[4] Waltersa, G., Ngagnia Ndjaboundaa, E., Ikabangaa, D., Biteaua, J. P., Hymasa, O.,Whitea, L. J. T., Ndong uda, O. and Stévarta, T.: Peri-urban conservation in the Mondah forest of Libreville, Gabon: Red List assessments of endemic plant species, and avoiding protected area downsizing, Oryx, Vol.50, No.3, pp.419-430(2016). [5] Hamelin, C. and Lanteigne, F.: Étude diagnostic
de la mise en place d’une Forêt modèle au Gabon et identification des utilisateurs et des enjeux sur le territoire, UNIVERSITÉ LAVAL, Québec, Canada, pp.62(2011).
[6] Xie, Y., Sha, Z. and Yu, M.: Remote sensing imagery in vegetation mapping: a review, J. Plant Ecol., Vol.1, No.1, pp.9-23(2008).
[7] Finley, S. R.: Mapping Land Cover Change with Satellite Remote Sensing, Land cover change mapping, Fact Sheet5, Remote sensing and geospatial analysis Laboratory, Unversity of Mnnesota , pp.1-4(2016). [8] Zhou, Q., Li, B. and Chen, Y.: Remote sensing change
detection and process analysis of long-term land use change and human impacts, Ambio, Vol.40, No.7, pp.807 -818(2011).
[9] Jat, M. K., Garg, P. K. and Khare, D.: Monitoring and modelling of urban sprawl using remote sensing and GIS techniques, Int. J. Appl. Earth Obs. Geoinf., Vol.10, No.1, pp.26-43(2008).
[10] Reis, S.: Analyzing land use/land cover changes using remote sensing and GIS in Rize, North-East Turkey,
Sensors, Vol.8, No.10, pp.6188-6202(2008).
[11] Vittek, M., Brink, A., Donnay, F., Simonetti, D. and Desclée, B.: Land cover change monitoring using landsat MSS/TM satellite image data over west Africa between 1975 and 1990, Remote Sens., Vol.6, No.1, pp.658-676 (2013).
[12] Miller, H. M.: Users and Uses of Landsat 8 Satellite Imagery-2014 Survey Results, USGS Publications Warehouse, p.27(2016).
[13] Lu, D., Mausel, P., Batistella M. and Moran, E.: Landcover binary change detection methods for use in the moist tropical region of the Amazon: a comparative study, Int. J. Remote Sens., Vol.26, No.1, pp.101-114
[27] Murai, S.: Text books of remote sensing and GIS, 1999. (online), available from 〈http://wtlab.iis.u-tokyo. ac.jp/~wataru/lecture/rsgis/rsnote/cp11/cp11-7.htm〉 (accessed 2017-12-03).
[28] Guo, B., Damper, R. I., Gunn, S. R. and Nelson, J. D. B.: A fast separability-based feature selection method for high-dimensional remotely-sensed image classification,
Pattern Recognit., Vol.41, No.5, pp.1653-1662(2008).
[29] Padma, S. and Sanjeevi, S.: Jeffries Matusita based mixedmeasure for improved spectral matching in hyperspectral image analysis, Int. J. Appl. Earth Obs.
Geoinf., Vol.32, pp.138-151(2014).
[30] Swain, P. H. and King, R. C.: Two Effective Feature Selection Criteria for Multispectral Remote Sensing, Lab.
Appl. Remote Sens. Tech. Reports, Vol.39, pp.1-6(1973).
[31] Wegmann, M., Leutner, B. and Dech, S.: Remote sensing
and GIS for Ecologists: Using Open Source Software, Exeter.
UK: Pelagic Publishing (2016).
[32] Nguema, R . M.: DEVELOPPEMENT DE LA VILLE, DECOUPAGE ET APPROPRIATION DES TERRITOIRES URBAINS AU GABON: LE CAS DE LIBREVILLE, Belgeo Rev., No. December 31st 2005, pp.54-81(1970).
[33] Torahi, A. A. and Rai, S. C.: Land Cover Classification and Forest Change Analysis, Using Satellite Imagery - A Case Study in Dehdez Area of Zagros Mountain in Iran, J.
Geogr. Inf. Syst., Vol.3, No. January, pp.1-11(2011).
[34] Olofsson, P., Foody, G. M., Herold, M., Stehman, S. V., Woodcock, C. E. and Wulder, M. A.: Good practices for estimating area and assessing accuracy of land change,
Remote Sens. Environ., Vol.148, pp.42-57(2014).
[35] Chica-Olmo, M. and Abarca-Hernández, F.: Computing geostatistical image texture for remotely sensed data
classification, Comput. Geosci., Vol.26, No.4, pp.373-383