Network Type, Industry and Knowledge Transfer
in Networks
journal or
publication title
International review of business
number
11
page range
1-23
year
2011-03
Network Type, Industry and
Knowledge Transfer in Networks*
Koichiro OKAMURA**
Abstract
Organizations in networks learn from each other. However, the level of their learning may not necessarily be equal among networks, since, for example, tacit or cumulative knowledge is, in general, difficult to learn or transfer. Organizations may, therefore, learn more in industry networks that are characterized with explicit or less-cumulative knowledge than in other networks. This study analyzes knowledge transfer in inter-organizational networks to examine the relationship between the characteristics of knowledge and the level of knowledge transfer. It compares two industry networks that differ in sectoral characteristics and two alliance networks with different origins. Two mutually-contradictory findings emerged from the analysis. It was found from the analysis of alliance networks that organizations learn more in networks that are less technology-oriented, and therefore, new knowledge is created that tends to be more explicit and easier to learn. It was found, on the other hand, from the analysis of industry networks, that organizations learn more in networks that are characterized by tacit and cumulative knowledge. These findings highlight the tension between public policy and the interests of private firms and thus provide several implications for both R&D managers and policymakers.
Keywords: knowledge transfer, alliance network, sectoral innovation systems,
technological regimes.
1. Introduction
Organizations are interconnected through a variety of social and economic relationships, each of which can constitute a social network of relationships. In recent years, organizations have been increasingly viewed as agents embedded in the networks. Additionally, more researchers have analyzed knowledge transfer from the network perspective, reflecting increasing interest in social networks (Borgatti and Foster, 2003). Several special issues on networking have appeared in journals such as Strategic Management Journal (edited by Gulati et al., 2000) and Academy of Management Journal (edited by Brass et al., 2004).
* The previous version of the paper was presented at the 12th International Schumpeter Society Conference in 2008. The author would like to acknowledge the participants for their valuable comments and suggestions to improve the paper.
There remains an empirical gap between the theories and the findings, however. Researchers are interested primarily in the influence of firm-specific factors such as past experience and position in the network. They pay less attention to the characteristics of networks in which the firms are embedded. With regard to knowledge transfer, however, the level of knowledge transfer between firms may differ according to industry, type, or position. Reagans and McEvily (2003) pointed out that researchers often examine the factors that influence organizations’ performance outcome but make the argument about knowledge transfer based on the assumption that there is a casual relationship between the two factors. They take it for granted that firms’ learning from networks is instantly reflected in their performance. The intermediary process, the knowledge transfer itself, has rarely been examined directly, and most of the few studies are case studies or small-scale surveys (Sobrero and Roberts, 2001).
This study directly measures the knowledge transfer in networks using patent-citation-based indices proposed by Mowery et al. (1996, 1998) to answer critiques. Specifically, this study compares the knowledge transfer among firms in two networks from different industries. It uses a classification scheme of industries and uses the technological regimes of Schumpeter Mark I and Mark II (Malerba and Orsenigo, 1996; Breschi et al., 2000; Malerba, 2002). The initial conditions of a specific industry may determine network structure, among which the characteristics of technologies that populate an industry are most critical (Kogut, 2000). These differences may result in the differences in knowledge transfer. This study also compares the knowledge transfer between two networks of different origins: the alliance network and the research joint venture (RJV) network, both of which are technology-oriented. The latter of these is more oriented toward R&D than the former. If network dynamics differ between networks of different origins, there may be a difference in knowledge transfer (Inkpen and Tsang, 2005).
This study found that organizations in networks learn more in Mark II industries, where knowledge is cumulative and difficult to learn, than in Mark I, where organizations aren’t required to acquire others’ level of knowledge. Organizations in the RJV network, which is characterized by higher appropriation concerns and by knowledge that is more tacit in nature (and thus difficult to learn), learn less than those in the technology alliance network. As for the organizations’ position in the network, those positioned at structural holes supposedly have the information advantage (Burt, 1992), but they actually learn less than those positioned elsewhere. These findings provide several implications for both R&D managers and policymakers, and they highlight the tension between public policy and the interests of private firms.
The rest of the paper is organized as follows. Section 2 lays out the theoretical underpinnings of the analysis and research hypotheses. Section 3 describes the data and
methods for analysis. Section 4 is an empirical section presenting the analysis results. Section 5 concludes the study by discussing the findings and some of its limitations and by pointing out a future extension of the study.
2. Theory and Hypotheses
2.1 Industry and Knowledge Transfer
The characteristics of technologies that populate an industry determine network structure (Kogut, 2000). The differences between industry networks are accounted for by industrial conditions such as technological opportunity, the ability to economically modify technology, appropriability, the ability to keep technical knowledge private, etc. This study uses the concepts of technological regimes of Schumpeter Mark I and Mark II that are proposed and advanced by Malerba and Orsenigo (1996), Breschi et al. (2000), and Malerba (2002) as a framework for the comparison between industries. The concept identifies four characteristics (technological opportunities, appropriability conditions, cumulativeness of technological advantage, and role of generic knowledge) to determine the nature of innovation in industries, and it categorizes industries into two groups: Mark I and Mark II.
Specifically, Mark I is characterized by high technological opportunities, low appropriability, low cumulativeness, and a limited role of generic knowledge. It is thus labeled as creative destruction with high ease of market entry, low concentration of innovative activity, a significant role played by small firms in innovations, and constant erosion of the technological advantages of the established firms. Its innovative base is continuously widening through the entry of new innovators and the erosion of the advantage of the established firms. For example, industries such as instruments, industrial machinery, and household electrical appliance belong to Mark I.
Mark II is characterized by relatively low technological opportunity, high appropriability, high cumulativeness, and a generic knowledge base. It is thus labeled as creative accumulation with dominance of large established firms, high concentration and cumulation of innovative activity, and barriers to entry of new firms in both technology and market. Its innovative base is deepening because of the cumulativeness of innovative capabilities. For example, industries such as automobiles, chemicals, and electronic components belong to Mark II.
The difference in the technological regimes is reflected in the difference in knowledge transfer between networks. In Mark II industries, organizations must regularly collaborate with others to increase in knowledge, as these are characterized as an environment of high cumulativeness of knowledge. The impact of networks on the knowledge transfer can be larger in Mark II industries than in Mark I industries, where the environment is characterized by low cumulativeness. The generic knowledge base would have a similar impact on the
effectiveness of the network. The argument is summarized as:
Hypothesis 1: Organizations in Mark II industries learn more than those in Mark I industries.
2.2 Network Type and Knowledge Transfer
The purpose and nature of networks differ between networks depending on their origins, and this can lead to a difference in knowledge transfer (Inkpen and Tsang, 2005). To examine the question posed by the authors, this study compares the knowledge transfer between two alliance networks that have different origins (network types): the technology alliance network and the RJV network. The former network is formed through the alliances that possess technological elements. The latter is formed through the research joint ventures (RJVs) that also possess technological elements but have a stronger technological orientation (R&D), which leads to more appropriation concerns due to the issues regarding precompetitive technologies generated in RJV.
In general, an alliance with technological elements faces appropriation concerns to some extent, because it is often difficult to circumscribe, monitor, and codify the knowledge included within it. Such difficulties may result in concerns about possible appropriation of key technologies by the partners (Oxley, 1997; Gulati and Singh, 1998). These concerns are further compounded by the so-called knowledge paradox (Arrow, 1962) and become more acute if the alliance is more strongly oriented toward R&D than toward technology licensing. RJVs have a stronger technological orientation than technology alliances have. Organizations in RJVs, therefore, need to behave more cautiously with regard to knowledge leaks or the sharing of their own knowledge and technologies with partners, which can result in less knowledge transfer between the organizations in RJVs. Further, a different but related factor that could also result in less knowledge transfer is the fact that the knowledge created in RJVs is tacit and difficult to codify. It is closer to basic science than the knowledge created in or transferred between technology alliances.
Nooteboom (2004) and Nooteboom and Gilsing (2004) argued that two modes of networks exist in an alliance network: (1) exploration and (2) exploitation. These two networks evolve differently and possess different characteristics. The network for exploration is characterized by new and emerging technology and knowledge. It therefore suffers from the uncertainty associated with evolving knowledge. The network for exploitation is, on the other hand, characterized by dominant designs in technology that help decrease uncertainty and increase efficiency in knowledge flow.
March (1991) also argued about the modes of exploration and exploitation in organizational learning. Exploration includes activities such as searching, innovation, or capability enhancement, which is accompanied by uncertainties. Exploitation, on the other
hand, includes activities such as refining existing capabilities or efficiency in operation, which are certain in the short term. The technology alliance network is characterized by the mode of exploitation, while the RJV network is characterized by the mode of exploration. The difference in the level of knowledge transfer between the two alliance networks is summarized as follows:
Hypothesis 2: Organizations in the technology alliance network learn more than those in the RJV network.
2.3 Trust, Experience, and Multiple Participations
Empirical studies have reported that organizations with prior collaboration with one another are more likely to collaborate again (Gulati, 1995; Okamura and Vonortas, 2009). Familiarity between partners typically lowers the costs of collaboration in terms of gathering information about the partners, bargaining, writing a contract, and enforcing the agreement. Trust displaces a lot of these costs (Gulati, 1995). Trust also allows the organizations to access the partners’ resources and leads to a willingness to work things out through mutual problem-solving efforts (Uzzi, 1997). Thus, trust leads to a shared understanding and results in a higher level of knowledge transfer between partners.
Prior collaboration also helps organizations to accumulate the know-how and skills for such interaction. Absorptive capacity of organizations as well as a capacity to recognize the value of new external knowledge, assimilate it, and apply it to commercial ends (Cohen and Levinthal, 1989, 1990) are increased due to prior collaborations (Larsson et al., 1998). Furthermore, the experience in collaboration allows an organization to situate itself in an information-rich position in the network (Powell et al., 1996). However, the marginal benefits from trust in R&D collaboration may decrease from a certain point, and the total benefits may flatten out. Uzzi (1996), for example, suggested that the relationship between strong ties and the possibility of firm failure forms an inverted U-shape.
Some organizations participate in multiple collaborations and therefore appear twice or more in networks. Some literature supports the increasing utility of multiple collaborations, while other literature supports the opposite perspective. Gulati et al. (2000) pointed out that participation in multiple networks may provide organizations with more diverse information but that such networks may lock organizations into a suboptimal relationship. This may result in inefficiency in the knowledge transfer within the network. It is, thus, of interest to examine the marginal utility of subsequent participation in networks. This study supports diminishing utility.
Hypothesis 3: The utility of organizations’ subsequent participation in networks to the knowledge transfer is smaller than that of their first participation.
2.4 Position in Network
The position of organizations in a network can determine the level of knowledge transfer, with which is related an argument about the advantage of closure (Coleman, 1988) versus structural holes (Burt, 1992) in networks. The argument supporting closure, in which organizations are mutually linked with others, argues that closure creates trust and facilitates cooperative exchanges among the members through social norms, obligations, or sanctions. The argument supporting structural holes (places in networks that are scarce, with links that bridge the sections in the networks otherwise unlinked with one another) argues that organizations positioned at the structural holes have the informational advantage. As the organizations positioned at the structural holes in networks have an informational advantage over the other organizations, they have more opportunities to learn a wide range of knowledge from diversified partners and thus may benefit more from increased technological opportunities.
Empirical findings are inconclusive, but the majority of studies support the structural holes argument. Several studies have, for example, identified the benefits of structural holes, such as increased competitive capabilities (McEvily and Zaheer, 1999) or increased innovativeness (Baum et al., 2000). Ahuja (2000), on the other hand, reported that in a chemical industry, a firm’s innovativeness increases with closure, while it decreases with structural holes. Potential outcome discrepancies (Kumar and Nti, 1998), however, could make the organizations that collaborate with those positioned at structural holes cautious about knowledge leaks to their partners, as the partners could gain more than they from knowledge transfer:
Hypothesis 4: Organizations positioned at structural holes learn less than those not.
3. Data and Methods
3.1 Alliance Data and Methodology to Construct Alliance Networks
This study uses two alliance databases to construct the technology alliance network and the RJV network. Strategic Alliances data from the SDC Platinum provided by Thomson Financial is used to construct the technology alliance network. It obtains the information about alliances from publicly available sources such as SEC filings, news reports, industry publications, etc. It covers 104,347 alliances, including licensing alliances, manufacturing alliances, etc., as well as R&D alliances that existed between 1985 and 2004. Specifically, this study focuses on the technology alliances that have technological elements such as licensing or manufacturing as well as R&D in alliance activity.
The NCRA-RJV database is used to construct the RJV network, which is maintained at the George Washington University’s Center for International Science and Technology Policy. It covers 847 RJVs registered with the U.S. Department of Justice between January 1985 and
December 2000 under the provisions of The National Cooperative Research Act of 1984 (NCRA) and its amendment, the National Cooperative Research and Production Act of 1993 (NCRPA). The purpose of these legislations is, in short, to promote R&D collaboration among the U.S. firms and other organizations1. It collects information about the RJVs from the Federal Register.
Alliance networks are constructed in the same manner, based on these databases. Specifically, an alliance network is constructed by creating a link between two organizations when they participate in the same alliances. Self-loops, which happen, for example, when an organization participates in an alliance multiple times through its divisions or subsidiaries, aren’t taken into account. Link values that result from organizations’ participation in multiple alliances likewise are not taken into account, following the customary practice in social network analysis. In sum, a binary link is created between organizations in alliance networks if they share alliance membership.
3.2 Patent Data and Indices to Measure Knowledge Transfer
This study uses patent data (Hall, 2004) to measure the level of knowledge transfer. It covers 3.4 million U.S. patents granted between 1968 and 2002 as well as 22.3 million patent citations between 1975 and 2002.
This study follows Mowery et al. (1996, 1998) to measure the knowledge transfer between organizations through the analysis of patent citation. Mowery et al. (1996) found that firms that are technologically similar to their partners learned more through collaboration than those not similar. Mowery et al. (1998) showed that the technological overlap between partners is greater after collaboration than beforehand. The partners in collaboration don’t necessarily learn equally, however. Kumar and Nti (1998) showed that some organizations may learn more than their partners do from the same R&D collaboration (differential learning) as a result of the interaction between firm-specific learning capacity and the pattern of interaction between them. The interaction may either compound or be canceled out when we focus on the pairs of collaborating organizations rather than on individual organizations. In other words, it is of interest to examine the following closely related questions: (1) who learns more (one-way knowledge transfer) and (2) which pair of firms learns more (knowledge exchange).
This study uses two indices of the citation rate, crij, and the cross citation rate, xcrij to
address the questions (Mowery et al, 1996, 1998). The first index, citation rate, crij, measures
organization i’s technological overlap with organization j in the network. It captures the relative importance of organization j’s patents in organization i’s technology portfolio. crij is
defined as:
1 The details and background of the legislations is found in Vonorats (1997), Link et al. (2002) and Combs and Link (2003).
crij = numcij / ttlci,
where numcij and ttlci are the number of citations to organization j’s patents in organization i’s
patents and the total citations in organization i’s patents, respectively. A higher value indicates that organization i is familiar with organization j in terms of technology.
The second index, cross citation rate, xcrij, measures the mutual technological overlap for
a pair of organizations (i and j). It captures the mutual importance of organization j’s patents in organization i’s technology portfolio and vice versa. xcrij is defined as:
xcrij = crij + crji.
A higher value indicates a larger degree of technological overlap between organizations i and j. The changes in these indices,
¢crij = crijpost – crijpre
and
¢xcrij = xcrijpost – xcrijpre
between pre- and post-participation in networks are used as the proxies of knowledge transfer and knowledge exchange between pre- and post-participation, respectively. Here crijpre and
crijpost refer to the citation rate in pre- and post-participation, respectively, for example. A
positive value of ¢crij indicates that organization i learn from the network. In a similar vein, a
positive value of ¢xcrij indicates that the pair of organizations i and j learn from the network.
3.3 Financial Data
The Compustat (North America) Database from Standard & Poor’s is used to obtain the firm-specific financial information of North American firms, some of which are missing in the database. King et al. (2000, 2001) argued that an analysis without firms with missing values induces biases in analysis and recommended that researchers impute missing data. This study applies the Amelia program for missing data to be imputed (Honaker et al., 2000) and uses a Stata subroutine, Clarify to analyze such imputed data with Stata (Tomez et al., 2001).
3.4 Sample 3.4.1 Industries
This study uses 3-digit-level U.S. Standard Industrial Classification (SIC) codes that are assigned to RJVs and technology alliances to identify industries. Specifically, this study chose Instruments (SIC 382) and Industrial Machinery (SIC 354, 355 and 356) such as Mark I industries, Automobiles (SIC 371), and Plastics (SIC 282) as Mark II industries for analysis.
3.4.2 Analysis Period
The analysis is limited to the two-year window of 1994-1995 for the following reasons. First, a wider window may increase the risk of organizational exposure to multiple R&D
collaborations, which may make it difficult to measure the knowledge transfer through individual collaborations. Second, it is necessary to restrict the period to as few years as possible to reduce the impact of overall trends in patenting and citation behavior (Mowery et al., 1996). Third, the formation of both technology alliances and research joint ventures showed a peak in 1995.
Pre-participation citation rate, crijpre, and cross-citation rate, xcrijpre, are calculated based
on all patents applied for after January 1989 and granted by December 1993 (five years). Post-participation citation rate, crijpost, and cross-citation rate, xcrijpost, are calculated based on
all patents applied for after January 1996 and granted by December 2000 (five years).
3.4.3 Sample Size
The resulting sample results in 101 technology alliances among 81 firms and 45 research joint ventures (RJVs) that among 88 firms. Together they produce 1,390 directional combinations (combinations with direction considered) that are used in the analysis of one-way knowledge transfer. They translate into 695 unique combinations (combinations without direction) used in the analysis of knowledge exchange, all of which are considered in the 130 uniquely identified firms.
An additional 54 firms, which are all of the available organizations that had not participated in networks in 1994 or 1995, are chosen from the pool of organizations, from which 2,862 directional combinations (which translates into 1,431 nondirectional combinations) are created and included as a control group in the analysis as well (Mowery et al., 1996). In total, 4,252 directional combinations for the analysis of knowledge transfer, which is equivalent to 2,126 nondirectional combinations for the analysis of knowledge exchange, are used in the analysis.
4. Analysis
4.1 Dependent Variables
Change in cross-citation rate between pre-/post-participation, ¢xcrij: Change in
cross-citation rate between pre- and post-participation in networks for the cross-citations made between organizations i and j (%).
4.2 Independent Variables
RJV (dummy): RJV is set equal to 1 if the link between organizations i and j belongs to the
RJV network, and 0 otherwise. The variable is used to measure the influence of the RJV network on the level of knowledge exchange between organizations i and j. A positive sign for RJV is expected.
technology alliance network, and 0 otherwise. The variable is used to measure the influence of the technology alliance network on the level of knowledge exchange between organizations i and j. A positive sign for TA is expected.
Mark I (dummy): Mark I is set equal to 1 if the link between organizations i and j belongs to
networks in Mark I industries, and 0 otherwise. The variable is used to measure the influence of Mark I industries on the level of knowledge exchange between organizations i and j. A positive sign for Mark I is expected.
Mark II (dummy): Mark II is set equal to 1 if the link between organizations i and j belongs
to networks in Mark II industries, and 0 otherwise. The variable is used to measure the influence of Mark II industries on the level of knowledge exchange between organizations i and j. A positive sign for Mark II is expected.
Network (dummy): In addition to the above four dummy variables, the dummy variable
Network is created and set equal to 1 if organizations i and j actually collaborate and thus there exist a link between them, regardless of the context, and 0 otherwise. The variable represents the overall learning effect of network. A positive sign for Network is expected.
Multi. Alliances (dummy): Some links appear in both the RJV network and the technology
alliance network. The dummy variable Multi. Alliances is set equal to 1 if the pair of organizations i and j appears twice or more in networks, and 0 otherwise. A negative sign for Multi. Alliances is expected.
Pre-participation cross-citation rate, xcrijpre: Cross citation rate between organizations i and
j (%) before participation in the network. A firm familiar with the partners’ technology may learn more than those not familiar with it (Mowery et al., 1996). However, this only applies to a certain level; a firm doesn’t learn much from a partner if it already knows a great deal about its partner’s technology (inverted U-shape effect). To measure the effect, the square term of the pre-participation cross-citation rate, (xcrijpre)2, is included in the analysis. A positive sign for xcrijpre and a negative sign
for (xcrijpre)2 are expected.
Experience: Experience is defined as the sum of organizations i and j’s experience with
regard to participation in the network for the previous five years (1989-1993). Firms with rich experience in networking have acquired know-how and skills to manage networking and learn more from them. A positive sign for Experience is therefore expected.
Trust: Trust is defined as the number of appearance of organizations i and j throughout the
previous five years (1989-1993). This study distinguishes between Trust and Experience. Trust refers to the measurement of the familiarity with a specific partner. Experience is, on the other hand, a measurement of the know-how and skills in
networking in general. Trust, which is increased through previous interaction between partners, leads to a mutual understanding. Too much familiarity with a partner would diminish the marginal benefits (inverted U-shape effect) of the relationship. A positive sign for Trust and a negative sign for its square term, Trust2, are expected.
Structural holes: Structural holes is defined as a negative value of the sum of organizations i
and j’s constraint in the network throughout the previous five years (1989-1993) (Soda et al., 2004). When we focus on a link between two nodes, the constraint measures the extent to which all of a node’s neighbors are directly or indirectly invested in a relationship with another node. A network concentrated in one contact (node) means fewer structural holes (Burt, 1992). The higher a node’s constraint, the farther away it is positioned from structural holes. A negative sign for Structural holes is expected.
4.3 Control Variables
Following are four sets of control variables that are included in the analysis.
Log(R&Di): Log(R&Di) is defined as the natural logarithm of organization i’s R&D
expenditures (in million dollars) in 1995. Firms need to possess absorptive capacity to recognize the value of new external knowledge, assimilate it, and apply it to commercial ends (Cohen and Levinthal, 1989, 1990). Internal R&D activities are one way to increase the capacity. A positive sign for Log(R&Di) is expected.
Log(R&Dj): Log(R&Dj) is defined as the natural logarithm of organization j’s R&D
expenditures (in million dollars) in 1995. A positive sign for Log(R&Dj) is expected. Log(Salesi): Log(Salesi) is defined as the natural logarithm of organization i’s net sales (in
million dollars) in 1995. It is a proxy for the size of organization i. The variable controls for unobservable size effects, including its financial capability. A positive sign for Log(Salesi) is expected.
Log(Salesj): Log(Salesj) is defined as the natural logarithm of organization j’s net sales (in
million dollars) in 1995. A positive sign for Log(Salesj) is expected.
Same country (dummy): Same country is set equal to 1 if organizations i and j are from the
same country, and 0 otherwise. Differences in culture, language, institutional environments, etc. often become a barrier to smooth communication between two organizations, resulting in less knowledge transfer. A positive sign for Same country is expected.
Same SIC (dummy): Same SIC is set equal to 1 if organizations i and j share the same 4-digit
SIC, and 0 otherwise. Firms in the same industry may possess similar technology profiles due to familiarity with shared market, processes, or products, leading to greater knowledge transfer, including unexpected knowledge transfer (knowledge leak) to the partners. However, such firms try to minimize the risk of knowledge
transfer to the partners, because they are competitors in same market. A sign for Same SIC is ambiguous.
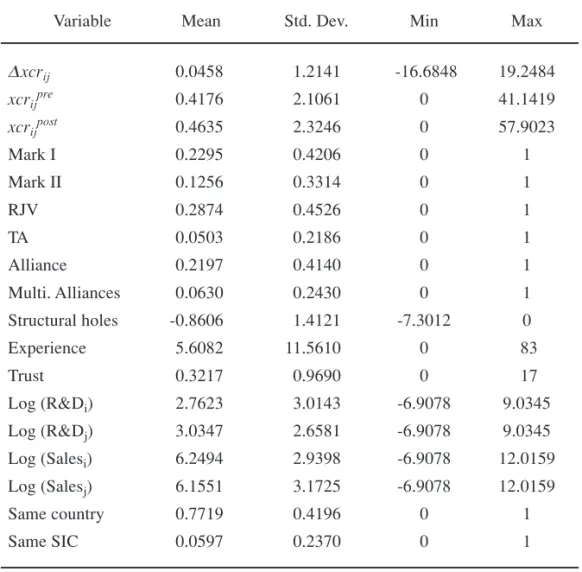
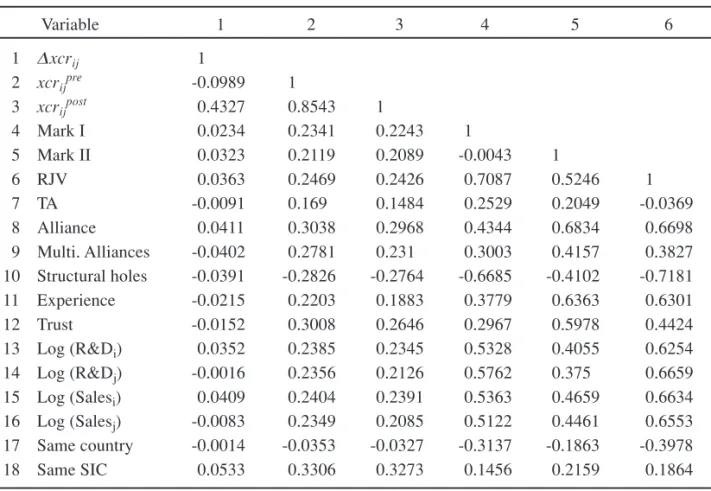
Tables 1-4 provide a description of the sample. Table 1 presents descriptive statistics for each variable. Table 2 provides the correlation matrix. The values of R&D expenditures and net sales reflect the pooled five dataset with missing values imputed using Amelia. Tables 3 and 4 provide the distribution of nondirectional combinations based on alliance and industry, respectively.
Variable Mean Std. Dev. Min Max
¢xcrij 0.0458 1.2141 -16.6848 19.2484 xcrijpre 0.4176 2.1061 0 41.1419 xcrijpost 0.4635 2.3246 0 57.9023 Mark I 0.2295 0.4206 0 1 Mark II 0.1256 0.3314 0 1 RJV 0.2874 0.4526 0 1 TA 0.0503 0.2186 0 1 Alliance 0.2197 0.4140 0 1 Multi. Alliances 0.0630 0.2430 0 1 Structural holes -0.8606 1.4121 -7.3012 0 Experience 5.6082 11.5610 0 83 Trust 0.3217 0.9690 0 17 Log (R&Di) 2.7623 3.0143 -6.9078 9.0345 Log (R&Dj) 3.0347 2.6581 -6.9078 9.0345 Log (Salesi) 6.2494 2.9398 -6.9078 12.0159 Log (Salesj) 6.1551 3.1725 -6.9078 12.0159 Same country 0.7719 0.4196 0 1 Same SIC 0.0597 0.2370 0 1
xcr: Cross citation rate.
Variable 1 2 3 4 5 6 1 ¢xcrij 1 2 xcrijpre -0.0989 1 3 xcrijpost 0.4327 0.8543 1 4 Mark I 0.0234 0.2341 0.2243 1 5 Mark II 0.0323 0.2119 0.2089 -0.0043 1 6 RJV 0.0363 0.2469 0.2426 0.7087 0.5246 1 7 TA -0.0091 0.169 0.1484 0.2529 0.2049 -0.0369 8 Alliance 0.0411 0.3038 0.2968 0.4344 0.6834 0.6698 9 Multi. Alliances -0.0402 0.2781 0.231 0.3003 0.4157 0.3827 10 Structural holes -0.0391 -0.2826 -0.2764 -0.6685 -0.4102 -0.7181 11 Experience -0.0215 0.2203 0.1883 0.3779 0.6363 0.6301 12 Trust -0.0152 0.3008 0.2646 0.2967 0.5978 0.4424 13 Log (R&Di) 0.0352 0.2385 0.2345 0.5328 0.4055 0.6254 14 Log (R&Dj) -0.0016 0.2356 0.2126 0.5762 0.375 0.6659 15 Log (Salesi) 0.0409 0.2404 0.2391 0.5363 0.4659 0.6634 16 Log (Salesj) -0.0083 0.2349 0.2085 0.5122 0.4461 0.6553 17 Same country -0.0014 -0.0353 -0.0327 -0.3137 -0.1863 -0.3978 18 Same SIC 0.0533 0.3306 0.3273 0.1456 0.2159 0.1864 Variable 7 8 9 10 11 12 7 TA 1 8 Alliance 0.3352 1 9 Multi. Alliances 0.1439 0.4888 1 10 Structural holes -0.2896 -0.5814 -0.3513 1 11 Experience 0.3022 0.6076 0.4039 -0.6736 1 12 Trust 0.3232 0.6071 0.623 -0.4024 0.5703 1 13 Log (R&Di) 0.287 0.5886 0.3128 -0.5885 0.5869 0.3975 14 Log (R&Dj) 0.2426 0.5543 0.2858 -0.6339 0.5753 0.3612 15 Log (Salesi) 0.2611 0.5887 0.3519 -0.6391 0.6257 0.4284 16 Log (Salesj) 0.21 0.5554 0.3203 -0.6169 0.5701 0.3889 17 Same country -0.0902 -0.2937 -0.1404 0.3047 -0.3078 -0.1689 18 Same SIC 0.1145 0.2641 0.3511 -0.099 0.1842 0.4079
Variable 13 14 15 16 17 18 13 Log (R&Di) 1 14 Log (R&Dj) 0.5017 1 15 Log (Salesi) 0.6798 0.5107 1 16 Log (Salesj) 0.4853 0.7386 0.5025 1 17 Same country -0.2877 -0.3231 -0.4007 -0.3762 1 18 Same SIC 0.1838 0.1555 0.1649 0.156 -0.0758 1 xcr: Cross citation rate.
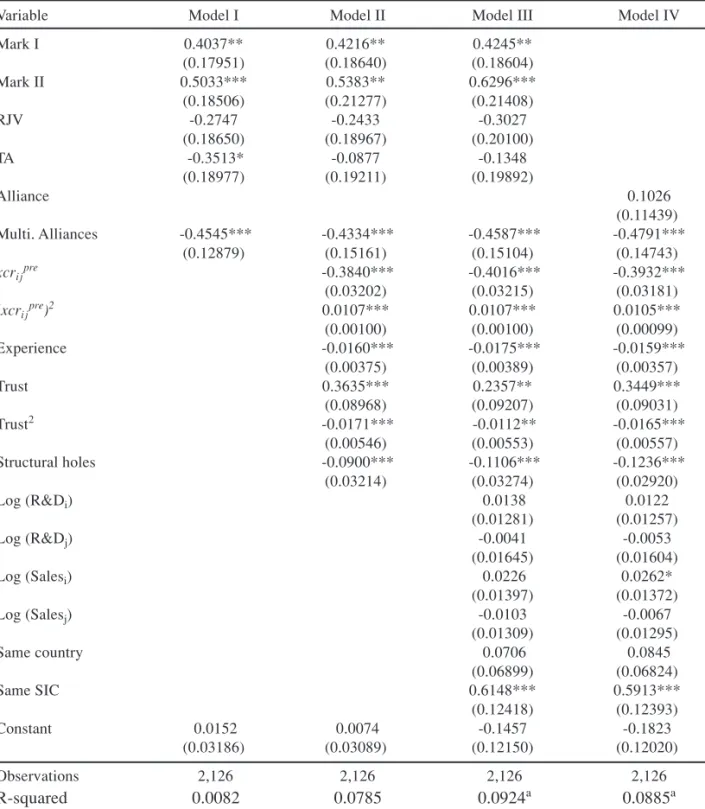
4.4 Estimation Results
This study uses the ordinary least squares method for model estimation with Stata. Table 5 presents the estimation results; using four models with different sets of explanatory variables. Model I uses only the main network variables. Model II adds the remaining set of network variables. Model III is a complete model and includes the variables to control for firm characteristics. In Model IV, the dummy variable Network replaces the four major network variables to measure the overall learning effect of the network. No signs reverse across
Table 2. (Continued )
Table 3. Distribution of Undirectional Combinations by Alliance
Alliance non-TA TA Total non-RJV 1,431a 84 1,515 RJV 588 23 611 Total 2,019 107 2,126 TA: Technology Alliance,
a. Control group (cf. Section 3.4).
Table 4. Distribution of Undirectional Combinations by Industry
Technological regime non-Mark II Mark II Total non-Mark I 1,431a 207 1,638
Mark I 428 60 488
Total 1,859 267 2,126 a. Control group (cf. Section 3.4).
models, and the size of the coefficients remains relatively stable (except RJV and TA).
The estimation results presented in Table 5 are the adjusted averages of the analysis of five datasets, in which the missing R&D expenditures and net sales values are imputed using Amelia and then are analyzed with a Stata subroutine, Clarify. Clarify doesn’t calculate the R-squared value. Instead, the average of five R-R-squared values from five datasets is presented. Only the estimation results for the analysis of knowledge exchange are presented, as most of the results of the analysis depict one-way knowledge transfer.
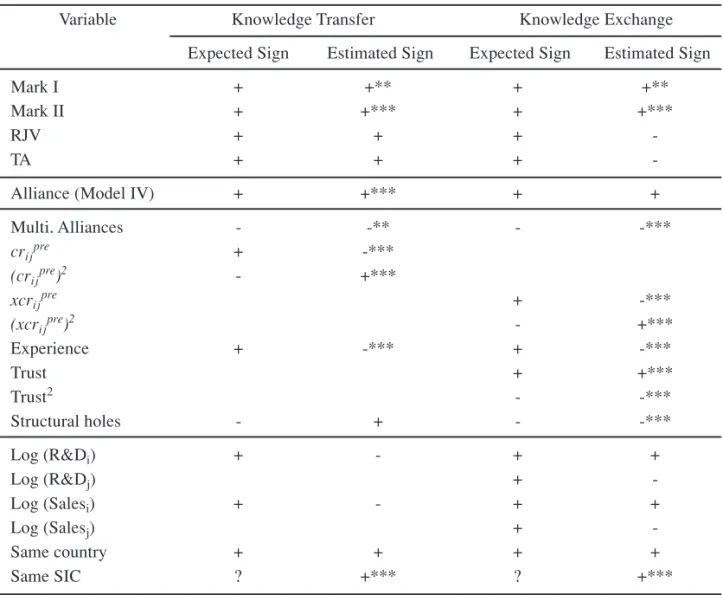
Table 6 shows the juxtapose sign and significance of the coefficients in Table 5, with the expectations.2 In Table 6, the column under the label “Knowledge Exchange” summarizes the estimation results for the complete Model III. The variable, Network, refers to Model IV and measures the overall learning effect of the network.
Organizations in alliance networks learn together. In Model IV, the coefficient for Network is positive although insignificant. However, the level of learning effects differs among networks. The coefficients for RJV and TA are insignificant and negative, not supporting Hypothesis 2, while TA has less negative influence on knowledge exchange than RJV. The coefficient for Mark I is significant and positive. The coefficient for Mark II is also significant and positive, and it is greater than the coefficient for Mark I, supporting Hypothesis 1. In sum, organizations in the Mark II industries network learn together more than do those in Mark I network industries. Industries influence knowledge exchange. The influence of network type is negative, however, although weak. The coefficient for Multi. Alliances is significant and negative, supporting Hypothesis 3. The coefficient for Structural holes is significant and negative, supporting Hypothesis 4. The coefficient for pre-participation cross-citation rate, xcrijpre, is highly significant and negative, and the coefficient for its square term, (xcrijpre)2 is
significant and positive, not showing the expected inverted U-shaped effect but rather the plain U-shape effect. However, if the value range of pre-participation cross-citation rate xcrijpre is taken into account (table 2), then the result actually shows that the organizations in
this study learn more when they are less similar to their partners in terms of technological profile. The coefficient for Experience is significant and negative. This result doesn’t agree with the finding of previous studies such as Powell et al., (1996). The coefficient for Trust is highly significant and positive, and the coefficient for its square term, Trust2, is significant and negative. In contrast to the case of the pre-participation cross-citation rate, xcrijpre, these
results agree with the finding of previous studies, either.
The coefficients for Log(R&Di), Log(R&Dj), Log(Salesi), and Log(Salesj) are basically
insignificant, and their signs are mixed. The coefficient for Same country is insignificant but positive. Finally, the coefficient for Same SIC is highly significant and positive, which 2 The column under the label “Knowledge Transfer” in table 6 shows the juxtaposed results of the
suggests that familiarity with the shared market facilitates the knowledge exchange.
Variable Model I Model II Model III Model IV
Mark I 0.4037** 0.4216** 0.4245** (0.17951) (0.18640) (0.18604) Mark II 0.5033*** 0.5383** 0.6296*** (0.18506) (0.21277) (0.21408) RJV -0.2747 -0.2433 -0.3027 (0.18650) (0.18967) (0.20100) TA -0.3513* -0.0877 -0.1348 (0.18977) (0.19211) (0.19892) Alliance 0.1026 (0.11439) Multi. Alliances -0.4545*** -0.4334*** -0.4587*** -0.4791*** (0.12879) (0.15161) (0.15104) (0.14743) xcrijpre -0.3840*** -0.4016*** -0.3932*** (0.03202) (0.03215) (0.03181) (xcrijpre)2 0.0107*** 0.0107*** 0.0105*** (0.00100) (0.00100) (0.00099) Experience -0.0160*** -0.0175*** -0.0159*** (0.00375) (0.00389) (0.00357) Trust 0.3635*** 0.2357** 0.3449*** (0.08968) (0.09207) (0.09031) Trust2 -0.0171*** -0.0112** -0.0165*** (0.00546) (0.00553) (0.00557) Structural holes -0.0900*** -0.1106*** -0.1236*** (0.03214) (0.03274) (0.02920) Log (R&Di) 0.0138 0.0122 (0.01281) (0.01257) Log (R&Dj) -0.0041 -0.0053 (0.01645) (0.01604) Log (Salesi) 0.0226 0.0262* (0.01397) (0.01372) Log (Salesj) -0.0103 -0.0067 (0.01309) (0.01295) Same country 0.0706 0.0845 (0.06899) (0.06824) Same SIC 0.6148*** 0.5913*** (0.12418) (0.12393) Constant 0.0152 0.0074 -0.1457 -0.1823 (0.03186) (0.03089) (0.12150) (0.12020) Observations 2,126 2,126 2,126 2,126 R-squared 0.0082 0.0785 0.0924a 0.0885a
Standard errors in parentheses. *: p < 0.1, **: p < 0.05, ***: p < 0.01.
xcr: Cross Citation rate. a. Proxy value
Table 6. Expected and Estimated Results (Model III)
Variable Knowledge Transfer Knowledge Exchange Expected Sign Estimated Sign Expected Sign Estimated Sign
Mark I + +** + +**
Mark II + +*** + +***
RJV + + +
-TA + + +
-Alliance (Model IV) + +*** + + Multi. Alliances - -** - -*** crijpre + -*** (crijpre)2 - +*** xcrijpre + -*** (xcrijpre)2 - +*** Experience + -*** + -*** Trust + +*** Trust2 - -*** Structural holes - + - -*** Log (R&Di) + - + + Log (R&Dj) + -Log (Salesi) + - + + Log (Salesj) + -Same country + + + + Same SIC ? +*** ? +*** *: p < 0.1, **: p < 0.05, ***: p < 0.01.
cr: Cross Citation rate. xcr: Cross Citation rate.
5. Discussion
The estimation results support most but not all hypotheses. First, and most importantly, organizations in networks learn from each other. However, the level of knowledge transfer isn’t necessarily equal between networks. Organizations in Mark II industries learn more than those in Mark I, which suggests that the network in Mark II industries, where knowledge is cumulative and difficult to learn, provides a more effective conduit of knowledge flow than that of Mark I industries, where organizations aren’t required to make such efforts to attain others’ level of knowledge. The finding suggests to R&D managers that organizations are likely to gain more from participation in the networks in Mark II industries than from
participation in Mark I industries-although it is also true that more resources are required to maintain the networks in Mark II industries than to maintain those in Mark I industries. R&D managers need to be aware of maintaining the balance between the resources invested in and the benefits from networks.
The finding implies that it is important to help facilitate the formation of networks, especially in Mark II industries, from a public policy perspective. In fact, in the United States, the necessity of collaboration has already been addressed by the National Cooperative Research Act of 1984 (NCRA) and its amendment, the National Cooperative Research and Production Act of 1993 (NCRPA) more than twenty years ago. One rationale behind the NCRA and alliance in general is the reduction of duplicated R&D investments through the research joint ventures (RJVs) and the resulting knowledge sharing among participants. However, the NCRA may not necessarily fulfill the intended purpose. The result also suggests, though weakly, that the RJV network is less effective in knowledge transfer than the technology alliance network. There are two possible explanations for this. One could be that organizations in the RJV network behave cautiously to avoid knowledge leaks to the partners, which may result in less knowledge transfer in the RJV network. Another explanation could be that the knowledge in the RJV network is tacit in nature and not represented well by patents, which may result in less knowledge transfer observed.
Second, organizations learn less from the subsequent participation in networks than from the first. Additionally, past experience in networking in general doesn’t help organizations learn. Rather organizations learn more from the partners with whom they have repeatedly collaborated and thus nurture a mutual trust than from those with whom they collaborate for the first time. This suggests to R&D managers that it is important to maintain stable links with specific partners rather than to change the collaboration partners. Stable links could have negative effects too, however. Organizations may become used to their stable partners and view them as a reliable knowledge source, which can create an unhealthy dependency. Stable partners could become a pitfall for organizations, in that the organizations may become locked in with technologically suboptimal partners or networks. Therefore, R&D managers should keep in mind that the efforts to maintain a collaborative relationship with specific partners could eventually result in the stabilization of the network in terms of participants and interaction, which may eventually decrease the chance to access new and innovative knowledge or technologies. R&D managers are required to maintain the right mixture of existing and new collaborations and links with other organizations to maximize the effectiveness of collaboration and networking.
Third, the result shows that the organizations positioned at structural holes, which are supposed to have the information advantage (Burt, 1992), actually learn less than those positioned elsewhere. In short, structural holes are choking points of knowledge flow in
networks. From a public policy perspective, this implies a necessity to create an environment that encourages organizations to collaborate directly with various partners rather than repeatedly with specific partners. This holds true even though it seems to contradict the interest of firms to maintain stable links with specific partners to learn from the network. The opposite implications highlight a tension between the interests of private firms and public policy.
Fourth, organizations learn more if they are less similar to partners in terms of technological proximity. This finding contradicts the expected inverted U-shaped effect of technology proximity with regard to the knowledge transfer (Mowery et al., 1998; Song et al., 2003). Market proximity, or the familiarity with shared market or products, on the other hand, facilitates the knowledge transfer in networks. The knowledge about the market or products plays a more important role in knowledge transfer than does technological knowledge.
This study has certain limitations. For example, the patent-citation-based indices may not be effective in some cases. Consider a situation in which organizations are active in collaboration and thus have many opportunities to learn from a variety of partners, or a situation in which their technological portfolios are very broad. If they actually learn from the partners, the indices may undervalue the knowledge transfer from individual partners, because the contribution from each partner is buried under a bundle of contributions. Among the limitations stemming from the data, the most acute one would be the under-representation of small firms in the analysis. Considering that small firms are more likely to develop new technology after a technological discontinuity (King et al., 2003), and taking into account their important role in Mark I industries, it is better to include them in the analysis. However, the SDC Platinum under-represents small firms (Anand and Khanna, 2000). Compustat generally provides financial information of the larger publicly-traded firms as well.
This study has measured the knowledge transfer between organizations that are directly connected with one another in networks. The knowledge transfer isn’t necessarily limited to directly connected organizations, however. Knowledge could spill over in a network, which could lead to an extension of this study. It is theoretically conceivable that the knowledge could spill over in the network and that the spillovers could be concentrated around the origin. For example, the regional economics literature has found that knowledge spillovers are geographically localized and concentrated in regional clusters or networks (Jaffe et al., 1993; Saxenian, 1994). Similar patterns might be observed for the knowledge spillover in networks. However, no appropriate empirical methodologies to help examine the knowledge spillovers currently exist in networks. Although this study provides some insight into the relationship between network and knowledge transfer, more research is necessary for better understanding of the dynamics underlying the networks.
References
Ahuja, G. (2000). Collaboration networks, structural holes, and innovation: A longitudinal study. Administrative Science Quarterly, 45(3):425–455.
Anand, B. N. and Khanna, T. (2000). Do firms learn to create value? the case of alliances. Strategic Management Journal, 21(3):295–315.
Arrow, K. (1962). Economic welfare and the allocation of resources for invention. In Nelson, R. R., editor, The Rate and Direction of Inventive Activity, pp. 609–625. Princeton University Press.
Baum, J. A. C., Calabrese, T., and Silverman, B. S. (2000). Don’t go it alone: alliance network composition and startups’ performance in Canadian biotechnology. Strategic Management Journal, 21(3):267–294. Borgatti, S. P. and Foster, P. C. (2003). The network paradigm in organizational research: A review and
typology. Journal of Management, 29(6):991–1013.
Brass, D. J., Galaskiewicz, J., Greve, H. R., and Tsai, W. (2004). Taking stock of networks and organizations: A multilevel perspective. Academy of Management Journal, 47(6):795–817.
Breschi, S., Malerba, F., and Orsenigo, L. (2000). Technological regimes and Schumpeterian patterns of innovation. The Economic Journal, pp. 388–410.
Burt, R. S. (1992). Structural Holes: The Social Structure of Competition. Harvard University Press, Cambridge, MA.
Center for International Science and Technology Policy, The George Washingtoun University (1999). NCRA-RJV database. Retrieved September 20, 2001.
Cohen, W. M. and Levinthal, D. A. (1989). Innovation and learning: the two faces of R&D. The Economic Journal, 99(397):569–596.
Cohen, W. M. and Levinthal, D. A. (1990). Absorptive capacity: A new perspective on learning and innovation. Administrative Science Quarterly, 35(1):128–152.
Coleman, J. S. (1988). Social capital in the creation of human capital. The American Journal of Sociology, 94(Supplement):S95–S120.
Combs, K. L. and Link, A. N. (2003). Innovation policy in search of an economic foundation: The case of research partnerships in the united states. Technology Analysis and Strategic Management, 15(2):177– 187.
Dhanaraj, C., Lyles, M. A., Steensma, H. K., and Tihanyi, L. (2004). Managing tacit and explicit knowledge transfer in IVJs: the role of relational embeddedness and the impact on performance. Journal of International Business Studies, 35(5):428–442.
Granovetter, M. S. (1973). The strength of weak ties. The American Journal of Sociology, 78(6):1360–1380. Gulati, R. (1995). Does familiarity breed trust? The implications of repeated ties for contractual choice in
alliances. Academy of Management Journal, 38(1):85–112.
networks. Strategic Management Journal, 21(3):203–215.
Gulati, R. and Singh, H. (1998). The architecture of cooperation: Managing coordination costs and appropriation concerns in strategic alliances. Administrative Science Quarterly, 43(4):761–814.
Hall, B. H. (2004). The patent name-matching project. University of California, Berkely, Berkeley, CA. Hansen, M. T. (1999). The search-transfer problem: The role of weak ties in sharing knowledge sharing
across organization subunits. Administrative Science Quarterly, 44(1):82–111.
Honaker, J., Joseph, A., King, G., and Scheve, K. (2000). Amelia: A program for missing data (Windows version). Harvard University, Cambridge, MA.
Inkpen, A. C. and Tsang, E. W. K. (2005). Social capital, networks, and knowledge transfer. Academy of Management Review, 30(1):146–165.
Jaffe, A. B., Trajtenberg, M., and Henderson, R. (1993). Geographic localization of knowledge spillovers as evidenced by patent citations. The Quarterly Journal of Economics, 108(3):577–598.
King, D. R., Covin, J. G., and Hagarty, W. H. (2003). Complementary resources and the exploitation of technological innovations. Journal of Management, 29(4):589–606.
King, G., Honaker, J., Joseph, A., and Scheve, K. (2001). Analyzing incomplete political science data: An alternative algorithm for multiple imputation. American Political Science Review, 95(1):49–69.
King, G., Tomz, M., and Wittenberg, J. (2000). Making the most of statistical analyses: Improving interpretation and presentation. American Journal of Political Science, 44(2):341–355.
Kogut, B. (2000). The network as knowledge: Generative rules and the emergence of structure. Strategic Management Journal, 21(3):405–425.
Kumar, R. and Nti, K. O. (1998). Differential learning and interaction in alliance dynamics: A process and outcome discrepancy model. Organization Science, 9(3):356–367.
Larsson, R., Bengtsson, L., Henriksson, K., and Sparks, J. (1998). The interorganizational learning dilemma: Collective knowledge development in strategic alliances. Organization Science, 9(3):285–305. Levin, R. C., Klevorick, A. K., Nelson, R. R., and Winter, S. G. (1987). Appropriating the returns from
industrial research and development. Brooking Papers on Economic Activity, 3(0):783–820.
Link, A. N., Paton, D., and Siegel, D. S. (2002). An analysis of policy initiatives to promote strategic research partnerships. Research Policy, 31(8–9):1459–1466.
Malerba, F. (2002). Sectoral systems of innovation and production. Research Policy, pp. 247–264.
Malerba, F. and Orsenigo, L. (1996). Schumpeterian patterns of innovation are technology-specific. Research Policy, 25(3):451–478.
March, J. G. (1991). Exploration and exploitation in organizational learning. Organization Science, 2(1):71–87.
McEvily, B. and Zaheer, A. (1999). Bridging ties: A source of firm heterogeneity in competitive capabilities. Strategic Management Journal, 20(12):1133–1156.
Mowery, D. C., Oxley, J. E., and Silverman, B. S. (1996). Strategic alliances and interfirm knowledge transfer. Strategic Management Journal, 17(Winter):77–91.
Mowery, D. C., Oxley, J. E., and Silverman, B. S. (1998). Technological overlap and interfirm cooperation: Implications for the resource-based view of the firm. Research Policy, 27(5):507–523.
Nooteboom, B. (2004). Inter-firm Collaboration, Learning and Networks: An Integrated approach. Routledge, London, UK.
Nooteboom, B. and Gilsing, V. A. (2004). Density and strength of ties in innovation networks: A competence and governance view. ERIM Report Series Research in Management ERS-2004-005-ORG, Erasmus Research Institute of Management, Erasmus Universiteit Rotterdam, Rotterdam, The Netherlands.
Okamura, K. and Vonortas, N. S. (2009). Research partners. International Journal of Technology Management, 46(3-4).
Oxley, J. E. (1997). Appropriability hazards and governmance in strategic alliances: A transaction cost approach. Journal of Law, Economics, and Organization, 13(2):387–409.
Powell,W.W., Koput, K.W., and Smith-Doerr, L. (1996). Interorganizational collaboration and the locus of innovation: networks of learning in biotechnology. Administrative Science Quarterly, 41:116–145. Reagans, R. and McEvily, B. (2003). Network structure and knowledge transfer: The effects of cohesion
and range. Administrative Science Quarterly, 48(2):240–267.
Saxenian, A. (1994). Regional Advantage: Culture and Competition in Silicon Valley and Route 128. Harvard University Press, Harvard, MA.
Sobrero, M. and Roberts, E. B. (2001). The trade-off between efficiency and learning in interorganizational relationships for product development. Management Science, 47(4):493–511. Soda, G., Usai, A., and Zaheer, A. (2004). Network memory: The influence of past and current networks on performance. Academy of Management Journal, 47(6):893–906.
Song, J., Almeida, P., and Wu, G. (2003). Learning-by-hiring: When is mobility more likely to facilitate interfirm knowledge transfer? Management Science, 49(4):351–365.
Standard & Poor’s (1999). COMPUSTAT (North America). Retrieved May 20, 2005 at the Gelman Library, The George Washington University.
Thomson Financial (2005). SDC Platinum (Joint Venturs / Strategic Alliances). Retrieved May 20, 2005 at the Center for International Science and Technology Policy, The GeorgeWashington University.
Tomez, M.,Wittenberg, J., and King, G. (2001). CLARIFY: Software for interpreting and presenting statistical results. Version 2.0. Harvard University, Cambridge, MA.
United States Office of Management and Budget (1987). Standard Industrial Classification Manual. Uzzi, B. (1996). The sources and consequences of embeddedness for the economic performance of
organizations: The network effect. American Sociological Review, pp. 674–698.
Uzzi, B. (1997). Social structure and competition in interfirm networks: The paradox of embeddedness. Administrative Science Quarterly, 42(1):35–67.
Von Tunzelmann, N. and Acha, V. (2004). Innovation in “low-tech” industries. In Fagerberg, J., Mowery, D. C., and Nelson, R. R., editors, Oxford Handbook of Innovation, pp. 407–432. Oxford University Press, Oxford, UK.
Vonortas, N. S. (1997). Research joint ventures in the US. Research Policy, 26(4–5):577–598.
Winter, S. G. (1987). Knowledge and competence as strategic assets. In Teece, D. J., editor, The Competitive Challenge: Strategies for Industrial Innovation and Renewal, pp. 159–184. Ballinger, Cambridge, MA.