The Development of the Manufacturing Sector in Indonesia*
Yukio KANEKO** and Hasudungan TAMPUBOLON***
I
International Comparison on
the Industrialization Process
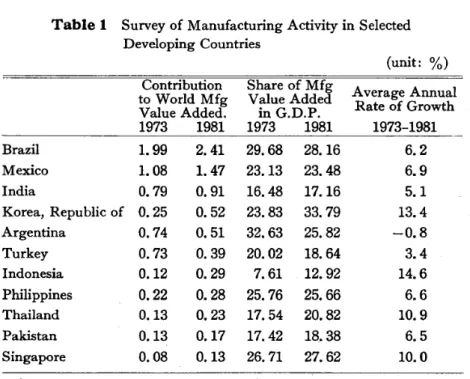
According to a publication by UNIDO [1984], in the last decade Indonesia has become one of the largest producers of manufactured products among developing countries.
With a manufacturing value added share of 0.290/0 in the world in 1981, Indonesia
was ranked seventh among developing
countries as shown in Table l.
Around a decade earlier, Indonesian
manufacturing accounted for only a 0.12°~ share of world manufacturing value added, and was ranked seventeenth. Clearly, the Indonesian manufacturing sector has ex-panded rapidly in the last decade.
The share of manufacturing value added
*
This paper is a part of the work on the quanti-tative macro economic study at the National Development Planning Agency in Indonesia (BAPPENAS) under Japanese technical as-sistance programme by Japan International Cooperation Agency (JICA). The authors greatefully acknowledge Dr. Mooy of BAPPENAS and Prof. S. Ichimura of Kyoto University who supervised the quantitative study at BAPPENAS and Mr. E. Yanagi of Hiroshima University of Economics for his computational assistance.** ~.:rtjjf(~,Hiroshima University of Economics,
37-1Gion 5-chome Asaminami-ku, Hiroshima 731-Dl,Japan
*** BAPPENAS (Badan Perencanaan Pembangu-nan N asional), Jakarta. Indonesia
In the Indonesian GDP increased from
9.60/0in 1973 to 10.80/0 in 1981 according to the Central Bureau of Statistics (BPS) of Indonesia. However, this share of manu-facturing is much smaller than those in neighboring developing countries, I.e., Philippines (25.70/0)' Thailand (20.8%) and Singapore (27.60/0) (UN Statistics). The share is even smaller than that of India
(17.7%), Turkey (18.6%) and Pakistan
(18.40/0)'
This is evidence of the relatively low level of Indonesia's industrialization stage. Some aspects of Indonesian manufacturing industrial development will be further
examined by comparison with other
ASEAN countries, using the International Input-Output Table for ASEAN countries of 1975 compiled by Institute of Developing
Economies in Japan.
1. International Comparison of Sectoral Structure
U sing an international input-output table for ASEAN countries, sectoral structure in terms of value added share for each country is shown in Table 2.
InTable 2, the mining sector of Indonesia holds a very high share compared with other countries.
The Indonesian agricultural sector also has a comparatively high share among
(unit: %)
Table 1 Survey of Manufacturing Activity in Selected Developing Countries
Source: Roepstorff, T. M. 1985. Industrial Development in Indo-nesia. Bulle#n of Indonesian Economic Studies21(April) :
facturing sector with those of other countries. The share
6.2 6.9 5.1 13.4 -0.8 3.4 14.6 6.6 10.9 6.5 10.0 1973-1981 of Indonesian agricultural sector (26.0%) ranks second to that of Philippines (26.9
%),
and is a little higher than that of Thailand (24.30/0)' However, we should
note that Philippines and Thailand have a very small
mining sector, 0.1
%
and1.5%,respectively.
On the contrary, Indonesia has large share of mining, 18.7%. IfIndonesia's pro-duction of oil and gas were very small, the share of the agricultural sector would be much larger than at present.
Similarly, the share of manufacturing would be higher though still smaller than those of Malaysia, Philippines, Thailand, and Singapore.1 )
Mining activity in Indonesia IS, as
ex-Average Annual Rate of Growth
33.
Contribution Share of Mfg to World Mfg Value Added Value Added. in G.D.P. 1973 1981 1973 1981 Brazil 1. 99 2.41 29.68 28.16 Mexico 1. 08 1.47 23.13 23.48 India 0.79 0.91 16.48 17.16 Korea, Republic of 0.25 0.52 23.83 33.79 Argentina 0.74 0.51 32.63 25.82 Turkey 0.73 0.39 20.02 18. 64 Indonesia 0.12 0.29 7.61 12.92 Philippines 0.22 0.28 25.76 25.66 Thailand 0.13 0.23 17.54 20.82 Pakistan 0.13 0.17 17.42 18.38 Singapore 0.08 0.13 26. 71 27.62
these two sectors reduce the share of manu-facturing sector in Indonesia. IfIndonesia produced little oil and gas, as do the other ASEAN countries, its manufacturing share would be much larger than the present one. Therefore, it may be misleading simply to compare the share of Indonesian
manu-Table 2 Sectoral Structure of Value Added. in Million US$, and(%)
Indonesia Malaysia Philippines Singapore Thailand
1. Agriculture 8,532 1,598 4,256 127 4,148 (26.04) (19.07) (26.93) (2.48) (24.31) 2. Mining (18.74)6,141 289 413 6 255 (3.56) (2.61) (0.12) (1. 49) 3. Manufacturing (14.51)*4, 754 (27.93)2,269 (19.93)3,064 (36.82)1,883 (22.10)3, 771 4. Others 13,342(40.72) (48.85)3,969 (51. 07)8,070 (60.58)3,098 (52.09)8,888 Total (100.00)32,769 (100.00)8,125 (100.00)15,803 (100.00)5,114 (100.00)17,062
*
This share seems high compared to the National Income Statistics, which are only around8.9% basedon current prices and11.1% based on1973 constant prices.
Note: The value added share in this table is somewhat different from that of UN Statistics mentioned above due to a different method of calculation.
plained, very high compared to other
ASEAN countries. Despite of the high
share of mining, specifically oil, in the GDP, it should be noted that the oil and gas sector's "backward linkage" is one of the lowest. (Linkage analysis will be discussed in more detail later). Low backward link-age means low incentive compared to other industries. Of course, this is not intended to belittle the contribution that oil has made to the development process of Indonesia.
2. Structual CharacterisNcs of the Manu-facturing Sector
In this section we will analyse in more detail the characteristics of the Indonesian manufacturing sector. For the shake of analysis, total output and value added of each manufacturing industry in Indonesia will be compared with those of other ASEAN countries.
Total Output
The Indonesian manufacturing sector is the largest among the five ASEAN coun-tries. As is shown in Appendix 1, in 1975
Indonesian manufacturing activities m
terms of total output were approximately double those of Singapore and Malaysia, and 1.4 times larger than that of Philippines and Thailand.
However, more than half of the Indo-nesian manufacturing output consists of
consumption goods, such as food and
textiles. Appendix 2 shows that the
Indonesian food industry has a 53.9%
1) Ifthere were no mining activities in Indonesia, the total value added of the manufacturing sector would be 18%. This share is still smaller than those of the other ASEAN countries.
share in total manufacturing, the highest figure among ASEAN countries.
In other countries the food industry does not exceed 500/0. Shares of machinery and metal products in Indonesia, on the other
hand, are the lowest among ASEAN
countries: 2.4% for machinery and 3.60/0 for metal products.
Appendix 3 shows the distribution of manufactured products among five ASEAN countries. Indonesian share of total manu-facturing sector is 29.90/0.
The Indonesian transport equipment
industry, where two thirds of input is derived from motor vehicle assembly and motor-cycle manufacturing, is conspicuously high among ASEAN countries (45.930/0).
The composition of manufacturing output in developing countries has drastically
changed between 1963 and 1975 as
a UNIDO report [1981: 51-52] points out. According to UNIDO, with the ex-ception of plastic products, all branches of light industries declined in importance in
this period. These declines were
com-pensated by gains in heavy manufacturing, especially in industrial chemicals, petrolemn, refinery, machinery and transport equip-ment. In the case of the transport equip-ment industry, the share of output in the manufacturing sector of all developing countries increased to 7.6% as a result of industrialization between 1963 and 1975. Approximately the same is true of the share of the transport equipment industries of ASEAN countries as seen in Appendix 2. It is notable that Indonesian output of transport equipment is almost half that of total ASEAN output and is 11% of its
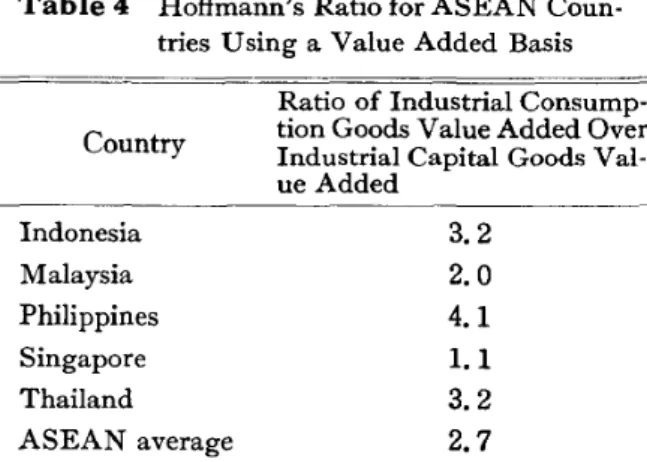
Table 4 shows Hoffmann's ratio for ASEAN countries based on Appendix 6.2 )
Hoffmann's rule may oversimplify the
2) The definition of capital goods and consumption goods industries is not clearly established. Subtotals in Appendix 6 are used for the outputs of these two industries for the shake of our analysis.
pendix1. This difference can be explained by two factors; i.e., value added ratio of each industry (Appendix 5) and output composition (Appendix 2), which differ considerably between these two countries.
Another perspective of the manufacturing sector, which also serves to reflect the level of industrialization, is gained by using the idea of value added with Hoffmann's ratio
[1958].
Hoffmann proposed to divide the manu-facturing industry into two groups, namely, consumption and capital goods. According to Hoffmann's analysis of actual data for
more than twenty countries, the
con-sumption good industry is a leading sector at the early stage of industrialization. How-ever, compared to capital goods, its share gradually diminishes as industrialization develops. Evidence of the above rule was commonly found in the industrialization process in almost every country. Hoffmann then proposed ratios to classify four stages of industrialization as follows:
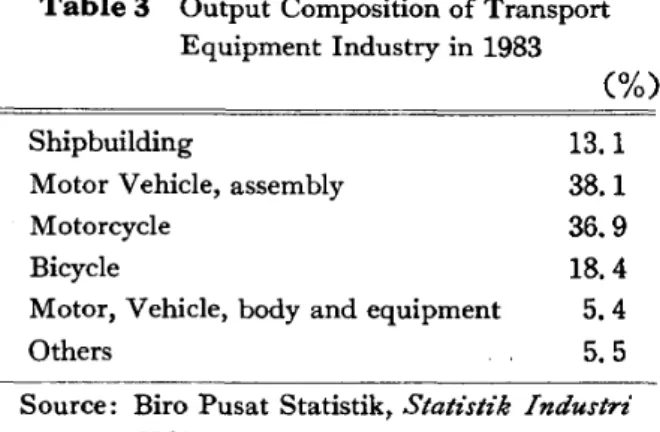
Table 3 Output Composition of Transport
Equipment Industry in 1983
(%)
Shipbuilding 13. 1
Motor Vehicle, assembly 38.1
Motorcycle 36. 9
Bicycle 18. 4
Motor, Vehicle, body and equipment 5.4
Others 5.5
Source: Biro Pusat Statistik,Statistik Industn'
1983.
total domestic manufacturing output.
Table 3 shows the output composition of the transport equipment industry in Indo-nesia.
As shown in Table 3, motor vehicle assembly and motorcycle products have
occupied two thirds of the output of
transport equipment industry in Indonesia. The food product industry in Indonesia also has an above average share (38.70/0)'
whereas other manufactured products
(12.20/0)' machinery (13.0%), petroleum and petroleum products (16.20/0) and metal products (17.0%) are in the lowest group, far below the average ASEAN sectoral composition.
Value Added
The significance of a country's manu-facturing sector can be seen in the mere size of its value added. The Indonesian manufacturing sector total value added shown in Appendix 4 is the largest figure among the five ASEAN countries.
The ratio of value added should be particularly noted. Appendix 4 shows that Indonesian value added is 2.1 times larger than that of Malaysia, whereas Indonesian total output is 2.7 times larger than that of Malaysia, as we also observed in
Ap-Stage of Industrial-ization First stage Second stage Third stage Fourth stage
Ratio of Industrial Consumption Goods Value Added to Industrial
Capital Goods Value Added 5-6
2.5-3.5 1-2 Less 1
Source: Institute of Developing Economies [1982]
Table 4 Hoffmann's Ratio for ASEAN Coun-tries Using a Value Added Basis
II Industrial Development in
Indonesia
structure of the economy. However, it
may be still useful for an overvIew of
the development stage. According to
Hoffmann's rule, Philippines is in the first stage of industrialization. Indonesia and Thailand are in the second stage, while Malaysia and Singapore are found in the third stage.
bution of the textile industry in the early 1970's also declined slightly by 1980.
On the contrary, chemicals, wood
prod-ucts, transport equipment, other
non-metallic mineral products, electrical ma-chinery, rubber products, fabricated metal, iron and steel products exhibited a high growth rate, and thus, gained higher shares of total manufacturing value added.
Domestic markets for most of the
consumer goods were saturated after 1975. Consistent with the trend in NICS, es-pecially after 1978/1979 with ample foreign exchange earnings from the oil boom, industrial development took place more in upstream basic industries, machinery and component manufacturing industries pro-ducing spare parts for automobiles, motor-cycles and airplanes.
Thus, the pattern of structural change
within manufacturing sectors entailed
a gradual shift from consumer goods to intermediate and capital goods. The share of consumer goods in total manufacturing declined from 80.8% in 1971 to 47.6% in 1980. Shares of intermediate and capital goods sectors dramatically increased from 13.1
%
in 1971 to 35.50/0 in 1981 and from 6.1%
in 1971 to 16.90/0 in 1981, respectively. The main sources of industrial growth were increases in domestic demand and import substitution activities which had taken place during this period. With the de-velopment of the consumer goods industry, markets for intermediate and capital goods grew. That situation in combination with the environment or investment climate in the period fostered the development of intermediate and capital goods industries3.2 2.0 4.1 1.1 3.2 2.7
Ratio of Industrial Consump-tion Goods Value Added Over Industrial Capital Goods Val-ue Added Indonesia Malaysia Philippines Singapore Thailand ASEAN average Country
1. Value Added~ Employment and In-dustrial Growth
The Structure of Value Added
Industrial growth during the 1970's
diversified the structure of the manufactur-ing sector. Sectors such as iron and steel, electric machinery, and fabricated metal products, for example, which were relatively capital intensive, had a very high growth rate as seen in Table 5. The sectors which were related to the agriculture sector, i.e.,
food products, beverages and tobacco
accounted for 63.80/0 of total manufacturing value added in 1971, and then declined to
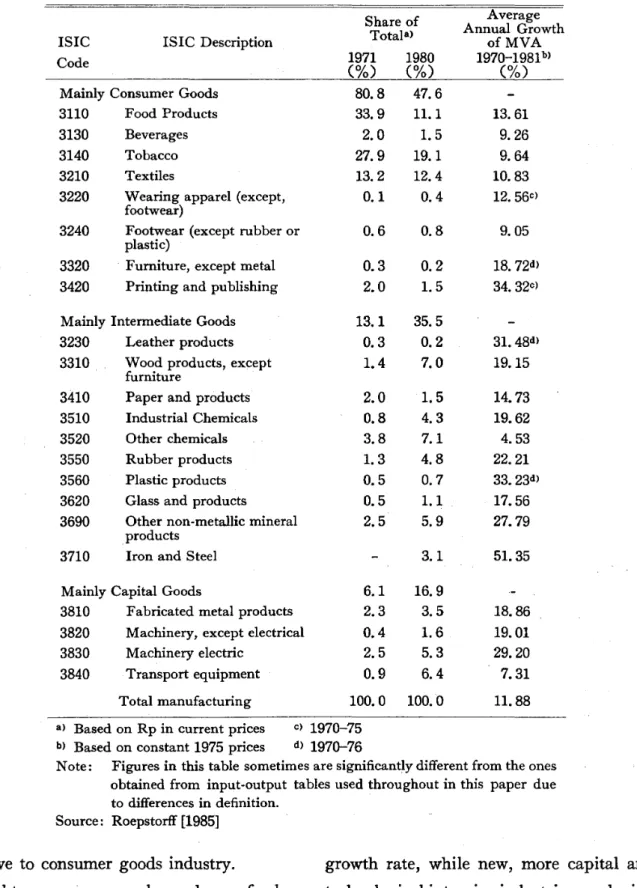
contri-Table 5 Structural Changes of Value Added in Selected Manufacturing Sectors1971 and1980
Share of Average
Totala) Annual Growth
ISIC ISIC Description ofMVA
Code 1971 1980 1970-1981b)
(%) (%) (%)
Mainly Consumer Goods 80.8 47.6
3110 Food Products 33.9 11.1 13.61
3130 Beverages 2.0 1.5 9.26
3140 Tobacco 27.9 19.1 9.64
3210 Textiles 13.2 12.4 10.83
3220 Wearing apparel (except, 0.1 0.4 12. 56C) footwear)
3240 Footwear (except rubber or 0.6 0.8 9.05
plastic)
3320 Furniture, except metal 0.3 0.2 18. 72d ) 3420 Printing and publishing 2.0 1.5 34. 32C)
Mainly Intermediate Goods 13.1 35.5
3230 Leather products 0.3 0.2 31. 48d )
3310 Wood products, except 1.4 7.0 19.15
furniture
3410 Paper and products 2.0 1.5 14.73
3510 Industrial Chemicals 0.8 4.3 19.62
3520 Other chemicals 3.8 7.1 4.53
3550 Rubber products 1.3 4.8 22.21
3560 Plastic products 0.5 0.7 33. 23d )
3620 Glass and products 0.5 1.1 17.56
3690 Other non-metallic mineral 2.5 5.9 27.79
products
3710 Iron and Steel 3.1 51.35
Mainly Capital Goods 6.1 16.9
3810 Fabricated metal products 2.3 3.5 18.86
3820 Machinery, except electrical 0.4 1.6 19.01
3830 Machinery electric 2.5 5.3 29.20
3840 Transport equipment 0.9 6.4 7.31
Total manufacturing 100.0 100.0 11.88
a) Based on Rp in current prices c) 1970-75
b) Based on constant1975 prices d) 1970-76
Note: Figures in this table sometimes are significantly different from the ones obtained from input-output tables used throughout in this paper due to differences in definition.
Source: Roepstorff[1985]
relative to consumer goods industry. Light consumer goods such as food, beverages and cigarettes showed a slower
growth rate, while new, more capital and technological intensive industries producing intennediate, durable consumer and capital
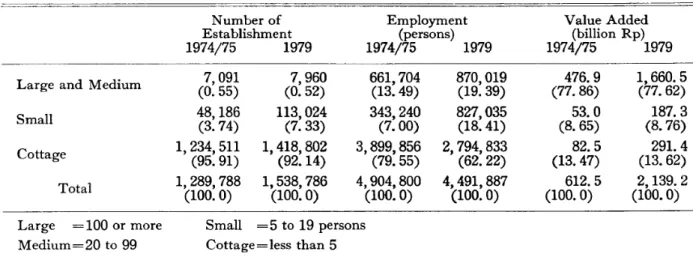
Table 6 Number of Establishment, Employment and Value Added in Manufacturing Sector Value Added (billion Rp) 1974/75 1979 Number of Employment Establishment (persons) 1974/75 1979 1974/75 1979
Large and Medium (0.55)7,091 (0.52)7,960 661,704(13.49) 870,019(19.39)
Small 48,186(3.74) 113,024(7.33) 343,240(7.00) 827,035(18.41)
Cottage 1,234,511(95.91) 1,418,802(92.14) 3,899,856(79.55) 2,794,833(62.22)
Total 1,289,788(100.0) 1,538,786(100.0) 4,904,800(100.0) 4,491,887(100.0)
Large =100 or more Small =5 to 19 persons Medium=20 to 99 Cottage=less than 5 Sources: Biro Pusat Statistik
476.9 (77.86) 53.0 (8.65) 82.5 (13.47) 612.5 (100.0) 1,660.5 (77.62) 187.3 (8.76) 291.4 (13.62) 2,139.2 (100.0)
goods, such as iron, steel and machineries, developed with higher growth rates to satisfy the increasing demand.
Employment Structure
According to official statistics, small and cottage scale industry in Indonesia together accounted for 87% of total manufacturing
employment in 1974-75 and for 80~o in
1979.
As shown in Table 6, the small and cottage scale establishments absorbed most of the laborers in the manufacturing sector, but contributed very little to total value
added. On the contrary, the large and
medium firms employed only 19~o of the manufacturing laborers, but contributed 78~o to the total value added in this sector in 1979. The share attributed to small manufacturing firms is 18~o in terms of employment and 9% in value added, while the cottage industries absorbed 62% of the laborers and contributed more than 13~o
overall value added in manufacturing sector. These data clearly show that the large and medium manufacturing establishments in Indonesia contributed significantly to
value added, while small and cottage scale manufacturing industries have absorbed more labor than the large and medium scale industries.
The small and cottage scale establish-ments, which accounted for only slightly more than 20%> of manufacturing value added, have played an extremely role in the
employment of laborers. This extreme
heterogeneity which exists between value added and employment in the manufactur-ing industry is a characteristic feature of that sector in Indonesia. Depending upon the actual situation, employment promotion might be better oriented to the small and cottage scale sectors, while growth oriented policy might be more wisely focussed on the . large and medium firms in the modem sectors. Under such circumstances, policy makers might find themselves in a dilemma over employment and growth.
2. Capz"tal and Labor Intensz"ty in Indones'ia
Capital and labor intensities are useful measures for analysing the characteristics of industries and establishing development
0.0 0.2 0.4 0.6 0.8 1.0 1.2 1.4 1.6 1.8
Normalized ILOR Labor Intensive
Fig.l Normalized IeOR and ILOR of Indonesian Manufacturing Industries
divided into 4 quadrants with the boundary lines 1.0 for ICOR and 0.6 ILOR. The choice of these boundary lines is purely a matter of convenience. In the case of developing countries, savings for capital accumulation are generally scarce and most capital goods must be imported from abroad. There-fore, less capital intensive industries are desirable in terms of availability of savings and limitations of foreign exchanges. On the other hand, labor intensive industries are desirable to developing countries, where large sur-pluses of labor exist.
From this point of view, the most desirable industries are classified in quadrant IV of Fig. 1, where industries are less capital intensive and more labor intensive than the industrial average. These industries are, namely, textile, transport equipment, fabricated metal, electric
ma-chinery, food manufacturing and
non-metallic mineral. Among these, the textile industry has a significantly high ILOR, Le., 2,605 person per Rps 1 billion, and its ICOR is one of the lowest. Therefore, the textile industry is especially suitable for the indus-trialization of the country. Industries in quadrant III are neither labor intensive nor capital intensive. These industries include chemical and petroleum products (indust-rial chemicals, other chemicals and rubber products), machinery (control equipment) and other manufacturing.
These industries may also be desirable. However, their labor requirement is smaller than industries in quadrant IV. Industries in quadrant II are more capital intensive
.
32 0.8 I , Ile33
• 1:, 37 IQuadrant II1.4 .-,Qu-ad-ran-tl-II 356: 33 Wood Product
34 Paper, Printing • t::! 356 Plastic Products 37 Basic Metal 1.2 34 :
• i
1.0 --- ---1- --- --- ---382 : • IQuadrantNI • I:36 31 Food Mfg. 38 32 Textile ' . 381 36 Non·metallic Material 352 : 383 381 Fabricated Metal 0.6 .·351 , • • 383 Electric Machinery • .: 31 384 384 Transport Equipment 35 • 39: IQuadrantlll 1385 i0.4 35 Chemical. Petroleum Products
351 Industrial Chemicals
352 Other Chemicals
0.2 355 ~5 ~':.~'!,'j~:r~~:;egated 382 Machinery
385 Control Equipment, etc.
39 Other Mfg. I
I
Capital Intensive Normalized ICOR 1.8 1.63) Departemen Perindustrian,Pengkz"tungan Capi-tal Output Ratio Sektor Industri, 1983 and
Pengkitungan Labor Output Ratz"o Sektor Industri, 1983. Data for petroleum and its products are not available in these books.
strategies. In the case of Indonesia, the incremental capital output ratio (ICOR) and the incremental labor output ratio (ILOR) are available for manufacturing industries from the Indonesia Ministry Industry.S) The following analysis will be based on these data. rCOR is defined as the ratio of investment with changes in output with some time lag. Likewise with ILOR as the ratio of changes in labor with changes in output.
Appendix 8 is calculated to compare ICOR and ILOR for each manufacturing
industry. Also, ICOR and ILOR have
been normalized with the average of unity and shown in Fig. 1. The area in Fig. 1 is
and less labor intensive. Industries m quadrant I are more capital intensive as
well as more labor intensive. In that
quadrant, only the wood product industry is included. Industries in quadrant I and II may not be desirable in terms of IeOR
and ILOR. However, some of these
industries are exporting their products intensively. Therefore, we should keep in mind that evaluation by IeOR and ILOR is only one method of evaluation. Others are still useful and necessary. Industry in the quadrant I includes wood products, while industries in the quadrant II include basic metals, plastic products and paper printing. Industries in the quadrant III are neither labor intensive nor capital intensive.
As we observed, the transportation
equipment industry had a relatively signifi-cant role in Indonesia in terms of output among ASEAN countries and its capital and labor intensity seems desirable. The rubber product industry also performs well in terms of export, and the normalized
IeOR of this industry (0.226) is the lowest of the Indonesian manufacturing industries. However, the normalized ILOR is also the lowest(0.026). Therefore, unlike the trans-portation equipment industry, much em-ployment may not be expected from this industry.
m
International Linkage Analysis
for Manufacturing Sectors
1. International Input-Output Table Frame-work
An input-output table for a country describes inter-industrial transactions among its domestic industries. However, transactions between domestic industries and foreign countries (or outside regions) are treated in lump sums under the names of import and export. Therefore, this table does not clarify to which foreign industry the export is done and from which country (or region) the import is done. In order to analyse international (or inter-regional) trade in terms of international division of
Total Output Import . Country A Country B Country C Final
Sector 1··· n 1··· n l···n Demand
1
S=XAA=:= XAB XAC FA
n Country A
~---=---+---;'---T---i
XBC Country C 1 Country B XBA XBB==::.. ---.---
-i- .. -.. --.--
~~~···
.
XCA XCB I XC~ FC XC nGross Value Added VA VB VC
·
.
·
.
- • - • • • - • - - - • • • - - - r ..
·
.
Total Input XA XB XC
labor and interdependent economic relation-ship, the input-output relationship should be clarified by industry as well as by country. An international (inter-regional) input-output table Fig. 2, has been fonnu-lated for the analysis.
Hatched areas XAA, XBB and XCc in Fig. 2 correspond to domestic input-output tables of countries A, Band C, respectively. XAB and XAC are exports of country A to
countries Band C. XBA and XCA are
imports country A from countries Band C. In other words, areas XRS (R not equal S) correspond to trade matrices. Final de-mands FA, FB and FC are each country's
final demands. Therefore, XA, XB and
Xc in the right hand column are each country's total outputs. Finally, VA, VB and VC are gross value added in each country.
2. International Dependency of Industrial Development
International Dependency
Let us suppose that final demand occurs in country A. To satisfy this final demand, direct and indirect demands, are induced according to the teclmological structure of the country A's industries. These direct and indirect demands will first affect domes-tic industrial activities. Further, if do-mestic supply cannot sufficiently meet these demands, imports (competitive im-ports) are induced from country Band other countries. In another case (non-competitive imports), let us suppose that final demand for product P (automobile, for example) occurs in country A. To produce this product P, parts
Q
(diesel engine forautomobile) are required due to the techno-logical structure in country A. Since parts
Q
are not produced in country A, and they are produced in country B, import of partsQ
from country B is induced by country A.In either case, final demand of country A will affect economic activities of all indus-tries in country A, as well as B and other countries. In others words, final demand of a country relates directly and indirectly to each country's industrial activities.
W. Isard and W. W. Leontief [1953] formulated an international (inter-regional)
input-output model. By applying this
model to the problem stated above, we can determine how much ultimate demand will be induced in each country by the final
demand of a country. Therefore, this
model clarifies quantitatively the degree of international dependence of industries.
Let us suppose that production of
industry i in country A depends on final
demands of countries A, Band C. Then
K AA, K AB and K AC represent factors in showing how industry i ultimately depends on these final demands. These ultimate degrees of dependence are defined as:
Ki AA
=(
~
bijAAfjA)/XiAj=1
Ki AC
=(
~
biJACfjC)/XiAj=1
The tenn bijRS is an element of Leontief inverse matrix of the international (inter-regional) input-output model. The term fjR shows final demand of product j In country Rand XjR shows production of industryj in country R.
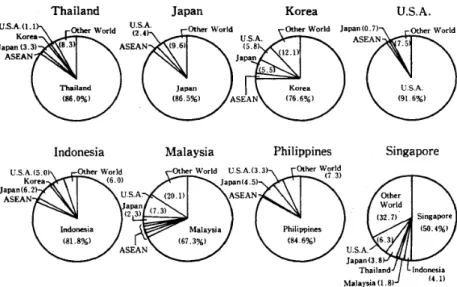
Fig. 3 shows how each country's total production depends ultimately on do-mestic and foreign final de-mands. This figure is deter-mined from the international
Thailand Japan Korea U.S.A.
Ultimate Degree of Dependence of Total Outputs in the Eight Countries on Final Demands of Each Country Indonesia
Fig. 3
Singapore Philippines
Malaysia
among ASEAN countries. Thailand and
Philippines have similar foreign depen-dence, around 15°/<>, These three countries are, not as exposed to foreign economies as Singapore and Malaysia.
The industrialization strategy for Indo-nesia, Philippines and Thailand emphasize export promotion to industrialized countires, such USA and Japan. Korea has 5.5% and
5.80/0 of its gross output generated by final demands of Japan and USA, respectively. Additionally, it should be noted that intra-ASEAN economic activities are still small. As is shown in Fig. 3, the ultimate degree of interdependence of total output among ASEAN countries is very small except for
Singapore. Each ASEAN country's
ulti-mate dependence on other ASEAN count-ries is smaller than their dependence on USA and Japan. The Indonesian ultimate degree of dependence is shown in detail in Appendix 7. The data in Appendix 7 show that Indonesia depends less on the other four ASEAN countries than on Japan and
USA for all products except rubber
Singapore's dependence on foreign coun-tries is close to 500/0. The Singapore domestic economic condition is, therefore, affected considerably by the world business cycle. Any protectionistic tendency in the world market due to this business cycle actually amplifies the damage into the
economy of that country. At the same
time, domestic economic policy only has a small influence on Singapore's economy. Such a country must strengthen inter-national competitiveness of its domestic industries. In contrast, USA and Japan have approximately 90% dependence on their own final demands. These two most industrialized countries have highly inter-related industries within their own borders. Malaysia's dependence on foreign de-mand is greater than 30%, which is the next highest to that of Singapore. Foreign dependence of Indonesia is slightly below 20%. This percentage is relatively low input-output table for five
ASEAN countries, Japan, USA and Korea. As shown in Fig. 3, Singapore has the highest ultimate degree of dependence of its total pro-duction on foreign final
de-mand (49.6%). The second
highest country is Malaysia (32.70/0). The third is Korea (23.4%) and the lowest is
products, for which dependence on Japan is minor. The Indonesian ultimate degree of dependence on domestic final demand is generally high at more than 90%, excluding petroleum and rubber products. Petroleum depends especially on Japanese demand
(27.8%) and rubber depends mainly on
American demand (39.85°!cJ).
Export structure
Almost all ASEAN countries export their manufacturing products to USA and Japan more than to other ASEAN
coun-tries. Table 7 shows the ASEAN
coun-tries' percentage of exports to other ASEAN countries as well as to Japan, Korea and
USA. Korea, USA and Japan are
con-spicuously large in their share. Again, intra-ASEAN trade of manufactured pro-ducts is very small.
Nevertheless, the inter-ASEAN trade is worth analysing as it sheds light on the
potential for expansion of Indonesian
exports.
In order to analyse intra-ASEAN trade, coefficients on intensities of export and import linkage of each country will be
introduced. In the case of Indonesia,
intensity of import linkage is an indicator which depicts the degree of Indonesia's importance to the other ASEAN countries
as a supplier of a product. By way of
example, take food as an example in Thailand. Appendix 9 shows that around 47.820/0 of all food imported by Thailand from other ASEAN countries originates from Indonesia. Percentage caluclated in this manner is called the intensity of import linkage (IlL) between these two countries. Intensity of export linkage defined by commodity is an indicator which reflects the degree of the other ASEAN countries's significance to the Indonesian economy. In the example above, 9.8% of all food exported by Indonesia to other ASEAN countries is imported by Thailand. Per-centage calculated in this manner is called
the intensity of export linkage (IEL)
between two countries.
These coefficients can be defined both by commodity and by types of demand, i.e., food product for intermediate demand, or textile for final demand, and so on.
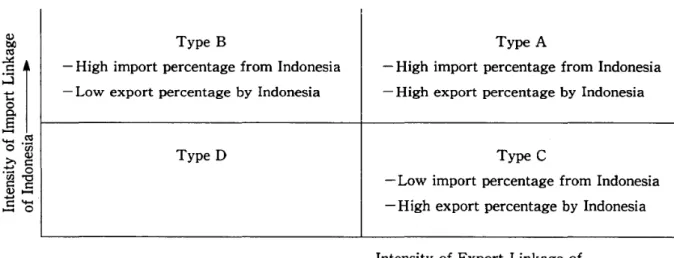
U sage of these coefficients for inter-national economic analysis will be
demon-strated with Fig. 4. Type A and B
countries in Fig. 4 would much depend on Indonesian exports, therefore, we should regard that Indonesian products are inter-nationally competitive to these countries. Accordingly, export promotion would be
Table 7 Exports of Manufacturing Products of ASEAN Countries in 1975
(%)
To From Indonesia Malaysia Philippines Singapore Thailand Japan Korea U.S.A. Total
Indonesia 1. 28 0.05 22.01 0.31 41. 73 0.75 33.85 100.00 Malaysia 0.93 0.33 19.29 1.65 16.08 6.01 55.71 100.00 Philippines 1. 02 0.32 1. 66 0.52 42.79 1.16 52.54 100.00 Singapore 24.65 11. 72 0.60 3.40 25.64 0.33 33.66 100.00
Thailand 2.80 7.26 2.71 7.85 52.30 1.87 25.21 100.00
~ t'I:S
II
'0 .~ >.Q) ... c:: ._ 0 00-0 c:: c:: Q )-...
c::-_ 0 Type B- High import percentage from Indonesia - Low export percentage by Indonesia
Type D
Type A
- High import percentage from Indonesia - High export percentage by Indonesia
Type C
- Low import percentage from Indonesia - High export percentage by Indonesia
Intensity of Export Linkage of Indonesia •
Fig.4 IntensitiesofExport and Import Linkages
effective to these countries. Especially, type A countries are the most important
for Indonesia, because the export of
Indonesia to these countries scores at considerable percentage.
Type C countries may not regard Indo-nesia as an important supplier, however,
these countries are still important for Indonesia because Indonesia exports to these countries at high percentage.
For a better indication of competitiveness, several other factors need to be considered, such as performance of Indonesian exported
products over time, prospect of world
70 IlL Rubber Products for Singapore
•
60Quadrant II Quadrant I Petro-ChemicalProducts for Singapore
•
Classification of Indonesian Commodities with respect toInternational Trade for the Partner Countries for Singapore IlL IEL--:2'..c::bIl Rubber Products 65.41% 99.97%
~i~ Petro-Chemical 61.77 95.20
.a ,....
",_1>1J'....l Other Mfg. 29.6>1 94.18&--
--
Transport Equip. 25.47 100.00 Machinery Products 17.41 69.16for Thailand IlL IEL
==2~ Food Products 47.82 9.83
ci.3 Wood Products 40.48 1.99
E....l....l Textile 16.20 24.00
~==2:!
::s--for Philippines
a
Petro-Chemical 16.36 2.30
>~2 for Singapore IlL IEL
-~tlO
~.3:i3 Wood products 5.90 90.64
... ....l....l
Textile 6.27 61.97
~=~
::s--
Paper, Pulp&Print 7.24 56.52CY Quadrantrl Other Mfg. Products for Singapore
•
•
Transport Equipment Machinery ProductsIfor Singapore for Sigapore•
Quadrantm Food Products for Thailand•
Wood Products 40 for Thailand 30 20 Petro.Chemical Products for Philippines 15i.... ---~---Textile Products :for Thailand Pulp, Paper&
Printing for Singapore
: . • • Wood Products : Text~leProducts for Singapore I for Smgapore
01L-~~~--L...-~-L..-....1.-~--'--.L.---l1.--10 20 30 40 50 60 70 .80 90 1001(%)
IEL
Fig.5 Intensities of Export and Import on Indonesian Commodities
10 50
competition, etc.
Fig. 5 and the accompanying data show the classification method for A, B, C and D. Since each product type attached to
the country name, we can see which
products have high intensity of import and export linkage for these countries. It should be noted that Singapore is in Quadrant I in this figure. Yet, products exported to Singapore might be reexported to others countries as well.
The intensities of import and export linkage calculated above are based on the total of intermediate and final demands, excluding changes of inventories. How-ever, export and import are analyzed in more detail by classifying them into two
groups. One group is the commodity
exported and imported for final demand (excluding changes of inventories), and the other group is that of intermediate demand
use. We do not perform analysis
con-cerning the distinction between intermediate and final demands. Interested readers may further analyse the intensities based on data shown in Appendix 9.
3. International Compart"son of Inter-t.·ndustrt"al Linkage
In the industrialization process of
de-veloping countries, investment in new
industries have two kinds of repercussion effects. First, investment in a new sector, occuring from the purchase of another sector's products as intermediate goods, stimulates other sector to increase their production. This effect is called backward
linkage. Second, investment in a new
sector provides intermediate goods for other
user production. Thus, other sectors are induced to increase their production. This is called forward linkage. Therefore, con-centrating investment on sectors which have high forward and backward linkages can accelerate industrialization of develop-ing countries.
We can identify the important industrial sectors for economic development by refer-ence to the backward and forward linkage multipliers.4) And, of course, we should
consider cost and efficiency aspects to complement this linkage analysis, so as to
avoid inefficiency In the development
process.
In this section, we analyse characteristics of industries in each country by inter-national comparison of the linkage co-efficients calculated by the
J
apan-USA-ASEAN international input-output model. The backward linkage coefficient, which indicates relative size of backward linkage4) See Hirschman [1958]. Hirschman pointed out that "The knowledge of the approximate ranking of industry from the point of view of forward and backward linkage effects as derived from existing developed economies through their input-output tables is, I believed, useful to the economist-planner in underdeveloped areas.
Itis something to be added to his criteria-box". Thus, he suggested that these coefficients are useful to find industries for development strategy. However, as Hirschman cautioned, disturbance factors may arise in the economic development process in developing countries that are designed to stimulate forward and backward linkages. For example, stimulation for development may be totally absorbed into imports and cause prob-lems in balance of payments. In another case this stimulation may hit the ceiling for input production capacity and inflation. In addition comparative cost is not considered at all when selection of key industries is done by linkage coefficients.
of an industry, can be expressed as follows:
k k n n
(lInk) ~ ~ ~ ~bij rs r=1 s=1 i=1 j=1
Where k is the number of countries.
The numerator of this equation is a
verti-cal sum of j th clumn elements of the
Leontief inverse matrix. The denominator is average of the vertical sums of all indus-tries. In the same manner forward linkage can be expressed as : k n ~ ~burs D.r _ _--=-s~=~1~j= 1'--- _ 1 - k k n n (link) ~ ~ ~ ~ bijrs r=1 s=l i=1 j=l
Linkage coefficients provide useful infor-mation to identity important industries for
economic development policy. In the case of the international input-output table, the average of linkage coefficients of all industries in all countries is unity.
Therefore, in some countries the average of linkage coefficients of all industries is more than unity, and in other countries it is less than unity.
Here, let us compare backward linkage coefficients of manufacturing industries calculated by the ASEAN-Japan-Korea-USA international input-output table.
Table 8 shows that backward linkage coefficients of all industries are more than unity in Japan, USA, Korea and Singapore and less than unity in the four ASEAN countries.
In descending order of backward linkage coefficients are Philippines, Thailand,
Indo-Table 8 International Comparison of Backward Linkage Coefficients for Manufacturing Industries, 1975 Indonesia Malaysia Philippines Singapore Thailand Japan Korea U.s.A.
Food Manufacturing 1. 033 1. 070 1.125 1.157 1. 090 1. 320 1. 224 1. 642 Textile and 1. 202 1.124 1. 234 1. 068 1.186 1. 386 1. 496 1.166 I ts Products Wood and 1. 024 0.913 1. 099 1. 289 1. 014 1.281 1. 259 1. 055 Wood Products
Pulp, Paper and
0.948 0.983 0.936 1. 002 1. 003 1. 356 1. 276 1. 049 Printing Chemical 1. 024 1.141 1. 058 1. 220 1. 059 1. 377 1. 303 1.100 Petro-chemical 1. 050 0.599 0.696 0.680 0.642 0.803 0.726 1. 378 Rubber Products 1.132 1. 020 1.170 1. 529 1. 048 1. 276 1. 395 1.105 Non-ferrous 0.899 0.916 1. 086 1.112 1. 029 1. 211 1.118 1. 041 Mineral Products Metal Products 1.131 1. 031 1. 201 1. 203 1.180 1.453 1. 575 1.187 Machinery Products 1.015 1. 084 1.216 1.169 1.105 1. 360 1. 328 1. 058 Transportation 1. 081 1.163 1.215 1.114 1.193 1.435 1. 334 1. 218 Equipments Total Economy 0.886 0.874 0.952 1. 040 0.910 1.159 1.075 1.104 Average
Note: In deriving the linkages, the above countries are interlinked together, while the rest of world is treated as exogenous.
nesia and Malaysia. In general, the more a country is industrialized, the higher the average of backward linkage coefficients of all industries becomes.
Now let us look at the backward linkage coefficients in the main sectors of manu-facturing industry in the five ASEAN countries. In the food sectors Singapore has highest coefficient, followed by Phil-ippines, Thailand, Malaysia and Indonesia, in that order. In the textile and textile products sector, Philippines has the highest coefficient, followed by Indonesia, Thailand
and Malaysia and Singapore. In the
chemical sector, the highest is Singapore, then Malaysia, Thailand, Philippines and Indonesia follow. In the petro-chemical sector, Indonesia stands out, followed by
Philippines, Singapore, Thailand and
Malaysia. In metal products, Korea has the highest backward linkage coefficient;
Singapore comes first among the five
ASEAN countries, followed by Philippines,
Thailand, Indonesia and Malaysia. In
both the machinery products and transport equipment sector, Philippines has the high-est and Indonesia has the lowhigh-est coefficient.
Singapore, Thailand and Malaysia are
ranked in between those two countries. However, in the transport equipment sector, Thailand, Malaysia and Singapore rank in descending order.
In Japan, the sectors which have the highest backward linkage coefficients among the eight countries are pulp, paper and printing, chemical non-ferrous mineral, and machinery products. Additionally, the transportation equipment, and machinery product sectors have conspiciously high
coefficients. These large values correspond with the fact that these sectors led Japan's economic growth during 1970's.
U SA has two sectors, food manufacturing and petrochemicals, which hold the position of highest backward linkage coefficient
among the eight countries. The pulp,
paper and printing and transportation
equipment sectors have the third largest coefficients. Chemical, non-ferrous miner-al, and metal products sectors both have the fifth largest coefficients. The coefficient of the textile and textile products sector is sixth among the eight countries.
The aforementioned observation helps to
explain the background of the 1970's
economic situation in which chemical, metal
products, machinery and other sectors
contributed to the development of Japan and certain NICs, such as Korea and Singapore. Stagnation in the US economy in the 1970's, to a certain degree, might be a reflection of these observations.
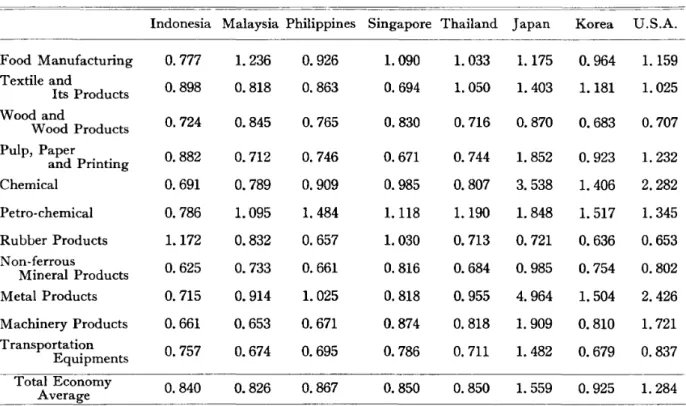
Next, let us internationally compare forward linkage coefficients in Table 9. The forward linkage coefficient is a supple-mentary factor to the backward linkage coefficient. The forward linkage coefficient
indicates how strongly an increase in
production of a sector stimulates production in other sectors.
The forward linkage coefficients calcu-lated by the ASEAN-Japan-USA-Korea international input-output table are more than unity for Japan and USA, less than unity for the other countries, though the average of all industries in all countries is unity.
Table 9 International Comparison of Forward Linkage Coefficients for Manufacturing Industries, 1975
Indonesia Malaysia Philippines Singapore Thailand Japan Korea U.S.A.
Food Manufacturing O. 777 1. 236 0.926 1. 090 1. 033 1.175 0.964 1.159 Textile and 0.898 0.818 0.863 0.694 1. 050 1. 403 1.181 1.025 Its Products Wood and 0.724 0.845 0.765 0.830 0.716 0.870 0.683 0.707 Wood Products Pulp, Paper 0.882 0.712 0.746 0.671 O. 744 1. 852 0.923 1.232 and Printing Chemical 0.691 O. 789 0.909 0.985 0.807 3.538 1. 406 2.282 Petro-chemical O. 786 1. 095 1.484 1.118 1.190 1. 848 1. 517 1. 345 Rubber Products 1.172 0.832 0.657 1. 030 0.713 0.721 0.636 0.653 Non-ferrous 0.625 O. 733 0.661 0.816 0.684 0.985 0.754 0.802 Mineral Products Metal Products O. 715 0.914 1. 025 0.818 0.955 4.964 1. 504 2.426 Machinery Products 0.661 0.653 0.671 0.874 0.818 1.909 0.810 1.721 Transportation O. 757 0.674 0.695 0.786 0.711 1. 482 0.679 0.837 Equipments Total Economy 0.840 0.826 0.867 0.850 0.850 1. 559 0.925 1.284 Average
Source: Institute of Developing Economies [1982]
ASEAN countries by the primary manu-facturing sectors. In the food sector, Malaysia has the largest forward linkage coefficient, exceeding even Japan and USA. It is followed by Singapore, Thailand, Philippines, and Indonesia. In textile products, the coefficient is largest in Thailand, then Indonesia, Philippines and
Singapore in descending order. Among
the five ASEAN countries, Singapore has the largest coefficient in chemical, ma-chinery product, and transportation equip-ment sectors. Philippines has the largest coefficient in petro-chemical and metal product sectors.
Further, among the eight countries,
Japan has the largest forward linkage coefficients In the textile and textile products, chemical, petro-chemical, metal products, machinery, and transportation
equipment sectors. In contrast, Indonesia
and Malaysia have low coefficients in
chemical, oil, metal products, machinery and other sectors.
Notice that Korea and Singapore, the two newly industrializing countries, have, in general, high forward linkage coefficients in strategic sectors.
IV Future Aspects of Industrialization in Indonesia
1. Towards an Industrz'al Society
Industrial development is regarded as an essential part of economic development for raising the standard of living. In this process the industrial sector is expected to develop and become stronger, as reflected in stronger linkages between small, medium and large industries, and higher
competi-tiveness that enable it to contribute much more significantly to the foreign exchange
earnings of the country. Promotion of
manufactured export products is essential for sustaining development and should be regarded as a national goal to be throughly implemented. Efforts to strengthen export product competitiveness in international markets with respect to price, quality and services should be made continually.
Given the unfavourable prospect of oil, foreign exchange earnings from oil should not be expected to rise significantly. To earn foreign exchange, promotion of non-oil and non-LNG should be stressed. Policies to promote non-oil and non-LNG exports should be aimed at achieving fundamental changes in the export structure through strengthening the competitiveness of Indo-nesian export products in foreign markets. Export promotion policies should be
formulated within the framework of
structural change in the overall economy which will realize a higher rate of· growth for the industrial sector relative· to the agricultural sector.
Monetary, fiscal and trade policy mea-sures should be directed to complement industrial policy in such a way that the manufactured products become more com-petitive with respect to price, quality, time delivery and other'services.
The rupiah-foreign currency exchange rate should be maintained at a level which does not reduce (and may actually increase) the international competitiveness of Indo-nesian products.
2. "Future Trends of Industrialization in Indonesia
Based on the objectives identified in the Guidelines of State Policy (GBHN) and other considerations, including an economic and industrial structure in line' with the previous section, industrialization in the coming years, specifically in Repelita V (The Fifth National Development Plan), and perhaps in some years beyond that, should focus on some priorities, such as machinery industries, high linkage indus-tries, industries for export, labor intensive industries, small scale industries, and certain
industries which are considered to be
strategic for national security.
Machinery industries, as pointed out, are lagging far behind those in the neighboring countries, not only in terms of their per-centage shares in "manufacturing value added or in the economy as a whole, but also in terms of their absolute output value. As shown in Appendix 1; and reflected in Appendix 3, the output of Indonesia's machinery and metal products industry was quite small. It was less than Thailand, and much less than Malaysia and Singa-pore, despite of the smaller sizes of those countries.
The report also analized various types of
industries in terms of backward and
forward linkages both for direct and total linkages. This" 'linkage consideration is
very important. A lot of the stimulus
coming from elements of final demand has not been translated into more output, employment or other related aspects, but instead gone to imports, because of the lack of linkages. Yet, it is also important to
realize that linkages can also give rise to inefficiency if they are not properly ex-ploited. Inefficiency from one type of industry can be transferred and dissemi-nated to other parts of the industry through linkage which eventually result in lower competitive power of the industry as a whole. It is clear that the availability of foreign exchange is very important for the self-sustaining development process. Perhaps it is not an exaggeration to say that one of most binding constraints of the development of Indonesia in the coming year will be
foreign exchange. Approximately two
thirds to three quarters of the foreign exchange from exports has been coming from oil and gas. Oil and gas also con-tributed around one half to two thirds of the
domestic government revenue. But the
future of the oil industry is very uncertain, affected by so many variables both on the
demand and supply side. According to
many forecasts, the prospect of oil in the next few years does not look very bright. Recognizing this situation several years ago, the government of Indonesia decided to strive for diversification and adopted policies to foster the export of non-oil and non-LNG related manufactured products. Itis clear that to be able to export, one of the necessary conditions is competitiveness of the products vis-a-vis products in the world market. Efficiency, therefore, is extremely significant in this matter.
In Repelita IV, it is estimated that there are 9.3 million new entrants to the
labor force. This requires employment
creation in all areas of economic activity
including manufacturing. The majority
of employment in manufacturing activities IS In small scale industries. These small scale industries also contribute to foreign exchange earning and a large number of them are located in rural areas, creating a higher income for the people in those areas.
Electronics industries are on the priority list and are considered strategic. More-over, they are generally labor intensive. Yet, the very fast technological changes in some industries have also affected some segments of these electronic industries. In other countries some segments of these industries have been robotized, resulting in lower product cost. Products produced by the labor intensive technique have become less competitive. The strategic nature of these industries, their contribution to em-ployment and the effect of technological changes on them, of course, affects how these industries should be developed. Engineer-ing design is one of the fields in which Indonesia is still lagging behind. The government realizes the importance of this field and has put it on the priority list. Some other industries which are considered strategic are also on the priority list, such as steel, electronic and other industries related to security and defence. As already briefly discussed, these priorities are intercon-nected, and are not necessarily all consistent with each other.
The analysis in Kaneko, Tampubolon and Yanagi [1986] showed that exported manufactured products, for example, have
tended to be capital instead of labor
intensive. Proper exploitation of linkages is critical to actually achieve economic
advantages and benefits and not lead to lower competitive power, and thus, to fewer exports. Itis worth-noting that developing these various priority industries should be selected judiciously, taking into account such important elements as efficiency, equity, ability to sustain growth, etc., especially in consideration of the possibility of an oil glut and the protracted world
economic recession that have been affecting the Indonesian economy.
Various elements involved In the in-dustrial structure of a nation have been presented here. These elements should be taken into consideration to increase the effectiveness and efficiency of future de-velopment efforts.
References
Balmer-Thomas, V. 1982. Input-Output Analysis in Developing Countries. New York: John Wiley & Sons.
Chenery, H. B.; Watanabe, T.1958. International Comparisons of the Structure of Production.
Econometrt"ca 26.
Hirschman, A. 1958. The Strategy of Economic Development. New Haven: Yale University Press.
Hoffmann, W. G. 1958. The Growth of Industn:al Economt"cs(German Original, 1931), expanded and revised English version, Manchester
Univ. Press.
Institute of Developing Economies. 1982. Inter-natt'onal Input-Output Table for ASEAN Countries 1975. Tokyo.
Isard, W. 1953. Some Empirical Results and Problems of Regional Input-Output Analysis. In Studt"es z'n the Structure of the American Economy, edited by W. W. Leontief. New York: Oxford University Press.
Kaneko, Y. 1980. Changes in Japan's Industrial Structure since the Oil Crisis. The Developt"ng
Economz'es 18.
- - - - . 1985. Some Aspects of Economic Development Process in Indonesia. Ekonomz' dan Keuangan Indonesia 33.
Kaneko, Y.; Tampubolon, H.; and Yanagi, E. 1986. Domestic Production and Factor Con-tent of International Trade in Indonesia. (A paper presented at the Eight International Conference on Input-Output Techniques, Sapporo, Japan, 1986). In Industrialt'zatt"on in Indonest"a, edited by Y. Kaneko and K. Nidaira. Hiroshima: Hiroshima University of Economics.
Roepstorff, T. M. 1985. Industrial Development in Indonesia. Bulle#n of Indonesz'an Eco-nomt"c Studz'es 21.
United Nations Industrial Development Organi-zation. 1981. World Industry z'n 1980.
New York.
- - - . 1984. Prospects for Industrt"al Develop-ment and for a Capt"tal Goods Industry t"n Indonest"a. UNIDO/IS. 479. Add. 1 and 2.
Appendix 1 Total Output of ASEAN Countries, 1975
(1,000 US$) Indonesia Malaysia Philippines Singapore Thailand ASEAN
Total Food, beverage, and tobacco
Textile, leather, and its products Lumber and wooden products Pulp, paper and printing Chemical products
Petroleum and its products Rubber products
N on-metallic mineral products Metal products
Machinery
Transport equipment
Other manufacturing products Total of Manufacturing Sectors
8,509,071 1,456,968 496,070 292,121 508,153 854,604 504,120 313,838 568,828 380,030 1,735,926 160,480 15,780,209 2,215,957 5,277,601 370,688 1,079,905 386,456 470,740 151,211 410,585 239,773 565,014 373,213 1,206,724 869,148 132,600 175,755 287,711 998,877 703,682 519,330 365,714 154,480 573,821 201,703 215,728 6,656,591 11,289,825 1,122,639 4,853,464 21,978,732 545,669 1,756,888 5,210,118 408,728 423,146 2,185,140 128,824 310,752 1,293,493 355,902 488,287 2,157,129 2,018,759 827,479 5,280,779 324,506 295,669 2,126,043 198,454 279,374 1,255,132 351,610 730,419 3,353,416 1,209,742 448,101 2,922,917 539,761 775,589 3,779,577 347,859 391,369 1,317,139 7,552,453 11,580,537 52,859,615 Source: Institute of Developing Economies [1982]
Appendix 2 Percentage of Output by Manufacturing Industry in ASEAN Countries, 1975
Industry Indonesia Malaysia Philippines Singapore Thailand ASEAN Total l. Consumption Goods
Food, beverage, and tobacco 53.92 33.28 46. 75 14.86 41. 92 41. 60 Textile, leather, and its products 9.23 5.57 9.55 7.23 15.16 9.86
Lumber and wooden products 3.14 5.81 4.18 5.41 3.64 4. 14
Pulp, paper and printing 1. 85 2.27 3.63 1.71 2.69 2.44
Chemical products 3.22 3.61 5.01 4. 70 4.22 4.09
Petroleum and its products 5.42 5.61 10.68 26.73 7.15 9.98
Rubber products 3.20 13.93 1.17 4.30 2.56 4.03
Subtotal 79.98 69.21 80.96 64.94 77.34 76.15
2. Capital Goods
N on-metallic mineral products 1. 99 2.64 2.56 2.63 2.40 2.36
Metal products 3.61 15.02 6.24 4.65 6.30 6.34
Machinery 2.41 7.79 3.24 16.02 3.88 5.52
Transport equipment 11. 00 2.31 5.09 7.15 6. 70 7.14
Other manufacturing products 1.01 3.03 1. 91 4.61 3.38 2.49
Subtotal 20.02 30. 79 19.04 35.06 22.66 23.85
Total 100.00 100.00 100.00 100.00 100.00 100.00
JIO¥P"~JifJf~
25~2-l5-Appendix 3 Total Output of Each Manufacturing Industry in ASEAN Countries,1975 (%)
Indonesia Malaysia Philippines Singapore Thailand ASEANTotal Food, beverage, and tobacco 38.72 10.08 24.01 5.11 22.08 100.. 00
Textile, leather, and its products 27.96 7.11 20.73 10.47 33.72 100.00
Lumber and wooden products 22.70 17.69 21. 54 18.70 19.36 100.00
Pulp, paper and printing 22.58 11.69 31.74 9.96 24.02 100.00
Chemical products 23.56 11.12 26.19 16.50 22.64 100.00
Petroleum and its products 16.18 7.07 22.85 38.23 15.67 100.00
Rubber products 23.71 40.88 6.24 15.26 13.91 100.00
Non-metallic mineral products 25.00 14.00 22.92 15.81 22.26 100.00
Metal products 16.96 29.79 20.98 10.49 21. 78 100.00
Machinery 13.00 17.77 12.51 41. 39 15.33 100.00
Transport equipment 45.93 4.09 15.18 14.28 20.52 100.00
Other manufacturing products 12.18 15.31 16.38 26.41 29.71 100.00
Total of Manufacturing Sectors 29.85 12.59 21. 36 14.29 21. 91 100.00
Source: The same as Appendix1.
Appendix 4 Value Added of Each Industry in ASEAN Countries1975
(1,000US$) Indonesia Malaysia Philippines Singapore Thailand ASEAN
Total Food, beverage, and tobacco
Textile, leather, and its products Lumber and wooden products Pulp, paper and printing Chemical products
Petroleum and its products Rubber products
Non-metallic mineral products Metal products
Machinery
Transport equipment
Other manufacturing products Total of Manufacturing Sectors
2,316,940 459,871 197,921 133,560 198,859 207,628 120,265 168,108 164,625 123,045 610,348 53, 725 4,754,895 704,172 1,451,911 116,542 300,123 187,260 141,739 58,285 212,115 69,980 178,373 81,845 138,487 293,265 40,523 77,477 89,564 328,748 204,249 182,748 107,338 44,113 144,679 124,397 54,997 2,268,832 3,064,098 317, 703 206,559 71,295 45, 748 67,994 233,275 53,727 71,980 110,570 388,235 236,158 79,901 1,883,145 514,665 6,305,391 584,525 1,667,620 168,436 766,651 118,980 568,688 178,372 693,578 102,770 864,005 111,953 619,733 110,981 518,110 217,740 1,025,932 145,379 946,745 209,548 1,244,846 207,912 520,932 3,771,261 15,742,231
Appendix 5 Value Added Ratio of Each Industry in ASEAN Countries, 1975
(%)
Indonesia Malaysia Philippines Singapore Thailand ASEANTotal
Food, beverage, and tobacco 27.23 31. 78 27.51 28.30 31. 21 28.69 Textile, leather, and its products 31. 56 31.44 27.79 37.85 33.27 32.01 Lumber and wooden products 39.90 48.46 30.11 17.44 39.81 35.08 Pulp, paper and printing 45.72 38.55 51. 66 35.51 38.29 43.97 Chemical products 39.13 29.19 31.57 19.10 36.53 31.15 Petroleum and its products 24.30 21. 93 11.48 11.56 24.50 16.36
Rubber products 23.86 33. 74 30.56 15.56 37.86 29.15
Non-metallic mineral products 53.57 44.08 31.13 36.27 39.72 41. 28
Metal products 28.94 32.91 29.03 31. 45 29.81 30.59
Machinery 32.38 35.19 29.35 32.09 32.44 32.39
Transport equipment 35.16 28.56 25.21 43. 75 27.02 32.94 Other manufacturing products 33.48 61.67 25.49 22.97 53.12 39.55 Total of Manufacturing Sectors 30.13 34.08 27.14 24.93 32.57 29.78
Source: The same as Appendix 1.
Appendix 6 Percentage of Value Added by Manufacturing Industry in ASEAN Countries, 1975
Industry Indonesia Malaysia Philippines Singapore Thailand ASEANTotal
l. Consumption Goods
Food, beverage, and tobacco 48.73 31. 04 47.38 16.88 40.16 40.02 Textile, leather, and its products 9.65 5.12 9. 78 10.97 15.50 10.57 Lumber and wooden products 4.14 8.23 4.64 3.78 4.47 4.86 Pulp, paper and printing 2.84 2.58 6.90 2.42 3.16 3.61
Chemical products 4.20 3.08 5.82 3.61 4.74 4.41
Petroleum and its products 4.34 3.62 4.53 12.38 5.37 5.51
Rubber products 2.56 12.92 1. 34 2.85 2.98 3.96
Subtotal 76.46 66.59 80.39 52.89 76.38 72.94
2. Capital Goods
Non-metallic mineral products 3.52 3.40 2.93 3.83 2.93 3.31
Metal products 3.46 14.50 6.64 5.87 5. 77 6.51
IVlachinery 2.63 8.10 3.50 20.62 3.84 6.01
Transport equipment 12.82 1. 93 4.74 12.55 5.56 7.92 Other manufacturing products 1.11 5.48 1. 80 4.24 5.51 3.31
Subtotal 23.54 33.41 19.61 47.11 23.62 27.06
Total 100.00 100.00 100.00 100.00 100.00 100.00 Source: The same as Appendixl.
~
Q Q
Appendix 7 Indonesian Ultimate Degree of Dependence of Total Production on Each Country's Final Demand, 1975
ASEAN Other Total
Indonesia Malaysia Philippines Singapore Thailand excluding Japan Korea U.S.A. World Output Indonesia
Food, beverage, and tobacco 97.49 0.07 0.00 0.06 0.02 0.15 0.39 0.07 0.33 1.67 100.00
Textile, leather, and its products 98.81 0.03 0.00 -0.02 0.04 0.05 0.50 0.07 0.17 0.68 100.00
Lumber and wooden products 94. 78 0.03 0.01 0.14 0.01 0.19 1.08 0.11 0.59 4.22 100.00
Pulp, paper, and printing 93.51 0.03 0.01 0.10 0.02 0.16 1.34 0.30 0.68 4.38 100.00 ~
3m
Chemical products 93.41 0.11 0.01 0.29 0.12 0.53 0.97 0.21 1.58 3.83 100.00 ~,~
~
Petroleum and its products 48.29 0.10 0.12 1.92 0.09 2.23 27.87 0.34 8.53 12.36 100.00 ~
~
Rubber products 24.29 0.38 0.06 9.77 0.22 10.43 3.48 0.09 39.58 9.06 100.00 ~
~
I:'V
Non·metallic mineral products 98.30 0.03 0.01 0.03 0.01 0.08 0.50 0.77 0.38 1.07 100.00 iJ\Il
Metal products 82.00 0.04 0.04 0.21 0.06 0.35 5.07 0.15 4.21 8.90 100.00
Machinery 86.99 0.66 0.07 1.35 0.03 2.11 3.85 0.12 2.94 3.99 100.00
Transport equipment 94.52 0.02 0.01 0.15 0.01 0.19 1.51 0.19 0.84 2. 74 100.00
Other manufacturing products 92.34 0.16 0.01 1.32 0.07 1.56 1.44 0.22 0.87 2.89 100.00
Total of Manufacturing Sectors 91.15 0.08 0.02 0.53 0.04 0.67 2.44 0.13 2.34 3.03 100.00
Appendix 8 Incremental Capital/Output Radio (ICOR) and Incremental Labor/Output Ratio (ILOR) of Each Manufacturing Industry in Indonesia
ISIC 31 32 33 34 35 351 352 355 356 36 37 38 381 382 383 384 385 39 Industry Food Manufacturing Textiles Wood Products Paper, Printing Chemical, Petro-products Industrial Chemicals Other Chemicals Rubber Products Plastic Products Non-Metallic Mineral Basic Metal Machinery Fabricated Metal Machinery Electric Machinery Transport Equipment Control Equipment etc. Other Manufacturing Products
Total Manufacturing ICOR 2.47 2.19 3.32 4.48 2.34 2.58 2.59 0.92 5.62 3.70 6.50 3.32 3.06 3.75 2.79 2.50 2.06 2.20 4.07 Normalized ICOR 0.607 0.538 1.754 1.101 0.575 0.634 0.636 0.226 1.381 0.909 1.597 0.816 O.752 0.921 0.686 0.614 0.506 0.540 1.000 ILOR*> 557 2,605 851 672 237 172 1,449 36 1,059 885 470 486 1,232 187 960 1,394 512 797 1,381 Normalized ILOR 0.403 1.886 0.616 0.487 0.299 0.125 1.049 0.026 O. 767 0.641 0.340 0.352 0.892 0.135 0.695 1.009 0.371 0.577 1. 000 Source: Departemen Perindustrian dan Biro Pusat Statistik,1983. Penghitungan Capt"tal Output Ratio
Sektor Indusl'n".
Departemen Perindustrian dan Biro Pusat Statatistik, 1983. Penghitungan Labor Output Ra#o Sektor Industn:.
*> Person/billion Rp.
Appendix 9 Intensities of Export and Import Linkages on Indonesian Commodities,1975
IEL=lntensity of Export Linkage IlL = Intensity of Import Linkage(%)
Commodity Food Products
Intermediate Final Total
Type of demand
IEL IlL IEL IlL IEL IlL
Malaysia 35.81 5.41 48.77 15.60 44.46 10.38
Philippines 0.05 0.65 0.55 0.25 0.38 0.26
Singapore 56.46 3.51 39.79 5.40 45.33 4.41
Thailand 7.69 43.41 10.89 49.58 9.83 47.82
JIUffT :/'Tif3'f 25~2-t:t
C~mmocfity Textile Products
Intermediate Final Total
Type of demand
IEL IlL IEL IlL IEL IlL
Malaysia 3.63 1.57 74.38 ·6.28 14.03 3.78
Philippines
Singapore 70.23 18.7 14.05 0.31 61. 97 6.27
Thailand 26.14 20.84 11. 57 4.14 24~00 16.20
ASEAN Total ~OO.OO 7.92 100.00 1. 35 100.00 4.61
Commodity Wood Products
Intermediate Final • Total
Type of demand
I:EL IlL IEL IlL IEL IlL
Malaysia 5.96 7.99 42.42 2.35 7.37 5.22
Philippines
Singapore 93.19 6.92 27.27 0.44 90.64 5.91
Thailand 0.85 58.33 30.30 33.33 1,99 40.48
ASEAN Total 100.00 6.63 100.00 1.10 100.00 5.55
Commodity Metal Products
Intermediate Final Total
Type of demand
IEL IlL IEL IlL IEL IlL
. Malaysia 2.66 0.20 2.17···. 0.11
Philippines
Singapore. 72.95 .. 2.11 51.61 2.00 69.03 2.09
Thailand . 24.40 1.81 48.39 4.09 28.80 2.18
Commodity Transport Equipment
Intermediate Final Total
Type of demand
IEL IlL IEL IlL IEL IlL
Malaysia Philippines
Singapore 100.00 15.81 100.00 34.79 100.00 25.47
Thailand
ASEAN Total 100.00 2.55 100.00 2.25 100.00 2.33
Commodity Chemical Products
Intermediate Final Total
Type of demand
IEL
IEL IlL IEL IlL IlL
Malaysia 21. 86 2.38 35.63 4.37 24.56 2.73
Philippines 0.60 0.66 1.23 5.80 0.72 6.32
Singapore 49.82 10.00 48.89 8.20 49.64 9.60
Thailand 27.72 12.73 14.25 2.64 25.08 8.93
Jfi!:iffP"~JiUf3t
25~2-J3-Commodity Petrochemical Products
Intermediate Final Total
Type of demand
IEL IlL IEL IlL IEL IlL
Malaysia 2.88 0.42 1. 53 0.42 2.30 0.42
Philippines 1.18 16.55 3.78 16.28 2.30 16.36
Singapore 95.72 62.51 94.51 60.80 95.20 61. 77
Thailand 0.22 2.48 0.18 2.98 0.20 2.65
ASEAN Total 100.00 3.25 100.00 5.84 100.00 4.02
Commodity Rubber Products
Intermediate Final Total
Type of demand
IEL IlL IEL IlL IEL IlL
Malaysia 0.01 3.33 0.21 3.85 0.01 3.40
Philippines 0.01 3.88 0.21 4.65 0.01 4.00
Singapore 99.97 65.97 99.47 29.92 99.97 65.41
Thailand 0.01 2.65 0.11 0.18 0.01 1. 55
ASEAN Total 100.00 64.80 100.00 23.47 100.00 64.00
Commodity non- Metallic Mineral Products
Intermediate Final Total
Type of demand
IEL IEL IlL
IEL IlL IlL
Malaysia 100.00 0.59 100.00 8.33 100.00 0.81
Philippines Singapore Thailand
ASEAN Total 100.00 0.19 100.00 0.48 100.00 0.23