Article
Economic Growth through Distribution of
Income in Japan: Road to Stable Growth
with Progressive Income Tax System
OHTA, Hideaki
Abstract
Long-term stagnation of the Japanese economy is mainly due to the deterioration of in-come distribution where disposable inin-come of total households has constantly declined, and it has put negative pressure on consumer spending. The sluggish consumption has resulted in significantly lower economic growth in the past decades. A decrease in the disposable income of middle and lower income households has affected the total consumption in the economy, decelerating GDP growth in the past decades. Analysis based on simulation of changes in household expenditures by income category reveals the fact that introduction of more progressive tax system should have positive effects on total consumption, thereby raising growth rate in Japan. In addition, raising the consumption tax without introducing the reduced tax rate for daily commodities should increase the burden on low-income groups, and as a result, the overall consumption would decrease and put a large negative impact on the GDP growth rate. At the same time, the simulation result shows that the fiscal balance would improve with the increase in income tax revenue accompanying a more progressive tax system.
The result of this study shows that it is possible to achieve higher growth rate and an improvement in the fiscal balance by enhancement of progressive taxation system in Japan. Key Words: Income distribution, Gini, household consumption, GDP growth
JEL codes: E24, H20, 24, I30, O4
Introduction
Long-term stagnation of the Japanese economy, which has lasted since 1991 when the bubble burst, is mainly due to the deterioration of income distribution where disposable income of total households has constantly declined, and it has put negative pressure on consumer spending. Thus, the deterioration of income distribution has become the major
factor of the long-term economic stagnation. The prolongation of the slump in personal consumption is mainly due to decrease in disposable income, and heavier burden for the middle and low income classes in taxes and social insurance premiums, as well as increase of non-regular workers in the past decades.
Analysis based on simulation of changes in household expenditures by income category reveals the fact that a decrease in the disposable income of middle and lower income households has affected the total consumption in the economy, thereby decelerating GDP growth in the past decades.
In the past several years, corporate tax revenue has declined significantly with several incentives of reduction of corporate tax rates, in addition to the decline in the tax collection rate of self-employment and tax exemption from loss companies. On the other hand, the proportion of the consumption tax as a percentage of the tax revenue has constantly rising in the past decades. Under these circumstances, the burden of the high-income groups has significantly been reduced since 1980s, which was about 90% at the beginning of the 1980s, as compared to the maximum income tax rate 45% and the local tax 10%, total 55% today (as of March 2017)
While income disparity expands, some wealthy people such as property owners have benefitted from preferential treatment including inheritance tax deduction and reduced rates for transaction of securities. From the viewpoint of the national economy, consumption of wealthy people cannot be expected to be a major factor for increasing the total consump-tion expenditure. This is because consumpconsump-tion of rich people is small relative to the total consumption in the national economy, so that unless the total consumption of households is raised, long-term GDP growth rate is unlikely to rise. Therefore, expansion of disposable income of the middle and low income group should push up the consumer spending. In this sense, almost no effect due to "trickle down" has been observed in the past decades in Japan. The maximum tax rate of inheritance tax has been raised from 2015 and the deduction amount has been lowered, but the maximum total rate of national income and provincial taxes is only 55%, which is significantly lower than that of early 1980s. In the past several decades, fundamental problem of regressivity has not been resolved1). Raising consumption
tax without tax exemption measures would increase the burden on the low-income bracket and it would deteriorate income distribution through regressivity. In this respect, consump-tion tax hikes and the relaxaconsump-tion of income tax progressiveness will adversely affect medi-um- to long-term economic growth.
On the other hand, policies for tax deduction in equity investment that favour rich households as well as corporate tax exemptions and/ or reduction, should make heavier burden for the low and middle income families under the increasing public debt and fiscal deficit.
The simulation results in this paper show that the contribution of consumption expendi-ture to GDP growth rate is expected to increase by 1.9% in the most progressive tax reform were to be made. Therefore, to achieve economic recovery and stable economic growth in Japan, it is essential to increase a wider range of domestic private consumption by strength-ening income redistribution function accompanying more progressive tax system. It would be important to strengthen several policies for income redistribution, thereby increasing the
disposable income of the total household.2) To that end, it is necessary to introduce several
policy measures to improve in income distribution3). These policies may include introducing
a more progressive income tax system, and at the same time, reducing the weight on the consumption tax, while increase in the corporate tax revenue.
1. Current Stuation of Japanese Economy and income Distribution
The Japanese economy has been stagnated for more than 20 years since the collapse of the bubble economy in 1991. Although the economy recovered temporarily during the 1990s and 2000s, the Japanese economy still has not recovered from deflation. The average GDP growth rate in the past two decades (from 1997 to 2016) is only 0.75%, and nominal GDP has not yet surpassed the peak in 1997.
Consumption prices have risen due to the hike of consumption tax rate (5% to 8%) in April 2014 and the depreciation of the yen, rather they are in a stagflation situation. The funda-mental factor for such a sluggish growth of the economy is stagnation in private consumption demand for the last decades. The private consumption of which household consumption has most the share accounts for about 60% of national income has a great influence on GDP growth rate.
The income disparity between the rich and poor household has grown significantly in the past decades, and the number of high income earners have increased, especially since early 2000s during which neo-liberalism based labour market reforms have been introduced. The share of non-regular workers among the productive population has increased significantly and it is now reaching over 50%. This has put strong pressure for increasing real wage lev-els, since the annual income of non-regular workers are less than 1/3 of that of regular workers.
This paper addresses stagnation of domestic demand by households due to income dispar-ity over the past few decades, which is one of the major factors of the long-term stagnation of the Japanese economy. In this regard, several studies on income distribution and growth, including Ostry et al (2014) indicated that growth is attained through more equal income distribution and pointed out that ‘inequality may be ethically undesirable but also because the resulting growth may be low and unsustainable’. Bruckner and Lederman (2015) also maintained that empirical results provide support for the hypothesis that income inequality is detrimental to economic growth in advanced economies.
The results of simulation analyses in this paper indicate that the introduction of a pro-gressive income tax system will increase the annual GDP growth rate by nearly 2%, and reduce the burden on poor households and increase the burden on the wealthy. Also, it indi-cates that raising the consumption tax without decreasing or exempting daily necessities would reduce household expenditure and decrease GDP growth rate significantly.
1-1. Long-term stagnation of the Japanese economy and trends in the private consumption
Since 1991 when the bubble economy collapsed, Japan has experienced a long-term eco-nomic downturn. Although the economy recovered somewhat in the middle of 1995/6 and
2000, it was mainly due to improvement of external environment such as Asia and the United States, not due to expansion of domestic economies. Deflation gap has not been eliminated until now, the growth of personal consumption has not grown especially due to the decline in real wage for medium- to lower income groups, which has been one of the major factors for sluggish GDP growth rate in the last decades.
Extremely monetary easing policy of Quantitative and Qualitative Easing (QQE) has been introduced since 2013, but it has been practically ineffective for recovery of the real economy in Japan. The real average monthly expenditure per household has been declined for three consecutive years since 2014, resulted in the real growth of minus 1.8% with
¥244,225 month in 2016, which dropped by 23.7% as compared to ¥320,231 in 20064). In
addition, the household savings rate in 2013 fell to minus 1.3% for the first time after World War II.
Amidst the economic stagnation in Japan, employment and wage adjustments to new graduates and young people particularly have resulted in unemployment rates and non-reg-ular employees (including so-called ‘freeters’: non-regnon-reg-ular workers with freelance base) with lower wage levels than regular employees increased significantly in the past decades with complete liberalization of the labour market
The increased non-regular workers have largely affected household income levels, which have decreased household consumption. Disposable income had increased until the early 1990s, but it has been declining since the latter half of the 1990s, and real household con-sumption expenditure has also declined (Figure 1, 2). This is because tax burdens and other insurance payments have increased, while household income has hardly increased over the past two decades.
The long-term economic stagnation is related to the slump in personal consumption ex-penditure which accounts for about 60% of GDP (Fig. 3). Analysis of the correlation between private consumption and real GDP growth rate (quarterly basis) from 1995 to 2014 (second quarter) shows that the coefficient of determination is 0.545 and the coefficient is extremely significant at 1.192 (t value is 9.54).
The expansion of domestic demand, accompanying the increase in personal consumption, is an essential condition for stable economic growth in the medium to long term. Nonetheless,
95 97 99 101 103 105 107 109 111 113 115 1990 1992 1994 1996 1998 2000 2002 2004 2006 2008 2010 2012 2014 2016 (2015=100)
Note: S.A. real consumption by hoseholds Source: Household SUrvey by Mnistry of Internal Affairs Fig.1: Stagnated Household Consumption in Japan
the burden on households tends to increase in recent years. This is due to the increasing fiscal deficit and public debt. On the other hand, due to deregulation and various monetary easing in the past decades, income tax revenue has been reduced along with favourable treatment in tax systems for higher income groups and corporate sectors, which has resulted in heavier burden for households of lower income households. In addition, as the share of non-regular workers among the total labour population has significantly increased, the av-erage income of households has declined, which has constrained overall consumer spending in the past decades.
Income tax and insurance premiums in Japan are exceptionally borne by the lowest in-come group among developed countries. The minimum level of taxation in Japan is at a low level, which means that the low-income group is forced to pay a real burden compared to Europe (Table 1). It should be noted that Japan has a high level of minimum taxation on single households, which is rapidly increasing in recent years. Accordingly, the burden on low-income groups has become heavier in recent years.
As mentioned above, the tax burden on income taxes on the low-income group has in-creased, which has resulted in a decline in overall consumer spending along with the declin-ing disposable income. In addition, insurance premiums are a heavy burden on low-income
Source: Ministry of Welfare , and Labour, Ministry of Internal Affairs
Fig.2: Average Households Annual Income (Japan)
150 200 250 300 350 400 450 500 550 600 650 700 750 800 1985 87 89 91 93 95 97 99 2001 2003 2005 2007 2009 2011 2013 2015
Total Family with Children Aged (RHA)
(¥mn) (¥mn)
Source: Cabinet Office
brackets, not necessarily proportional to income levels, and this premium burden is also a major problem for low-income households5).
Furthermore, since it does not introduce a system that collects insurance premiums to-gether with tax as in European countries, unpaid ratio of insurance premiums is extremely high except for salaried workers. Thus, the payment delinquency rate of the national pen-sion is extremely high. This could be related to the expanpen-sion of the low-income group and the poor in recent years.
1-2. Deterioration of income distribution
In the past 20 years, Japan's income distribution has deteriorated rapidly, and the Gini coefficient is on an upward trend. The income-based Gini coefficient before income redistri-bution such as tax and social security has deteriorated dramatically from 0.349 in 1980 to 0.5536 in 2011 (Fig. 4)6).
In Japan, income distribution had improved equally until the 1970s under the progressive taxation system with the highest national income tax rate of 75% (93% with local income tax). However, in addition to globalization such as capital account and financial liberaliza-tion since the first half of the 1980s, the progssivity in income tax has been changed to more ‘flat’ taxation in Japan, as a similar system introduced in the US in the early 1980s. This is one of the most important factors that have deteriorated income distribution in Japan in the past decades. As the deterioration of income distribution has progressed in past decades, the low-income group has increased significantly in recent years (Figure 5-1).
As a result, the poverty rate (the ratio of households with less than half of the average
Sources: Author's preparation based on Toshiyuki MIzoguchi (1986) ; Kazufumi YUgami (2003) Fig.4: Gini Coefficient in Japan
0.2 0.3 0.4 0.5 0.6 0.7 1890 1910 1930 1954 1962 1971 1980 1986 1990 1995 1999 2002 2004 2006 2009
Before WWII Deterioration
Improvement
Post Redistribution
0.5536(2011)
Japan US UK Germany France
Couple + 2 Children 235.4 727.2 218.0 295.7 672.2
Couplle + 1 Couple 168.8 427.4 218 295.7 586
Couple 168.8 254.8 218.0 295.7 499.8
Single 121.1 122.3 198.2 156.0 167.3
Note: as of January 2016 Source: Ministry of Finance Table 1: Minimum Income of Levied Tax
income) in Japan has sharply risen to one of the highest levels among the OECD countries (Fig. 5-2). Japan is now one of the most unequal economies with high Gini coefficient among the OECD countries. Recently the rise in poverty rate of children is particularly conspicu-ous, and the poverty rate of a single parent accompanied by divorce is rising significantly. The relative poverty rate of a single working parent is 58%, one of the worst among the OECD countries (OECD, 2008). This is because the redistribution function of taxation and social security of Japan functions only in the household of the pension receiving generation of 65 years old or more compared with other countries, and it is hardly working in the working generation (Nakata, 2012). Therefore, reform of the tax system is also important in this aspect.
Background of deteriorating income distribution in Japan would be as follows:
First, there is an expansion of income disparity due to relaxation of progressive taxation since the 1980s. The maximum income tax rate in Japan has lowered Since 1984, and the maximum income tax has been lowered from 75% (including local taxes, 93%) up to 1983 to 40% (55% same) in 1999. The regessivity further strengthened by introducing consumption tax (3%) in 1989 and raising the consumption tax rate in 1999 (5%) (Fig. 6). The maximum corporate tax has been reduced constantly in the past decades, and reduced to 23.9% in 2015. In fact, large firms have enjoyed substantial amount of tax reduction measures,
Source: Ministry of Welfare, Labor
Note: 2012 for Hungary, Korea. Mexico and Japan. Source: OECD Fig.5-1: Poverty Rate in Japan
Fig.5-2: Poverty Rate [2011] 10 12 14 16 18 1985 1988 1991 1994 1997 2000 2003 2005 2009 2012 (%)
Poverty rate (Total)
Poverty rate (Children)
0 5 10 15 20 25 Ic el and Cz ec h De nm ar k N or w ay N et he rland s Fr an ce Lux em bo ur g Sl ov ak ia Ge rm an y Sl ove ni a Aus tr ia UK Sw ed en Ire la nd N ew Z ea la nd Sw itz er la nd Hungar y Po la nd Ca na da Es to ni a Po rt ug al Ita ly Au st ra lia Kor ea Sp ai n Gre ec e Japa n U SA Ch ile Tu rk ey Is ra el M exi co (%)
including special reduction schemes applied for those firms which have invested R & D ex-penditures. Therefore, corporate tax revenue has constantly reduced among the total tax revenue of the Government.
Until the early 1980s progressive taxation was properly made, thanks to tax classification of income tax with finely divided into 19 levels, according to income levels. However, the progressivity of income tax has been changed since the1980s, and now the tax classification has been simplified and some regressivity in terms of heavier burden for the lower income groups has become significant (Table 2).
Second, there is an expansion of asset gaps between the higher and low / middle income groups with relaxation of asset taxation such as inheritance tax and financial taxation. Since the Koizumi administration (2001-2006), the government has actively promoted afflu-ent tax incafflu-entives and wealth tax reductions of rich people. Until now, the reform of the government's tax system has called on securities tax incentives (extension of tax incentive period for earnings due to stock trading, etc.) and entrepreneurial support to mitigate the investment profit of individual investors for SMEs and venture support. However, the cur-rent government policy has not addressed the fundamental disparity, while taxation reforms that support rich and specific companies have been introduced especially under the current government.
Third, the reduction of regular employees/ workers and an increase in the share of non-regular workers, due to the economic downturn after the recession in 1998, as well as deregulation of the labour market (especially liberalization of temporary employees), have increased the income disparity between regular and non-regular workers. Particularly, ex-tremely low wage earners among non-regular workers have significantly increased, and the trend is particularly pronounced among young people.
Non-regular workers’ average annual income is normally less than 1/3 or 1/4 of that of regular employed workers. They cannot be entitled to have the employee's pension system, and other allowances from the companies, and there are tremendous differences in treat-ment with regular employees, which is one of the reasons for increasing income disparity among salaried employees. Such a significant change in the share of regular vs. non-regular
0 20 40 60 80 100 -12 -10 -8 -6 -4 -2 0 2 4 80 82 84 86 88 90 92 94 96 98 00 02 04 06 08 10 12 14 16 ( GDP, %) Fiscal Balance(LHA) Max. Income+Prov. Tax(RHA)
(%)
Corporate Tax(Max. RHA)
Sources: Ministry of Finance (Japan), IFS (IMF)
workers has resulted in overall stagnation of private consumption.
Recently, the proportion of non-regular employees to all workers has risen to about 40% (40.5% in 2014), which means that the form of lifetime employment in post-war Japan that has been generalized until the 1980s has collapsed. This is because the labour cost reduc-tions of companies accompanying the long-term economic downturn since the 1990s have rapidly expanded and the organization rate of labour unions has also declined rapidly in the past 20 years. It is also related to being difficult to reflect on improvement7). Therefore, the
Government should change labour market policies to address the disparity between regular and non-regular workers.
Fourth, constant trend of decline in households spending in the past decades with de-crease in general household income could be ascribed to a change in population structure with an increase in elderly households. Over the past two decades, the elderly population aged 65 years and over has increased rapidly, resulting in an increase in pensioners in the last decades, so the average income per household has decreased and the gap with working households is expanding. Since changes in age composition have a large influence on income distribution of each household, it is considered that the average income is lower than that of working households because there are many pensioners in the increase of old households8).
However, there is a tendency that the income disparity tends to be different as the age gets
Note: Limi1applied for 1974 & 1984. Gini Coeff. By Mizoguchi (1986) et al.
Sources: Ministry of Finance, Ministry of Welfare, Health and Labour, Mizoguchi (1986) Table 2: Income Tax ( Rates Japan)
1974 1984 1987 1988 1989 1995 1999 2007 2015 (National) Income (%) (%) (%) (%) %(万円) %(万円) %(万円) %(万円) %(万円) Tax Rates 10 10.5 10.5 10 10(~300) 10(~330) 10 (~330) 5 (~ 195) 5 (~195) 12 12 12 20 20(~600) 20(~900) 20 (~900) 10 (~ 330) 10 (~330) 14 14 16 30 30(~1,000) 30(~1,800) 30(~1,800) 20 (~ 695) 20 (~ 695) 16 17 20 40 40(~2,000) 40(~3,000) 37(1,800~) 23 ( ~900) 23 (~900) 18 21 25 50 50(2,000~) 50 3,000~) 33 (~1800) 33 (~1800) 21 25 30 60 40 (1,800~) 40 (1,800~) 24 30 35 45 (4,000~) 27 35 40 30 40 45 34 45 50 38 50 55 42 55 60 46 60 50 65 55 70 60 65 70 75 Max. rate ceiling
(¥10,000) 8,000 8,000 5,000 5,000 2,000 3,000 1,800 1,800 4,000 Regional Tax Max.(%) Max rate(%) 93 88 50 50 (Income+Regional) No. Categories 19 15 12 6 5 5 4 6 6 (Regional) (13) (14) (14) (7) (3) (3) (3) (1) (1) Min. Income for Tax 170.7 235.7 261.5 261.9 319.8 353.9 382.1 325 325
Gini Coefficient 0.344 0.337 0.356 0.372 0.4338 0.472 0.5263
78 76 65 65 50
13 10 10
15
higher. For example, the income disparity among the households aged 70 and over tends to continue to shrink since 1989, while there is a tendency to widen the gap among the younger generation under the age of 30. This could be explained by increasing share of non-regular workers in the working population.
Fifth, low-income groups accompanying the increase of single-person households are in-creasing. Particularly, the rapid increase in "working poor" whose income is very low even when working such as non- regular employees or temporary work resulted in the expansion of disparity between generations.
One of the most serious problems associated with the recent expansion of income dispar-ities is the impact on long-term decline in economic growth rate. Due to the shift of major revenue sources from direct tax to indirect taxes since the 1990s, the direct tax rate such as income tax has drastically decreased compared to other developed countries, even compared with that of the United States.
Tax revenue has declined in the past decades due to lowering income tax and corporate tax which is subject to economic growth. Long-term economic stagnation has caused a sig-nificant delay and deduction for corporate tax payment. Corporate tax revenue has been declining due to several preferential and incentive measures, including tax exemption and various corporate incentives such as promotion of depreciation and amortization.
However, due to such measures for corporate tax reductions/ exemption, the national tax revenue declines, and its tax burden for general households has increased due to the hike of insurance premium for lower income groups, which made households consumption de-creased. This trend has become more apparent in response to a decline in the share of regular workers and an increase in recruitment of non-regular workers and part time workers, and furthermore, the average salary level has declined under the long-term stagnation of the economy,
The disposable income of households of lower and middle-income households, which ac-count for most the population has decreased. As a result overall consumer spending has been sluggish in the past decades. Thus, we may not expect stable economic growth without expanding personal consumption that accounts for about 60% of GDP over the medium to long term.
2. Changes in Tax System and Economic Growth
2-1. Deterioration of income distribution due to "flattening" income tax rate and its effects on growth rate
Together with decrease in income tax and corporate tax, expenditures on welfare services and pension have rapidly increased under aging population, which has put significant pressure to expand larger budget deficit in Japan. It should be noted that the primary bal-ance was in equilibrium at the beginning of the 1990s, but it deteriorated rapidly in the past decades. Under these circumstances, as the movement to expand the tax burden is becoming more generalized, the burden on the higher income households and corporate sector has decreased, while that of the middle and low-income people increased9). This is because
personal income taxation over the past 20 years tends to decline, especially after the mid-1990s, and as a result, income disparity before taxation tends to expand.
In addition, the regessivity in income tax has been strengthened by the introduction of consumption tax since 1989. From the 2000s onwards, in addition to alleviating asset taxa-tion (including securities taxataxa-tion) to the wealthy people, abolitaxa-tion of deductaxa-tion of salaried income earners, raised from 5% of consumption tax to 8% from April 2014 and expected to be raised to 10% in 2018.10) Thus, the tax burden of most households is expected to further
increase, which will accelerate declining disposable incomes and sluggish consumption. It has been historically proven that there is positive correlation between the progressive-ness of income tax and economic growth rate in Japan. As shown in Fig.7, the trend of the highest income tax rate and the GDP growth rate in Japan's historical data indicates a positive correlation between GDP growth and income tax rate with high significance (t-value is 5.56) during 1956-2016. It shows a positive correlation of 1.49 with the Durbin-Watson ratio in the regression equation given below
The result of analysis clearly indicates that the growth rate has been relatively high during the period which the income tax rate was high10). In other words, when strengthening
progressive taxation (raising the maximum tax rate), the growth rate is high, and it was the period when progressive rate of income tax was changed to more regressive system that the growth rate tends to decline in the past decades. Therefore, it could be stated that the GDP growth rate has declined with the expansion of income disparity.
On the other hand, as the progressivity of income tax is relaxed and flattened, the Gini coefficient showing the deterioration of income distribution also rises, exceeding 0.5263, 0.5 in 2005 and 0.5566 in 2011, further deteriorating income distribution. Along with that, the economic growth rate also tends to decline (Figure 8).
0 20 40 60 80 100 -6 -4 -20 2 4 6 8 10 12 14 56 58 60 62 64 66 68 70 72 74 76 78 80 82 84 86 88 90 92 94 96 98 00 02 04 06 08 10 12 14 16 (%, GDP)
GDP Growth (LHA) Max. Income・Regional Tax rate (RHA) (%)
Corporate Tax(RHA) Source: Ministry of Finance, Cabinet Office,
[1956-2016]
Max Income Tax ⇒ GDP Growth
yt = 0.1398xt -6.276 + + et
(6.039) (-3.533)
yt :GDP growth, xt : Max.Income Tax
R2=0.3820 (t-value in parenthesis)
R = 0.6180 DW: 1.488
2-2. Changes in tax revenue structure: Decrease in the shares of corporate tax and income tax with increase in household burden of consumption tax
Recently the absolute amount of income tax and the ratio to tax revenue have declined markedly (Fig. 9, 10). The share of income tax and corporate tax revenue has decreased in the past 20 years and the proportion of consumption tax which is indirect tax has been drastically increased and the share of income tax among the total tax revenue 2012 was 29.8%, and that of indirect tax including consumption tax has risen to 42.8%. In addition, the share of corporate tax revenues was 36.6% in 1988, but it decreased to 19.5% in 2012.
This can be said that the consumption tax is supplementing the decreasing total tax rev-enues that are associated with institutional flaws, which have accelerated the decrease in tax collection from self-employed and/ or corporate sectors. Due to the economic downturn since the 1990s, the deficit companies, so-called deficient companies have increased signifi-cantly. Accordingly, the proportion of those firms which are exempted from tax payment has increased significantly since 2000s, which has resulted in the situation where less than 30% of corporations are paying corporate tax11). This trend has spurred the sluggish corporate tax -10 -5 0 5 10 15 0.2 0.3 0.4 0.5 0.6 1956 1968 1974 1986 1990 1996 2000 2003 2005 2008 2011 0.5536(2011) GDP(RHA) Gini(LHA) (y/y, %)
Note: Gini coefficients are before tax Sources: Ministry of Wealth Health and Labour, Cabinet Office
Source: Ministry of Finance
Fig.8: GDP growth & Gini coefficient (Japan)
Fig.9: Fiscal Revenue (National) in Japan
0 10,000 20,000 30,000 40,000 50,000 60,000 70,000 1975 1980 1985 1990 1995 2000 2005 2010 2015 Indirect Corporate Income (¥bn)
revenue by further increasing the number of deficient companies due to the deferrals ex-tended from 5 years to 7 years due to the revision of the tax law in 2004. Such a decline in tax revenues will accelerate the budget deficit expansion, which in turn leads to an increase in the public burden mainly on middle - income earners.
The so-called "trickle-down" argument has been advocated since the Reagan administra-tion; if the tax for rich people and corporate tax is reduced, consumption of the rich and corporate earnings will expand, which will eventually improve overall income levels and expend consumption. However, these assumptions and expected results have not been real-ized in the past decades in any country, including the US and Japan. Tax reduction for the rich and firms does not necessarily lead to the improvement of income level of employees and the increase of income of low-income group, and this view has already been denied by the facts in the US and Japan12).
Contrary to the "trickle down" assumption, the income gap between the rich and poor has widened, and the low-income groups have not gained the share of economic growth in sever-al countries. On the other hand, the Japanese government has introduced seversever-al policies to decrease corporate tax rate and other burden, to keep competitiveness in investment against other Asian countries. However, the premise of such a discussion is not correct. Since Asian countries are at the developing stage and policies that should attract further direct investment, the tax rate is kept low, but developed countries such as Japan or even the US may not necessarily follow such a direction. In addition, most of the large firms in Japan have not paid much corporate tax with introduction of favourable tax reduction schemes in the past13).
In the first place, private investment and overseas expansion are not necessarily decided by the corporate tax level of the country concerned, but overseas investment is attracted by factors other than corporate tax factors such as the size of the investee's market and inex-pensive labour cost in the potential countries to be invested.
As social security expenditures and pensions expanding with the rapid population aging, the Japanese government should increase tax revenue and pension contributions, as well as social insurance premium, and this would require increase in the share of regular-workers, while decreasing the share of non-regular employment, with labour market reforms to
ad-Note: Shares amng the total tax revenue Source: Monistry of Finance
Fig. 10: Income /Corporate Tax vs. Consumption Tax
5 15 25 35 45 55 1980 1983 1986 1989 1992 1995 1998 2001 2004 2007 2010 2013 2016 Corporate Indirect Income (%) Consumption
dress the disparity between regular and non-regular workers.
The level of the consumption tax rate in Japan cannot be simply be compared with that of Western countries, because almost all taxable goods such as food items are taxed in Japan, while exemption and reduction of consumption tax are generally introduced in Europe. Therefore, the consumption tax in Japan has become high. The proportion accounts for a ratio of consumption tax in Japan is comparable to that of the EU countries. In addition, because of the heavy consumption tax on daily necessities, it places a heavy burden espe-cially for low-income groups.
Since Japan adopts book-based consumption tax rather than invoice-based VAT, the tax burden of individual companies is unclear and taxpayers' benefits from tax payment would be unclear. There are many problems such as tax evasion, which should be collected proper-ly. In addition, simple taxation methods introduced for the benefit of SMEs, which tend to underestimate the tax amount to be levied, could be one of the factors that keep corporate tax revenue low14).
3. Analysis on the Effects of Changes in Income Tax
and Consumption Tax on GDP Growth
As shown in the previous chapter, the decline in disposable income of households has re-sulted in sluggish consumer spending, which accounts for more than 60 % of the national economy. Decrease in the overall personal consumption had an adverse effect on economic growth. This chapter will examine how much the economic growth rate could be achieved through an increase in personal consumption by improving income distribution.
Statistical Survey on Private Salary Actual Situation in 2013 (National Tax Agency) indi-cates that the type of employment, the number of irregular workers has increased signifi-cantly to 5.3%, compared to 1.5% increase in regular employees. Therefore, the average annual income has declined to the non-regular employee minus 0.1% against the 1.2% in-crease in the case of regular employees. In addition, while the average inin-crease in annual income for income group with annual salaries of 1 million yen or less remains only 7%, that of rich households with annual income of 25 million yen or more increased by 40%. Income gaps between the rich and poor are increasing more and more like this.
Although the expansion of income disparity between rich and poor families may not nec-essarily put a negative impact on the economic growth rate in the short term, it may restrict the economic growth rate through various routes over the medium to long term15). Therefore,
in this section, it is shown that expansion of income gap constrains economic growth rate in the medium to long term and that correcting income gap promotes rise of economic growth rate.
Therefore, the simulation analysis in this section estimates the consumption of house-holds in each income group, household burden including tax rate and insurance premium as well as social security benefits. Thus, the effects of changes in income tax on private con-sumption on GDP growth could be estimated.
The consumption tax burden of low-income households generally tends to be higher than that of high-income brackets because the consumption tax imposes a uniform tax rate on all
income groups. Therefore, it is pointed out that raising the consumption tax rate generally strengthens the regressivity of the consumption tax16).
3-1. The Effects of Changes in Income Tax and Social Insurance on Consumption and Growth
3-1-1 Regressivity of income tax / social insurance payments burden
Although the total tax burden in Japan is said to be relatively low among advanced countries, it is never quite few if the burden of insurance premiums in households is includ-ed in the total payments by households. Since insurance premiums have been raisinclud-ed recent-ly, burdens have increased especially in low-income groups, while burdens of insurance premiums are lower than income tax in the highest income group. In other words, the total amount of direct taxes / insurance premiums in the lowest income group is high in Japan, while that of wealthier stratum has relatively low, and thus the total burden of tax and in-surance payments is regressive.
The decline in consumption expenditure, due to tax and insurance burdens of middle and low income households, is a major obstacle to the stable growth of the national economy. Looking at recent trends in household consumption in Japan, households with an annual income of less than 2 million yen have a propensity to consume more than 1 and these households are in deficit. Young people with annual income less than 2 million are increas-ing, and the average household spending has decreased significantly in the past decades. The share of the middle and low income groups is overwhelmingly large among the total number of households, and recently low income households are rapidly increasing, and burdens of these groups are becoming heavier, which would have constrained consumer spending in the past years.
The current tax and insurance premium burden for the lowest income group has been rising, while that of high income group has not risen but declined (Fig.11). This shows the fact that the regessivity of income tax/ insurance premium burden has been strengthened. Furthermore, the burden on the low-income group is greatly increased annually, in terms of effective tax rate, including the social insurance premium, with the income tax / local tax,
5 10 15 20 25 30 1 2 3 4 5 6 7 8 9 10 11 12 13 14 15 16 17 1984 2001 2006 2013 (%)
Note: Figures are the sum of Total income tax, insurance; categorized as : 1st:~ 1 mn; 2~12 groups : ¥2.5~8 mn; 13th、14th ¥8~10 mn; 15th ¥10~12.5mn、16th ¥12.5~15mn; 17th : over 15mn Source: Household survey, Ministry of Internatal Affairs and Communications
when looking at the burden every year by income group, as compared with earlier year of 1984 (right after the start of progressive progress of income tax). It indicates that regressiv-ity has become a common feature in the tax/ insurance schemes in Japan in the past decades. Also, over the long term, the indirect tax rate such as consumption tax as against direct tax (income tax / local tax) is increasing, which has resulted in unequal income distribution in Japan.
The average propensity to consume (consumption expenditure / disposable income) of all households is 72.5% on average, while it is 231% in the lowest income group (1.2 million yen, less than 100,000 yen a month). The propensity to consume for that group of annual incomes less than 1.8 million yen is over 100%. In general, there is a structure that these layers of lowest income groups depend on debt. On the other hand, the proportion of direct tax (in-come tax, inhabitant tax) and insurance premium burden in households of the richest group is lower than that of annual income of 12 to 13.2 million yen (monthly income 100 to 105 thousand yen).
For example, looking at the direct tax (income tax) and the insurance payments by the annual income groups, the total rate of burden for households less than 3 million yen is higher than that of middle and high income groups (Fig. 12).
Moreover, the proportion of social insurance income in Japan accounts for 41% (2011) of the total burden for the households, which is one of the highest countries among the OECD countries. Therefore, it is very important to look at the household burden by taxable income group that combines tax and social insurance payments.
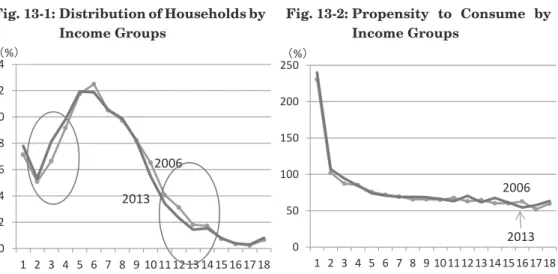
The proportion of the low-income group significantly increased from 2006 to 2013, and that of the middle-income group decreased (Figure 13-1). However, the propensity to con-sume in each income group has hardly changed significantly (Fig. 13-2).
Thus, the effects of disposable income by income groups may not have a big influence on marginal propensity to consume. The next section will deal with analysis of the effects of strengthening the progressivity of direct taxes and insurance premium burdens on general expenditure of household, as well as GDP growth.
0 5 10 15 20 25 30 35 1 2 3 4 5 6 7 8 9 10 11 12 13 14 15 16 17 18 Direct Tax Social Insurance (%)
Source: Ministry of Internaal Affairs and Commnications
3-1-2 Simulation in progressivity of income tax and insurance payments on con-sumption and growth rate
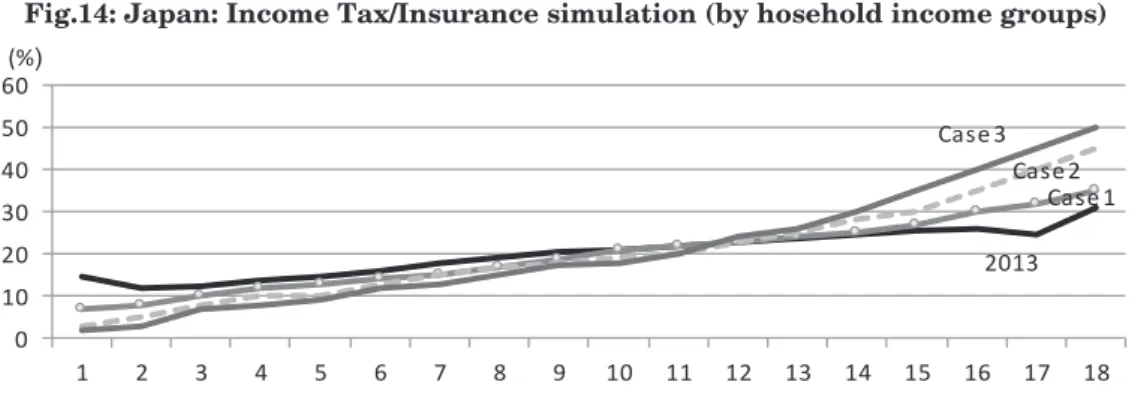
If income tax system were to be changed to strengthen progressivity and income distribu-tion is improved, GDP growth rate should rise as household consumpdistribu-tion increases. The analysis is made to have simulation of the effects of the change in disposable income of households on the total consumption expenditure by income group and the influence on GDP growth rate19).
In this analysis, based on the household survey of Ministry of Internal Affairs and Communications in 2013, the total amount of income tax, provincial tax and social insur-ance premiums are classified by income groups. The simulations analyses are based on the average monthly consumption tendency of each income class in 2013 and do not consider changes in the marginal propensity to consume for income growth in each income class. In addition, as described below, by modifying the burden rate for each income group to strengthen the progressivity, the burden of total direct tax / insurance premium on the low-income group relieved compared with the current system, increasing the burden on the high-income group. The current total rate of income tax and social insurance, based on the actual expenditure are: lowest income class: 11.9%; highest income class: 30.8%. The pro-gressivity is different in each case as follows:
Case 1 (lowest income class: 7%; highest income class: 35%) Case 2 (highest income class: 3%, lowest income class: 45%) Case 3 (lowest income class: 2%; highest income class: 50%)
Source: Ministry of Internal Affairs & Communication Source: Ministry of Internal Affairs & Communication Fig. 13-1: Distribution of Households by
Income Groups
Fig. 13-2: Propensity to Consume by Income Groups 0 2 4 6 8 10 12 14 1 2 3 4 5 6 7 8 9 101112131415161718 (%) 2006 2013 0 50 100 150 200 250 1 2 3 4 5 6 7 8 9 101112131415161718 (%) 2006 2013
0 10 20 30 40 50 60 1 2 3 4 5 6 7 8 9 10 11 12 13 14 15 16 17 18 (%) Case1 Case2 Case3 2013
Source:AUthor's Simulation based on the Household surevey in Japan
Notes: 1. Simulation on average consumption of household per month based on the desposable income and expenditure in 2013
2. GDP growth is based on the share of private consumption among the GDP in Japan.
Sources: Author's calculation based on the data, 'Households Monthly Income & Expenditure', Minsitry of Internal Affairs and Communication..
Notes: 1. Simulation on average consumption per household (per month) based on the desposable income and expenditure in 2013
Tax/Insurance payments are based on the total income and expenditure per household by income groups
2. GDP growth is based on the share of private consumption among the total GDP.
Source: Author's calculation based on ' Total Revenue and Expenditure of Households per month', Ministry of Internal Affairs.
Fig.14: Japan: Income Tax/Insurance simulation (by hosehold income groups)
Table 3-1: Effects of Progressive Tax Rate on Households Consumption
Table 3-2: Effects of Progressive Tax Rate on GDP/Consumption
1 2 3 4 5 6 7 8 9
Average Exp. per month (Yen) [2013] 246,741 245,703 253,656 263,182 267,686 290,640 314,592 348,950 385,088 Share of Households (%) 7.8 5.3 8.1 9.8 11.9 11.9 10.5 9.9 8.2 Direct Tax & Insurance of Total Income (%)] [2013] 14.5 11.9 12.3 13.6 14.6 15.9 17.6 19.2 20.6
Case 1 7 8 10 12 13 14 15 17 18.5
Case 2 3 5 8 10 10 13 15 17 18
Case 3 2 3 7 8 9 12 13 15 17.5
Average Exp. per month (Yen)
Case 1 268,440 256,669 260,223 268,158 272,667 297,375 324,541 358,643 394,466 Case 2 279,986 265,038 266,005 274,253 282,069 300,832 324,541 358,643 396,886 Case 3 282,873 270,618 268,897 280,347 285,203 304,290 332,178 367,285 399,306
10 11 12 13 14 15 16 17 18
Average Exp. per month (Yen) 389,411 407,312 454,935 450,049 506,189 462,987 442,807 505,645 752,775 Share of Households (%) 5.5 3.4 2.3 1.4 1.5 0.8 0.4 0.3 0.8 Direct Tax & Insurance of Total Income (%) 20.9 21.7 22.7 23.5 14.6 25.6 26.0 24.5 30.8
Case 1 21 22 23 24 25 27 30 32 35
Case 2 19 20 23 25 28 30 35 40 45
Case 3 18 20 24 26 30 35 40 45 50
Average Exp. per month (Yen)
Case 1 388,897 405,772 453,181 446,908 503,231 454,361 418,656 455,629 707,067 Case 2 398,742 416,176 453,181 441,027 483,101 435,688 388,752 402,026 598,287 Case 3 403,665 416,176 447,296 435,147 469,682 404,568 358,848 368,524 543,898
Household
Spending(%) Consumption (Yen) Increase in tax/Insurance (%) ΔGDP(%) (Tax・Insurance)(%)Δrevenue
Current 319,170 - -
Case 1 324,228 1.585 0.946 4.8 Case 2 327,579 2.634 1.573 15.2 Case 3 330,523 3.557 2.124 22.8
The simulation results show that the contribution of consumption expenditure to GDP growth rate is expected to increase 0.95%, 1.57%, 2.12% in Case 1, Case 2, and Case 3 respectively (Table 3-1, 3-2)22). Based on the assumption that the proportion of personal
consumption in GDP is 58.2% (2013), private consumption under Case 3 is expected to achieve the highest growth20). The results clearly indicate that the increase in households’
consumption would contributes to the GDP growth rate with the progressivity strengthen-ing. These simulations are also useful to examine how tax revenue and social insurance premium income would change by proposed progressivity of income tax and insurance pre-miums, and they will contribute to an increase in the government revenue.
In Case 1, the total amount is only 4.8% higher than the current total tax / insurance total (estimated from non-consumption expenditure), while it increases significantly to 22.8% in Case 3. Thus, improvement of income distribution by strengthening the progressiveness to increase the burden on the wealthy people and to reduce the burden on the middle and low income group as compared with the current system would increase in GDP growth rate through expanding overall consumption expenditure.
The estimation in Case 3 shows the burden on the middle and low income groups is kept low, while the burden on the higher income groups would increase and the progressivity is most enhanced, as compared with Case 1 and Case 2. Among three cases, Case 3 would be most effective in increasing the overall household consumption expenditure.
The above simulation results show that the total consumption expenditure of the house-holds will increase greatly, if more progressive income tax and insurance premium system were to be introduced in Japan21). It should be noted here that only the households with two
people or more are analysed, and single households are not taken into consideration from statistical constraints in this analysis. Therefore, considering the recent trend of increase in single-person households in low income groups, the overall household consumption expan-sion and the positive effect on growth rate would be greater with introduction of progressive tax system used in the simulation.
In addition, single households that are not subject to this analysis include majority of non-regular workers, especially young non-regular workers, so that the actual income dis-tribution is worse than the above assumptions. Therefore, further improvements in income distribution would be expected than the simulation results above.
From the above analyses, to increase in GDP growth, it is important to strengthen pro-gressive taxation with less burden on the low-income households, while putting relatively heavier burden for the high-income groups thereby increasing the total consumption of households. This would lead to improvement in the disposable income of all households, which could promote economic growth through expanding the overall consumption.
It is also to be noted that a change in the tax system with progressivity would further
increases in government revenue, and improve the budget deficit. It is expected
that the consumption expenditure as well as the government revenue increase can be ex-pected, which will contribute to the improvement of the general fiscal balance of the government.
In addition, policy measures such as raising the upper limit of minimum income tax will be necessary, in addition to mitigation measures in the low-income class of the current
premium burden. Particularly, insurance premium burden for low income groups should be reduced, as the current share of its burden is very large, which has led to a decrease in disposable income. With rapid expansion of irregular labour, it will also be necessary to re-consider that the premise of the system itself is collapsing as the rate of non-payment for national insurance increases.
3-2. Problems of raising consumption tax and the impact on economy
As shown in the following discussions, the tax burden increases the regressivity that the tax burden on low-income groups increases as compared with that of high-income people, and overall consumption expenditure decreases accordingly.
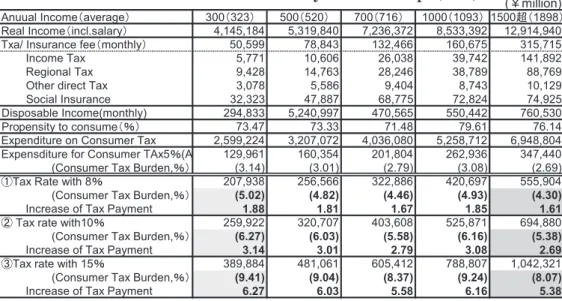
3-2-1 Estimated burden of consumption tax : standard household by income class
Using household survey on standard households (4 family and 2 children) published by the Ministry of Internal Affairs and Communications in 2013, Consumption tax burden was calculated from income and consumption expenditure of households of ¥3 million, ¥5 million, ¥7 million, and ¥10 million and over ¥15 million (Table 3). According to this, at the con-sumption tax rate of 5% by 2013, households with an annual income of 3 million yen are 3.1%, while households with more than 15 million yen are only 2.7%.
In the case where the consumption tax rate raised to 8%, the consumption tax- burden rate for households with annual income of 3 million yen is estimated to be 5.0%, while that for more than 15 million yen will be lower with 4.3%. In addition, when the consumption tax rate is raised to 10% and 15%, the burden for households with annual income of 3 million
(¥million)
Anuual Income(average) 300(323) 500(520) 700(716) 1000(1093) 1500超(1898)
Real Income(incl.salary) 4,145,184 5,319,840 7,236,372 8,533,392 12,914,940
Txa/ Insurance fee(monthly) 50,599 78,843 132,466 160,675 315,715
2 9 8 , 1 4 1 2 4 7 , 9 3 8 3 0 , 6 2 6 0 6 , 0 1 1 7 7 , 5 x a T e m o c n I 9 6 7 , 8 8 9 8 7 , 8 3 6 4 2 , 8 2 3 6 7 , 4 1 8 2 4 , 9 x a T l a n o i g e R 9 2 1 , 0 1 3 4 7 , 8 4 0 4 , 9 6 8 5 , 5 8 7 0 , 3 x a T t c e ri d r e h t O 5 2 9 , 4 7 4 2 8 , 2 7 5 7 7 , 8 6 7 8 8 , 7 4 3 2 3 , 2 3 e c n a r u s n I l a i c o S Disposable Income(monthly) 294,833 5,240,997 470,565 550,442 760,530 Propensity to consume(%) 73.47 73.33 71.48 79.61 76.14
Expenditure on Consumer Tax 2,599,224 3,207,072 4,036,080 5,258,712 6,948,804
Expensditure for Consumer TAx5%(A 129,961 160,354 201,804 262,936 347,440
(Consumer Tax Burden,%) (3.14) (3.01) (2.79) (3.08) (2.69)
①Tax Rate with 8% 207,938 256,566 322,886 420,697 555,904
(Consumer Tax Burden,%) (5.02) (4.82) (4.46) (4.93) (4.30)
Increase of Tax Payment 1.88 1.81 1.67 1.85 1.61
② Tax rate with10% 259,922 320,707 403,608 525,871 694,880
(Consumer Tax Burden,%) (6.27) (6.03) (5.58) (6.16) (5.38)
Increase of Tax Payment 3.14 3.01 2.79 3.08 2.69
③Tax rate with 15% 389,884 481,061 605,412 788,807 1,042,321
(Consumer Tax Burden,%) (9.41) (9.04) (8.37) (9.24) (8.07)
Increase of Tax Payment 6.27 6.03 5.58 6.16 5.38
Note: Propensity of Consume may be changed due to the consumption tax rise.
Source: Author's calculation based on ' Total Revenue and Expenditure of Households per month', Ministry of Internal Affairs
yen would rise to 6.3% and 9.4%, respectively, and that for those households exceeding 15 million yen are 5.4% and 8.1%, respectively. Thus, the burden of low income bracket greatly exceeds that of the higher-income groups, and regessivity of higher consumption tax is clearly shown.
To mitigate such additional burden for the lower income households, it is necessary to reduce the social insurance premium burden on low income groups from the government and the reduction and exemption of direct taxes, especially for the lowest income group. Without it, overall household consumption will stagnate, which may affect the country's medium- to long-term economic growth rate.
3-2-2 Simulation of consumption tax burden by income category/ groups
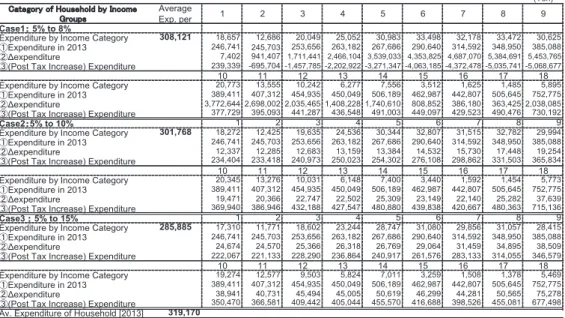
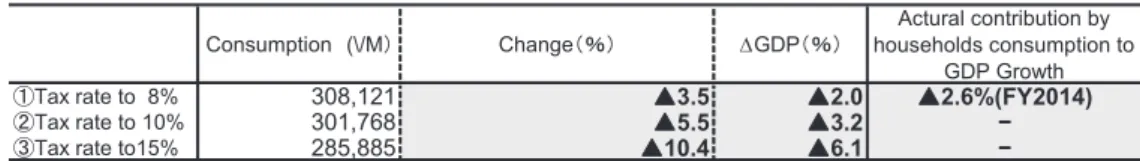
Regarding the effects of the consumption tax hike on households’ consumption are esti-mated in case of raising to (i) 8%, (ii) 10%, and (iii) 15%, respectively based on the 5% pro-pensity to consume to 2013 by income class (18 categories). The effects of on household consumption are shown in Table 5-1, where significant reduction of households expenditures are estimated by the hike of consumption tax from 5% to higher tax rates, from ¥319,170 to ¥308,121 with 8%, ¥301,768 with 10%, and ¥285,885 with 15%, respectively.
Note: Propensity to concume for each income cattegory is based on the 2013 figure (consumption tax with 5%).
The simulation is not based on the marginal propensity to consume for each income category, due to significant volatility in each year.
Source: Author's calculation based on ' Total Revenue and Expenditure of Households per month' , Ministry of Internal Affairs.
Table 5-1: Effects of Increse in Consumer Tax Rate on Expenditures by Income Groups (Yen) Average
Exp. per 1 2 3 4 5 6 7 8 9
Case1: 5% to 8%
Expenditure by Income Category 308,121 18,657 12,686 20,049 25,052 30,983 33,498 32,178 33,472 30,625 ①Expenditure in 2013 246,741 245,703 253,656 263,182 267,686 290,640 314,592 348,950 385,088 ②Δexpenditure 7,402 941,407 1,711,441 2,466,104 3,539,033 4,353,825 4,687,070 5,384,691 5,453,765 ③(Post Tax Increase) Expenditure 239,339 -695,704 -1,457,785 -2,202,922 -3,271,347 -4,063,185 -4,372,478 -5,035,741 -5,068,677
10 11 12 13 14 15 16 17 18
Expenditure by Income Category 20,773 13,555 10,242 6,277 7,556 3,512 1,625 1,485 5,895 ①Expenditure in 2013 389,411 407,312 454,935 450,049 506,189 462,987 442,807 505,645 752,775 ②Δexpenditure 3,772,644 2,698,002 2,035,465 1,408,228 1,740,610 808,852 386,180 363,425 2,038,085 ③(Post Tax Increase) Expenditure 377,729 395,093 441,287 436,548 491,003 449,097 429,523 490,476 730,192
Case2:5% to 10% 1 2 3 4 5 6 7 8 9
Expenditure by Income Category 301,768 18,272 12,425 19,635 24,536 30,344 32,807 31,515 32,782 29,994 ①Expenditure in 2013 246,741 245,703 253,656 263,182 267,686 290,640 314,592 348,950 385,088 ②Δexpenditure 12,337 12,285 12,683 13,159 13,384 14,532 15,730 17,448 19,254 ③(Post Tax Increase) Expenditure 234,404 233,418 240,973 250,023 254,302 276,108 298,862 331,503 365,834
10 11 12 13 14 15 16 17 18
Expenditure by Income Category 20,345 13,276 10,031 6,148 7,400 3,440 1,592 1,454 5,773 ①Expenditure in 2013 389,411 407,312 454,935 450,049 506,189 462,987 442,807 505,645 752,775 ②Δexpenditure 19,471 20,366 22,747 22,502 25,309 23,149 22,140 25,282 37,639 ③(Post Tax Increase) Expenditure 369,940 386,946 432,188 427,547 480,880 439,838 420,667 480,363 715,136
Case3:5% to 15% 1 2 3 4 5 6 7 8 9
Expenditure by Income Category 285,885 17,310 11,771 18,602 23,244 28,747 31,080 29,856 31,057 28,415 ①Expenditure in 2013 246,741 245,703 253,656 263,182 267,686 290,640 314,592 348,950 385,088 ②Δexpenditure 24,674 24,570 25,366 26,318 26,769 29,064 31,459 34,895 38,509 ③(Post Tax Increase) Expenditure 222,067 221,133 228,290 236,864 240,917 261,576 283,133 314,055 346,579
10 11 12 13 14 15 16 17 18
Expenditure by Income Category 19,274 12,577 9,503 5,824 7,011 3,259 1,508 1,378 5,469 ①Expenditure in 2013 389,411 407,312 454,935 450,049 506,189 462,987 442,807 505,645 752,775 ②Δexpenditure 38,941 40,731 45,494 45,005 50,619 46,299 44,281 50,565 75,278 ③(Post Tax Increase) Expenditure 350,470 366,581 409,442 405,044 455,570 416,688 398,526 455,081 677,498 Av. Expenditure of Household [2013] 319,170
3-2-3 Impact of raising consumption tax on consumption and GDP growth
The estimated figures of negative impact of the consumer tax hike on GDP growth rate through reduction of private consumption are shown (Table 5-1, 5-2). The actual GDP growth contribution by household consumption in FY2014 was significantly negative, due to the increase in the consumption tax from 5% to 8%. This actual effect on GDP growth (▲2.6%: by contribution to GDP growth) is broadly in line with the estimated figure of mi-nus 2% (Table 5-2). The actual negative effect of the hike of consumption tax rate was sig-nificant in FY2014, and this would clearly indicate that regressivity of consumption tax, which would put significantly negative effect on growth rate. Therefore, it would be crucial to introduce more progressive tax schemes with less burden for the lower income households to change the current trend of increasing poor families and very high percentage of ‘poverty rates’, which is one of the highest in the OECD countries.
3-2-4 Inequality of tax burden with regressive tax systems
As an argument for justification of the consumption tax hike, the aspect that the
con-sumption tax is borne equally by the broad population of the people is emphasized25).
However, it should be noted that the increase in indirect taxes such as consumption tax would result in strong impact on the income distribution with its regressivity of indirect tax (incl. consumer tax) than direct taxes.
It is pointed out that the consumption tax rate (or VAT) of the advanced countries in Europe is generally higher, while the consumption tax rate of Japan is still lower in terms of tax rate, and therefore it should be raised. However, in European countries, especially in Northern Europe, the income distribution function is much more effective compared to Japan, and various low tax reductions and redistribution by improvement of pension system are carried out for relative low income group in Sweden and other Nordic countries. Also, even in countries with relatively high consumption tax rates like the UK, consumption tax (value added tax, VAT) for food items and daily goods expenditure is exempted or reduced, while nearly every commodity, including foods are subject to be levied equal rate of con-sumption tax in Japan.
It is also to be noted that the share of consumption tax (VAT, indirect tax) in the total tax revenue is already comparable to that of European countries even when the consumption tax is 5% until 2013 in Japan. In addition to general accounts, the proportion of "consump-tion tax" (consump"consump-tion tax plus customs duty and other taxes on the individual indirect tax)
Consumption (\/M) Change(%) ∆GDP(%) households consumption toActural contribution by GDP Growth
①Tax rate to 8% 308,121 ▲3.5 ▲2.0 ▲2.6%(FY2014)
②Tax rate to 10% 301,768 ▲5.5 ▲3.2
-③Tax rate to15% 285,885 ▲10.4 ▲6.1
-Note: Simulation on average consumption per household (per month) based on the desposable income and expenditure in 2013
Source: Author's calculation based on ' Total Revenue and Expenditure of Households per month', Ministry of Internal Affairs.
in the national tax revenue including special accounts was 39.8% (FY 2013) in Japan. Therefore, if the tax exemption and / or reduced rates were not introduced, when consump-tion rate is to be raised from 8% to 10% in the future, the proporconsump-tion of consumpconsump-tion tax in the total tax revenue will be very high, which will increase the burden on households, espe-cially middle and low income groups. Accordingly, it would be a constraint for GDP growth rate.
Therefore, raising the consumption tax rate on all products and services, without intro-ducing consumption tax exemption and/or reduced rates of consumption duties for daily foods and essential goods will further increase the burden on the low-income groups, causing a major impediment to economic growth.
Furthermore, the essential problem is that the Japanese consumption tax is a book sys-tem rather than an invoice syssys-tem based on VAT which is common in Europe. According to the current system, the transparency of the intermediate accounting process of each trader is low and inaccurate, so there is a tendency not to collect tax payments which should be properly taxed under a more transparent VAT system.
Moreover, the consumption tax has introduced a special measure of exemption of con-sumption tax for business entities with annual sales of a fixed amount (10 million yen) 26). In
addition, because the upper limit of the application of the simple taxation system of busi-nesses is significantly higher than that of European countries, and that many Japanese firms have escaped taxation. Thus, corporate taxes to be originally collected are not paid to the tax authority.
It is inherently difficult to cover expenditure on social security expenditures expected to increase27). In addition to these technical problems, it is difficult to cover the absolute
in-crease in social security expenses with consumption tax burden. Therefore, there is no real-istic means other than strengthening the collection of direct taxes and social insurance premiums with more fair system of burden of personal income tax and corporate tax rates28).
4. Conclusion
In recent years, the tax burden of low-income households has further expanded, while consumption tax rate is expected to rise, because of deterioration of the fiscal balance. Meanwhile, full-time employees and regular workers are decreasing, due to deregulation of labour markets such as relaxation of temporary workers dispatching temporary employed workers. As a result, the low-income group is rapidly increasing.
General household consumption will continue to be declining with a further rise in the consumption tax rate29). Under these circumstances, it would be inappropriate to increase
the burden by raising direct insurance premiums on middle-income and low-income earners, from the viewpoint of medium- and long-term growth. This will lower even the more dispos-able income of the middle and low income brackets, which will have constraint for the GDP growth rate through a slump in overall private consumption.
Therefore, as the analysis result of this paper shows, it is the most important task to strengthen the progressive income tax to achieve stable economic growth in the medium to long term and improve the fiscal balance along with the increase in tax revenue30). Also, if
the consumption tax is raised without considering differential tax rates with tax cut for foodstuffs and daily commodities, household consumption would significantly reduce, and the GDP growth rate would decline as seen in the sharp decline in GDP growth rate in 2014, due to the hike of consumption tax rate from 5% to 8% in April 2014.
Regarding Japanese social insurance, pension funds, the burden on low-income brackets is relatively high, since non-regular employees who are not members of the welfare pension fund have significantly increased. It is therefore necessary to address the current situation that very high unpaid rate of social insurance and pension funds with more than 40%, which would not be sustainable in the national pension system31).
If sustainable economic growth is to be achieved in Japan, it is recommended to introduce more progressive income tax system: lower direct taxes and insurance premium burden considerably for low-income groups, and to make heavier burden on high income group. It is also necessary to, conduct labour market reforms to address the disparity between regular and non-regular workers.
With introduction of more progressive income tax and differential tax rates of consumer tax (as VAT), consumption is expected to increase because the disposable income of middle and low income groups would increase, which should increase the total private consumption in an economy. An expansion of the private consumption would steadily increase GDP growth rate over the medium to long term. At the same time, there will be a return to the level where the fiscal balance can be maintained by the increase in tax revenue due to eco-nomic recovery.
[Notes]
1 ) The maximum income tax rate was raised from the current 50% to 55%, and it has been re-duced from the category of maximum tax rate bone by the highest income group of 50 million yen + (10 million yen × the number of heirs) to 30 million yen + 6 million yen × (the number of heirs) since 2015.
2 ) Although the US Clinton administration raised the income tax maximum tax rate in the 1990s, the fiscal balance rose to a surplus with the help of rising productivity. But since 2001 G. Bush (Junior) administration, fiscal deficit expanded due to expansion of military spending and income tax reduction. In the case of the United States, it is the only key currency and there is a special structure in which the deficit is maintained by issuing US Treasury bonds as cap-ital liberalization advances, but this is not applicable in Japan.
3 ) Ohta (2007) shows the possibility of a rise in growth rate by strengthening income tax progres-sivity using the household survey statistics in 2006. In this paper, similar simulation methods are used to show economic growth should be realized another increase in household’s consump-tion by income groups based on the statistics in 2013.
4 ) According to the "National Life Basic Survey", published by the Ministry of Health, Labour and Welfare, the average income per household decreased from 5,638 thousand yen in 2005 to 5,150 thousand yen in 2015. Also, annual consumption expenditure declined for three consec-utive years from 2014 to 2016, decreased by 2.9%, 2.3% and 1.7%, as compared with the previ-ous years, respectively.
5 ) For household burden by income category including insurance premium, see Fig.12 and 14 in Chapter 3.
6 ) The Ministry of Health, Labour and Welfare's "National Life Survey" has published the Gini coefficient of households since 1992, but samples are limited, and because they are produced based on the value of the personal income after taxes levied, the coefficient is lower than before taxation. Even so, income distribution in terms of Gini Coefficient has deteriorated much more than that in the early 1970's (less than 0.3).
7 ) Recent economic policy of the government has strongly reflected the intention of economic or-ganizations such as Keidanren on the labour market, and it can be said that the recent policies, including introduction of the ‘Salaried employees Exemption” (no consideration for extra-work allowances /payments for higher income groups with annual income of ¥10 million), are in line with neo-liberalism based economic policies under the current government in Japan.
8 ) While Otake (2005) gives a major factor for deterioration of income distribution to the aging of the population composition in the past decade, it may not be the main factor for the recent trend of expanding economic disparity. It may be the tax system and social policies for employ-ment and labour market that has resulted in significant changes in household income distri-bution. Moreover, expansion of asset gaps, such as preferential tax incentives and inheritance tax reductions, has not been taken up seriously, and the asset disparity has a big influence on economic disparity, so it can be greatly influenced by policy measures it should be recognized. 9 ) Expanding the fiscal deficit in Japan should be ascribed to the past tax reforms for more re-gressivity in income tax system (so-called flattening), and the statistics of Cabinet Office (2012), indicated the decrease in tax revenues since the 1990s is about 20 trillion yen, which shows huge loss due to the more ‘flat’ income tax system with some characteristic of regressivity.
10) In the United States, the Roosevelt administration, launched in 1933, introduced a progressive taxation system, which could facilitate a recovery in economic growth rate by 1940s. After World War II, the progressive taxation system, which basically dominated direct taxes, was basically maintained in the US (and in Japan), which brought about relatively high economic growth rate until the early 1970s.
11) Since 2004, a tax loss carry-forward system has been introduced in Japan, and the loss of each firm can be deducted after the following year. Because of this system, major banks, for exam-ple, that recorded the highest surplus in history has deducted money due to huge deficits due to past bad loan disposal and have not paid corporate tax. Many companies are exempted from corporate tax payment by this system, because the carry forward period is allowed up to 9 years. For overseas large companies, tax losses are deducted up to 80% of surplus and only 20% were subject to taxation, but we plan to deduct 65% each from 65% and change the taxable amount to 35% surplus from 2015. However, it is planned to raise the carry-over period from the current 9 years to 10 years, and the amount of "corporate tax that can be obtained" of companies that still do not pay corporate tax is expected to be huge.
12) Stiglitz [2006] See p.xvi. "Trickle down" is a way of thinking that wealth gradually spreads towards low-income groups and becomes a benefit for the entire people. Suppose that an econo-my could be recovered by revitalizing the economic activities of large corporations and affluent people, rather than directly allocating to the people of lower income groups by the government (through social security etc.). In Japan, as with the United States, this concept of ‘Trickle-down’ was used as a justification of lowering the maximum rate of income tax.
13) Corporate tax (effective tax rate) is reduced by 2.51% from FY 2015. It is said that the reason for reducing corporate tax rates would be that of Japan is higher than other emerging countries in Asia. However, this argument cannot be justified, since about 70% of Japanese corporate enterprises are companies which had been in loss in operation, and therefore corporate taxes