ADOPTION OF INFORMATION AND
COMMUNICATION TECHNOLOGY (ICT) IN
SMALL AND MEDIUM ENTERPRISES (SMEs):
THE CASE OF CAMEROON
A THESISSUBMITTED FOR THE PARTIAL FULFILLMENT OF THE REQUIREMENTS FOR THE MASTERS OF BUSINESS ADMINISTRATION
IN INNOVATION AND TECHNOLOGY MANAGEMENT BY
Ntwoku-Tchuinkep Habib
GRADUATE SCHOOL OF MANAGEMENT RITSUIMEIKAN ASIA PACIFIC UNIVERSITY, JAPAN
i
CERTIFICATION
This thesis entitled “Adoption of Information and Communication Technology (ICT) in Small and Medium Enterprises: the Case of Cameroon”, by “Ntwoku Tchuinkep Habib”, under the supervision of “Yukihiko Nakata”, Ritsumeikan Asia Pacific University, Japan, is hereby submitted for the partial fulfillment of the Masters in Business Administration in “Innovation and Technology Management”. This research has not been submitted in any other university or institution previously for the award of a degree.
ii
DECLARATION
I, "Ntwoku Tchuinkep Habib", hereby declare that the work presented herein is genuine work done originally by me and has not been published or submitted elsewhere for the requirement of a degree program. Any literature, data or works done by others and cited within this dissertation has been given due acknowledgement and listed in the reference section.
Signature:
Name: Ntwoku Tchuinkep Habib Date: July 14, 2011
iii
ACKNOWLEDGEMENT
I am extremely thankful to my supervisor Prof. Yukihiko Nakata, the Graduate School of Management for the noble guidance, support, patience and full commitment.
I wish to show my utmost appreciation to Prof Namba Masanori, Prof. Kuhara Masaharu and Prof. Tsunoda Aijiro, whose courses embedded me with the widespread knowledge that was used to develop this study. It is only right that I acknowledge Prof Zhang Wei Bin and Prof. Asgari Behrooz whose input helped deepen my understanding of some underlined concepts used in this research. I am grateful to Prof. Shayan Ebrahim and Prof. Munim Barai whose critiques helped improved the outcome of this study. I appreciate all the Graduate School of Management’s professors and staff for giving me a tremendous learning experience.
I am forever grateful to the Japanese government whose scholarship grants put me in suitable condition to pursue this study. I wish to seize this opportunity to express my deepest feelings to those affected directly or indirectly by the earthquake.
Very special thanks to my mother, Mrs Ntwoku Jacqueline, who did not only give me the moral support but also conducted the distribution and collection of questionnaire on my behalf. I would like to acknowledge Nila Firdausi for providing me with valuable suggestions regarding the framework of this paper. I wish to show gratitude to Daniel G Hyams, whose valuable input helped me to design the model for data analysis in order to obtain satisfactory results.
iv I am grateful to Akum Joseph, Ming Ray, Jose Louis, Maliku Thoufeeg, Isa Ramadan, Yadon Joshua, Taurai Chinyamakobvu, Fall Fallou, Lice Talemaivatuwiri, Tamara Tashbaeva and every other classmate in the MBA program for their valuable suggestions and encouragements. Their company in the classroom and computer laboratory will always be remembered.
Last but not least, I would also like to thank all of my friends, family members for encouraging and supporting me whenever I needed them.
v
ABSTRACT
SME development programs have become a priority in many economies worldwide and have seen an increasing proportion of developing countries embarking on SME policies for economic growth and poverty alleviation. In this knowledge-based era, ICT has been presented as an important device to overcome the inherent challenges that make SMEs vulnerable. Despite recent reports on the success of information-rich economies, many developing countries are still not catching up with the trend. It is therefore important to analyze the adoption of ICT at the SME level in developing countries.
The analysis of the adoption of ICT at the SME level was based on the SME sector in Cameroon. Initially, it was verified that there is a relationship between ICT diffusion and SME performance using cross-country evidence. From these results, we recommended the implementation of ICT development policies in order to improve SME growth.
By fitting the Bass model to the actual data of adopters in Cameroon SMEs, it was found that the decision to adopt both computers and internet was mostly influenced by imitation, word-of-mouth. From these results, promotion of inter-firm cooperation was proposed to speed up diffusion. Also, SMEs with greater sizes, multiple number of plants and whose owners have higher education have a greater tendency to adopt computers. From these analyses, training programs were recommended to help SME owners improve their skills for a better adoption.
In sum, an analysis of ICT adoption is important for decision making regarding development policies.
vi
TABLE OF CONTENT
CERTIFICATION ... i DECLARATION ... ii ACKNOWLEDGEMENT ... iii ABSTRACT ... v TABLE OF CONTENT ... viLIST OF FIGURES ... viii
LIST OF TABLES ... ix LIST OF ABBREVIATIONS ... x 1. INTRODUCTION ... 1 1.1 Background of Study ... 1 1.2 Objectives ... 5 2. LITERATURE REVIEW ... 6
2.1 Role of SMEs in the Economy ... 6
2.1.1 Definition of SMEs ... 6
2.1.2 Debate on SME Policy Promotion ... 8
2.1.3 SME Contribution to the Economy ... 11
2.2 Relationship between ICT Adoption and SMEs ... 14
2.3 Models and Theories of Adoption/Diffusion of ICT ... 18
2.3.1 Adoption Approach ... 18
2.3.2 Domestication Approach ... 19
2.3.3 Diffusion Approach ... 20
vii
2.4 Theoretical Framework of Bass Diffusion Model ... 24
3. THE CASE OF CAMEROON ... 30
3.1 Introduction to Cameroon’s Economy... 30
3.2 SME Law in Cameroon ... 31
3.3 Current State of ICT in Cameroon ... 33
4. METHODOLOGY ... 34
4.1. Collection of Data ... 34
4.2 Analyses Tools... 41
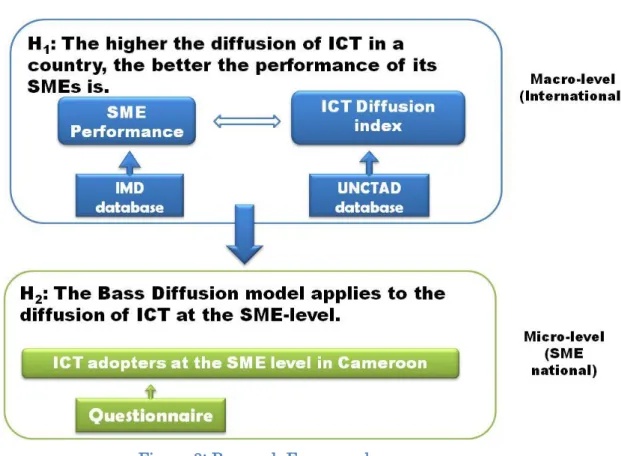
4.3 Hypotheses ... 42
5. RESULTS AND DISCUSSIONS ... 43
5.1 Diffusion of ICT and SME performance: Cross-country Evidence ... 43
5.2 Diffusion of ICT in Cameroon SMEs ... 44
5.2.1 Attributes of the Sampled SMEs in Cameroon ... 44
5.2.2 Bass Diffusion Model for Adoption of Computers in Cameroon SMEs .... 47
5.2.3 Bass Diffusion Model for Adoption of Internet in Cameroon SMEs ... 68
5.3 Reason for Adoption/Non-Adoption of Internet ... 75
5.3.1 Reasons for Adopting Internet ... 75
5.3.2 Reasons for Not Adopting Internet ... 79
6. POLICY RECOMMENDATIONS ... 83
7. CONCLUSIONS ... 84
REFERENCES ... 86
viii
LIST OF FIGURES
Figure 1: Adopter Categorization of Rogers Diffusion Model ... 22 Figure 2: Determination of Adopters Category using Bass Model ... 29 Figure 3: Research Framework ... 34 Figure 4: Cross-country Correlation between SME Performance and ICT Diffusion Index in 2005 ... 43 Figure 5: Fit of Bass Diffusion Model to Actual Data of computer adoption in
Cameroon SMEs ... 50 Figure 6: Fit of Bass Model to Actual Data of Cumulative diffusion pattern of computer Adoption in Cameroon ... 50 Figure 7: Noncumulative Diffusion Pattern for the Adoption of Computers showing Adopter Categories ... 54 Figure 8: Size of Adopters’ categories After Combining Innovators and Early
Adopters ... 58 Figure 9: Proportion of SMEs that Did not Adopt Computers in the Year of Entry 68 Figure 10: Fit of Bass Model to Actual Data of Noncumulative Diffusion Pattern of Internet Adoption in Cameroon SMEs ... 71 Figure 11: Fit of Bass Model to actual data for cumulative diffusion pattern of Internet Adoption in Cameroon SMEs ... 71 Figure 12: Reasons SMEs in Cameroon Adopt Internet ... 78 Figure 13: Reasons for not adopting internet at the firm level in Cameroon ... 81
ix
LIST OF TABLES
Table 1: Adopter Categorization of Rogers Diffusion Model ... 22
Table 2: Different Trends of Adopters’ Noncumulative Distribution ... 27
Table 3: Different Category of Adopters in Bass Model ... 28
Table 4: Composition of Sample ... 46
Table 5: Year Respondents (SMEs) First Began Using Computers ... 48
Table 6: Fit statistics for computer adoption in Cameroon SMEs ... 50
Table 7: Summary of calculated values of Bass Model for Computer Adoption ... 53
Table 8: Establishing the computer adopters’ categories for Cameroon SMEs ... 55
Table 9: Year SMEs started using computers and adopter category classification . 56 Table 10: Comparison of adopters’ Category Size Between Modeled and Observed Data ... 57
Table 11: Classification of Factors that Influence ICT Adoption ... 59
Table 12: Chi-square Results for Demographics of SMEs Across Categories ... 60
Table 13: Cross-tabulations Showing Relationship Between Adopters’ categories and Number of Employees ... 61
Table 14: Cross-tabulations Showing Relationship Between Adopters’ Categories and Number of Plants ... 63
Table 15: Cross-tabulations showing relationship between adopters’ categories .... 64
Table 16: Cross-tabulations Showing Relationship Between Adopters’ Categories and Age of Company ... 66
Table 17: Proportion of SMEs that Adopted Computers During their Entry Relative to the Proportion that Adopted Later ... 67
Table 18: Year respondents (SMEs) First Began Using Internet Within the Company ... 70
Table 19: Fit statistics for internet adoption in Cameroon SMEs ... 71
Table 20: Summary of Calculated Values of Bass Model for Internet Adoption ... 75
Table 21: Frequencies of Reasons for Adopting Internet ... 76
x
LIST OF ABBREVIATIONS
ICT: Information and Communication Technologies IT: Information Technology
GDP: Gross Domestic Product GSM: Global System for Mobile ME: Medium-sized Enterprises SME: Small and Medium Enterprises SE: Small-sized Enterprises
TAM: Technology Acceptance Model TPB: Theory of Planned Behavior TRA: Theory of Reasoned Action
UNCTAD: United Nations Conference on Trade and Development VoIP: Voice over Internet Protocol
VSAT: Very Small Aperture Terminal VSE: Very Small Enterprises
1
1. INTRODUCTION
1.1 Background of Study
Lately, governments in both developing and developed countries have initiated programs meant to enhance the development of Small and Medium Enterprises (SMEs). Advocates of SME policies such as the World Bank argue that SMEs enhance competition and entrepreneurship, which in turn has external benefits on economic-wide efficiency, innovation and aggregate productivity growth (Beck, Demirguc-Kunt, & Levine, 2005). More so, they advance that SMEs have the potential to create jobs due to their labor-intensive nature. These attributes have made SME development programs a priority in many economies worldwide and has seen an increasing proportion of developing countries embarking on SME policies for economic growth and poverty alleviation. While there are many skeptical views concerning the validity of Pro-SME policies, the fact that SMEs account for a large share of firms and employment in developing countries is a good enough reason to focus on them.
However, SMEs have some intrinsic characteristics that make their sector very vulnerable and ephemeral. SMEs, as an entity, are inherently short of cash and have a limited range of markets. They lack funds for extensive marketing strategies and are thus compelled to operate in small markets (Burns, 2001). This makes it difficult for small firms to diversify their business risk and also obliges them to make short-term decisions. Consequently, SMEs generally have a lower life span than large firms do and their development is a sensitive issue.
“In the twentieth century, mankind made a transition from a matter-based economy to a knowledge-based economy” (Contractor & Lorange, 2002). Hence, entities started drifting away from emphasis on natural resources to focus on ideas,
2 design and organization. This shift was a game changer for SMEs since it had the potential of helping to level the competition between firms of different sizes. This is because in this paradigm, knowledge resources rather than physical resources determine growth. Scholars such as Burton-Jones (1999) then proposed models based on knowledge-led growth, knowledge-centered organizations and knowledge supply to enable companies to thrive in this novel economic environment. Most of these models are focused on information transfer within or without the company boundaries.
Turban, Leidner, Mclean, & Wetherbe (2004) claim that information technology (IT), an organization can help build the organizational memory and knowledge to withstand any challenge in the business environment at any given time. They insist that knowledge, as an asset, must be exchangeable among persons, and must be able to grow in order for an organization to succeed. Information and Communication Technology (ICT) has established itself as one of the most effective tools to exchange and cultivate knowledge. Recent literature has thus addressed the importance of modern ICTs in the management of knowledge through disciplines such as “Knowledge Management System”. This implies that ICT has become a determining factor of the success of an organization in this knowledge-based era.
It is safe to say that, the advent of internet and other modern information and communication technologies, changed the rules of the game. The strongest individuals or business entities are those with the most access to relevant information- and who take proper advantage of it (Arreymbi, Agbor, & Adnan, 2008). Firms thus regard ICT as an important tool to achieve competitiveness in the knowledge-based economy. It is no surprise ICT has been presented as an important weapon to combat the inherent disadvantages of small firms discussed above.
3 OECD (2004) for example, believe that in an effort to boost SME growth, ICT should be seen as a crucial factor to help overcome the current problems faced by Small and Medium Businesses. This institution demonstrated that ICT and e-business applications provide many benefits across a wide-range of intra- and inter-firm business processes and transactions. Consequently, government and development agencies have been encouraging the adoption of ICT in an attempt to boost economic growth through SME growth in developing countries especially.
Despite these advantages, rapid growth of ICT at the firm level in developing countries is yet to materialize. Arreymbi et al. (2008) highlighted that despite recent reports on the success of information-rich economies, many developing countries are still not catching up with the trend. It is thus important to analyze the adoption of ICT at the SME level in developing countries. The pertinent research questions thus follow;
1) Is there a relationship between ICT Adoption and SME’s performance? 2) What influences the decision to adopt ICT at the SME level?
3) What are the demographic characteristics of ICT adopters?
Answering these questions would enable a better understanding of the relevance of ICT adoption to the SME level. It would equally give indications of how the acceptance and diffusion process of ICT takes place in the SME sector. Studying the diffusion process would help find out which SMEs acquired ICT, when they did so and the reason that led them to do so at one given time or another. If the SMEs can be identified according to the moment in time at which they adopted ICT, the behavior of the SMEs concerned could be characterized. Such information could help speed the acceptance and diffusion of ICT at the SME level, if at all deemed necessary
4 The study was conducted in Cameroon SMEs. Cameroon is a developing country located in Central Africa. The Cameroon government has been seeking ways to boost its economic growth and alleviate poverty. In this light, the government, coupled with the support of World Bank has turned to SME development policies to address its issues. The increasing interest in SMEs in the country, has been justified by the establishment of a ministry in charge of Small and Medium Enterprises in 2004.
The fact that Cameroon was one of the first African countries to adopt the GSM system back in 1989 (Emage, 2006) shows that it has always strived to be a frontrunner as far as ICT is concerned in Africa. Cameroon has struggled to enact several policies aimed at improving ICT infrastructure in the territory. Hence, the investigation of ICT diffusion in Cameroon SMEs is important since it could help suggest better policies to speed its diffusion.. Equally, it could help determine whether policies directed at ICT development in order to improve SME’s welfare are legitimate. It is worth mentioning that computer ownership and internet access within the SMEs were used as a proxy of ICT, in this study.
5
1.2 Objectives
The main objective of the research is to analyze the adoption of ICT at the SME level using Cameroon, a developing country, as case study. In order to reach this goal, the following specific goals must be attained;
1) To examine the relationship between ICT diffusion and SME performance using a cross-country evidence.
2) To find out the factors that influence the decision to adopt ICT in Cameroon SMEs
3) To identify SMEs according to the moment in time at which they adopted ICT 4) To explore whether the behavior of the SMEs that adopted ICT could be
characterized by their demography.
5) To establish the reason for adopting or rejecting ICT at the SME level in Cameroon.
6
2. LITERATURE REVIEW
2.1 Role of SMEs in the Economy
There has been a lot of back and forth arguments about the importance of SMEs and whether or not governments should employ pro-SME policies in view of boosting economic growth. Lately, scholars, government agencies, Nonprofit Organizations (NPOs), and companies have drawn increase attention at the SME sector. In developing countries especially, pro-SME policies have been vaunted as a great tool for poverty reduction and rapid economic growth (Beck, Demirguc-Kunt, & Levine, 2005). Equally, pro-SME policies have been encouraged in developed countries as they are considered to play an important role in creating new industries, increasing employment opportunities, encouraging competition in the market and vitalizing regional economies (Tsukahara, 2006). Studying past literature will help clarify on this matter and for context sake, emphasis shall be laid on developing countries.
2.1.1 Definition of SMEs
SMEs statistical definition usually varies per country. However, most of the time the choice whether or not a company is an SME is based on the number of employees, value of assets or value of sales (Hallberg, 2000).
In Japan for example, the new Small and Medium Enterprise Basic Law set the definition of SMEs based on number of employees, capital size and industry. Here, company in the wholesale industry is considered an SME if it has not more than 100 million yen as capital and less than 100 employees; for the retail and service industry, the upper limit is 50 employees and not more than 50 million yen for capital. Enterprises in the manufacturing and other industries should have 300 or less employees with a capital of not more than 300 million yen to be considered in the SME sector
7 (Small and Medium Enterprise Agency Japan, 2000). For the USA, it is 500 employees and for European Union countries, it is 250 employees (Hallberg, 2000).
There is also a sector which some might refer to as microenterprises. This generally involves businesses with not more than five (5) employees. It is also believed that a significant proportion of these microenterprises are usually in the informal sector or shadow economy.
Generally, countries adopt different statistical definition for SMEs based on their different policy targets. Nowadays, most economies have policies put in place to cater for the SME sector. Governments thus establish these definitions based on the proportion of companies in the economy that they believe require special attention. In other words, the definition of SMEs set by a country depends on its policy concept or priorities. For example, Japan changed its policy concept from “rectifying the gap between large firms and SMEs in terms of productivity” to “developing and growing a wide range of SMEs for greater economic vitality” (Small and Medium Enterprise Agency Japan, 2000).
. This orientation led to an alteration in definition of SMEs as they increase the upper limit of capital size in order that their pro-SME policies can cover a wider range of companies.
More generally, it is noticed that governments of developed countries set greater upper limits of number of employees and capital size than developing countries when defining the SME sector. A logical reason for this could be the fact that companies are more productive in thriving economies. Also, rich economies can afford to cover a larger proportion of businesses with government spending than developing economies can.
8 2.1.2 Debate on SME Policy Promotion
There has been a lot of back and forth discussions regarding the role of SMEs in the economy. Lately, governments and nonprofit organizations across the world have been encouraging policies directed at developing the SME sector. Such pro-SME policies include provision of subsidies, training programs and others. Government agencies have paid unprecedented attention to SMEs. Countless countries have created a separate ministry in charge of Small and Medium Enterprises. Developing countries have been encouraged by international organization to follow the SME route in order to achieve economic welfare. It is mostly believed that development of the SME sector would help reduce poverty and boost economic growth. Scholars have conflicting views on these assertions. Discussing their various views could help locate the significance of SME related studies to policy makers.
SME advocates advance that SMEs increase the number of firms in the market. This leads to intense competition and thus compels firms to be more competitive and creative. Simply put, SMEs development encourages competitiveness and entrepreneurship. In such an environment firms become more efficient and productive in order to survive. This overall results in economic-wide efficiency, innovation and productivity growth (Beck, Demirguc-Kunt, & Levine, 2005).
Secondly, some scholars claim that SMEs are more productive than large firms are, but the fact that they lack financial markets and other institutions’ support, hinders their growth. It is well known that one of the major problems faced by SMEs is finding resources to finance growth. Despite their productivity, SMEs have limited financial instruments available to fund their projects. This renders direct government financial
9 support and other pro-SME programs necessary to fill the gap and keep this fertile sector healthy (Beck, Demirguc-Kunt, & Levine, 2005).
Thirdly, SME proponents argue that the expansion of this sector would increase employment since this sector is considered more labor-intensive with a higher job creation capacity (Hallberg, 2000). As a result, subsidizing this sector could be a good strategy to combat poverty. In developing countries for example, a considerable fraction of SMEs operate in the informal sector. Hence, pro-SME programs might promote migration of informal businesses into the formal sector to have access to finance. This could help these SMEs expand further while simultaneously enabling the government to recoup revenue that is lost to the shadow economy. This win-win situation would aggregately improve economic welfare.
An important factor that has been added recently as an argument for SME-policy, is the fact that SME development contribute to social transformation to a democratic, market-based system as pointed out by Smallbone & Welter in 2001.
However, there are skeptical views on the efficacy of the SME-focused policies. Some scholars argue that large firms can enjoy economies of scales, which in turn cuts down production cost and can thus make companies more efficient. Also, economies of scale gives firms a better opportunity to invest in R&D (Research and Development) with positive productivity effects. Large firms may consequently be a better option to enhance productivity and innovation than SMEs.
Researchers have denied the assertion that SMEs contribute more to job creation. Although it is true that job creation rates are high for small firms, it is also noticed that their job destruction rates are equally high. SME sector is a ferocious environment with low survival rate. In other words, small firms have a high birth rate
10 and high death rate. Hence, the resulting net job creation rates in small firms might not match up with large firms on an extended period (Hallberg, 2000). This implies that large firms provide more secure jobs and therefore higher quality jobs than small firms do with an overall positive effect on poverty reduction. More so, empirical evidence shows that the type of industry more significantly determines the labor-intensity than the size of the firm within an industry does (Little, 1987). This translates that policies directed at subsidizing certain industries better address the employment issue than the pro-SME policies do.
A neutral view has been proposed where rather than focusing on pro-SME policies, the focus should be on improving the business environment. That is, emphasizing on the creation of a business atmosphere that favors competition and private commercial transactions. Although this view may somehow promote SMEs, it is initially aimed at improving the environment faced by all businesses, be it large or small firms.
From the above debate, we realize that pro-SME policies have very often being justified based on SMEs capacity to increase employment and better boost economic growth and efficiency. Nevertheless, empirical evidence does not always prove this true. So much so that, it is difficult to vindicate SME policies based on economic benefits. The question that naturally arises is whether the government should encourage policies aimed at developing the SME sector. The following section would attend to answer this question.
11 2.1.3 SME Contribution to the Economy
SMEs have been of vital importance to the welfare of different economies be it developing, transition or developed countries.
SMEs have a rather dynamic role in developed countries. Evidence from the US for example, show that SMEs are an important source of employment growth and innovation. Audretsch (2002) demonstrated that the net employment gain between 1990 and 1995 was greater among SMEs than among large firms. Also, SMEs had a patent rate per employees greater than that of larger firms.
In an attempt to prove how important the role of the government is to the development of SMEs in a transition economy, Smallbone & Friederike (2001) conducted survey in Eastern Europe countries. They argued that SMEs could grow and survive in adverse environments due to their entrepreneurial qualities. Nevertheless their contribution to economic development in terms of job creation, and external income generation will be limited if the government does not create a system that will favor the private sector development. In other words, they acknowledge the potential of SMEs to contribute to economic development but insist that this role can only be fulfilled if the government gives them the necessary ingredients to operate this sector.
Similar conclusions were drawn by Jepessen (2005) when working with developing countries. His paper was set to discuss whether and under what conditions SMEs can achieve their economic and social role in a developing country. Adopting a qualitative approach to investigate the case of SMEs in South Africa, he found that a small fraction of SMEs can contribute to economic and industrial development, but most cannot. Just like Smallbone and Friederike (2001), he concluded that SMEs contribution to economic development depends on whether the government has the
12 willingness and appropriate policies to promote the SMEs and went a step further by adding that the government should have the necessary resources and should receive international support to achieve its goals.
Using a cross-country approach Beck, Demirguc-Kunt, & Levine (2005) investigate whether SMEs have a causal impact on economic growth and poverty alleviation. They employed regression analysis on 45 countries in order to analyze the relationship between the size of the SME sector and both economic growth and measures of poverty alleviation. They concluded that directly subsidizing SMEs to boost economic growth and alleviate poverty is not justified empirically. In other words, using Pro-SME policies might not be the best way to combat poverty and accelerate growth despite the fact that a prosperous SME sector characterizes a flourishing economy.
Hallberg (2000) in his discussion paper conceded the argument that SMEs might not have a direct causal link with economic growth and poverty alleviation. However, he justified pro-SME policies by simply stating that SMEs account for a large share of firms and employment in the economy and should thus be catered to, for the economy’s welfare. This argument is true for any country, be it a low-income country, middle-income country or even high income country. For example; A high-income country like Japan has about 90% of its companies being SMEs, low-income country like Cameroon has about 80% of companies in the SME sector. Thus, their predominant presence irrespective of the economy is a good enough reason to attend to them. More so, in developing countries, SMEs and micro enterprises are the emerging private sector. They could therefore form the base for private sector-led growth.
13 OECD Conference Proceedings strengthen this argument in 2004 by showing that SMEs contribute over 55% of GDP and 65% of total employment in high-income countries, while they contribute about 70% of GDP and 95% of total employment in middle-income countries and over 60% of GDP and 70% of total employment in low-income countries. In sum, the debate could be settled by recognizing that pro-SME policies are legitimate giving their large size and contribution to the economy.
It is important to understand the issues of SMEs in order to enact the policies that would best serve them. They lack funds for extensive marketing strategies and are thus compelled to operate in small markets (Burns, 2001). This makes it difficult for small firms to diversify their business risk and also obliges them to make short-term decisions. Consequently, SMEs generally have a lower life span than large firms do and their development is a sensitive issue.
More so, globalization has made the SME sector even more ferocious since enterprises face major challenges in strengthening their human and institutional capacities to take advantage of trade and investment opportunities (OECD, 2004).
In developing countries especially, SMEs are challenged by the globalization of production and the shift in the importance of various determinants of competitiveness (Wolf, 2001). More so, the rapid spread of ICT and continuous decrease in communication cost has resulted in more integrated markets in different parts of the world. This means that in an attempt to enhance competitiveness of the SME sector at national and even international level, it is crucial for governments to consider the ICT factor in their policies. Nowadays, information technology is pivotal in many businesses. It is difficult to gain competitive advantage and survive without some
14 adoption or implementation of this advancement in technological products (Kharuddin, Ashhari, & Nassir, 2010).
2.2 Relationship between ICT Adoption and SMEs
At this point, it is clear that ICT has benefits that cut across different sectors of an economy in both developed and developing countries. “ICTs have the largest beneficial impact in conjunction with other changes, including a new set of ICT skills/training, structural changes within business models and the economy, and institutional and regulatory adjustments” (ITU, 2006: 39).
Various studies have been undertaking to show the relationship between the adoption of ICT and business performance or to empirically prove the benefits of ICT usage to business entities. According to some scholars, these advantages might be enjoyed differently depending on the country, industry or firm concerned. Hence, it is important to consider the economy being scrutinized when making assumptions.
Studies have shown that ICT investments contribute to returns at the firm level. Using Solow’s Model, Dedrick, Gurbaxani, & Kraemer (2003) showed that although there is a significant IT contribution to returns, the magnitude of contribution varies extensively across the firms. In other words, some firm with similar IT investment might have performed differently. There was strong evidence that the difference in performance was influenced by organizational capital. Organizational capital here refers to management practices such as job training, business process restructuring, and others. In simple terms, ICT investment yields corresponding returns for the firms who perfectly integrate ICT into their organizational structure. This view is commonly accepted by most scholars and could be expanded to industries and even country economies.
15 The above literature makes it clear that when gauging the benefits of ICT to performance, it is useful to look further than just the direct relationship between these two variables. As a matter of fact, “ICT is not simply a tool for automating existing processes, but is more importantly an enabler of organizational changes that can lead to productivity” (Dedrick, Gurbaxani, & Kraemer, 2003). Thus, ICT adoption might lead to different outcomes in different entities.
For example, Morikawa (2004) undertook a study in Japan to analyze the relationship between ICT and innovation activities in the SME sector and also the relationship between ICT and profitability. Having response from questionnaires distributed to a considerable sample of SMEs, regression analysis was made. It was discovered that there is a positive relationship between IT equipment and firm’s performance. In other words, ICT diffusion was found to be a reliable indicator of better performance especially when it comes to small firms. He concluded that the Japanese policy aimed at encouraging ICT diffusion among Japanese SMEs was viable. However, the relationship should not be considered quantitative since the data used was of a discrete nature. More so, as earlier mentioned, caution is required when using these results for deductions, as results might vary depending on each country’s institutional structure.
Lopez-Nicolas & Soto-Acosta (2010) looked at the benefits of ICT to SMEs from a different angle. They sought to evaluate the effect of ICT adoption and usage on Organizational Learning (OL) in SMEs. They sampled SMEs of not less than 10 employees in a particular region of Spain and distributed questionnaires to help them measure the knowledge creation processes. Employing hierarchical regression analyses, they found that adoption of ICT enhances SMEs knowledge creation, which in turn
16 enhances Organizational Learning. These findings are important as they show one of the ways in which ICT adoption could be appropriately molded into the organization to eventually improve SME performance.
Kharuddin, Ashhari, & Nassir (2010) made a study directed at finding out if informed decision enables the SMEs to increase business efficiency and stay competitive. To investigate this pertinent issue they focused on the adoption of accounting information systems in SMEs in Malaysia. The research proceeded through questionnaire and data was collected for a five year period for the SMEs in question. Using regression analysis to analyze the resulting panel data, it was found that adopting information systems is crucial for SMEs as it helps improve business efficiency and competitiveness. More generally, it could be interpreted that information systems provide SMEs with the right capabilities and resources to overcome the competitive pressure from within the SME industry and also from the larger firms. Although their study was focused on information system, the results could be translated to ICT overall as it is impossible to dissociate information system and ICT.
In trying to examine the impact of ICT use on SMEs in Africa, Susan Wolf (2001) used enterprise survey data from two East African countries to study how ICT usage influences micro-level competitiveness. On the same token, she sought to analyze the macroeconomics of ICT diffusion and its growth effect. Using descriptive and regression analyses of the SME data, it was found that ICT investment has a great influence on total factor productivity once a certain limit is passed. At the macro level, using an information-theoretic approach it was established that ICT is instrumental in reducing information asymmetry. This in turn could create new opportunities and
17 enhance the efficiency of resource allocation. From a macro perspective this would then lead to faster growth and diversification of the economy
In an endeavor to have more generalized results on the relationship between ICT adoption and SME performance, some scholars have employed a cross-country approach. Despite its advantages in drawing more generalized conclusions, this approach is not prevalent due to the absence of comparable international data on SMEs (Beck, Demirguc-Kunt, & Levine, 2005).
Patrakosol & Lee (2009) undertook a research to determine how IT utilization contributes to better relationship-level inter-firm performance between two countries; USA (developed country) and Thailand (developing country). Basically, the study was set to show that IT technical capabilities had a positive relationship with inter-firm performance across the two countries. Surprisingly enough, they found that technical IT capabilities benefited inter-firm relationship in Thailand (the developing country) more than in USA the developed country. More so, in Thailand IT adoption had a greater impact on innovation performance than in the USA. Overall, it was shown that ICT capabilities helps improve inter-firm performance.
Another cross-country research in this field was conducted by Ark et Al.,(2002) to scour the contribution of ICT to productivity growth at the macro-level. Here, 16 (sixteen) OECD countries were sampled and re-categorized into two (2) sets, namely; European Union and North America for easy comparison. These countries’ industries were grouped into ICT producing, ICT using and non-ICT using industries and their corresponding contributions to Gross Domestic Product (GDP) was computed. The difference in productivity growth between EU and North America could be successfully explained using ICT diffusion in these regions. This implies that the
18 productivity growth rate of the nations concerned was very much linked to the proportions of the ICT groups mentioned above.
So far, it could be seen that most studies aimed at establishing a relationship between ICT and SME performance consider two variables; the firms’ productivity and ICT investments. However, there are still conflicting views when investigating the relationship between them at the macro level. Using a cross-country approach to examine the association between ICT diffusion with respect to SMEs productivity might help settle these differences. This explains the choice of the methodology in this paper
2.3 Models and Theories of Adoption/Diffusion of ICT
So far, many theories and models have been proposed to interpret the adoption of ICT in a system. Studies on ICT adoption tend to take three (3) main approaches according to Pedersen (2003), namely the adoption approach, the domestication approach and the diffusion approach.
2.3.1 Adoption Approach
In this approach, social and individual decision-making concepts are applied in order to explain the adoption decision of users. Some well-known models in this sphere are; Technology Acceptance Model (TAM), Theory of Reasoned Action (TRA), and Theory of Planned Behavior (TPB). The TAM suggests that when individuals are presented a new technology, a number of factors influence their decision about how and when they will use the said technology (Manueli, Latu, & Koh, 2007). These factors are perceived usefulness and perceived ease of use. These theory was introduced by Davis (1989) and has since then been used by many scholars in the technology adoption related studies. TAM is sometimes criticized for not controlling external factors (variables) such as economic factors, influence from competitors, suppliers and other
19 effects in its analysis of the decision-making factors. The Theory of Reasoned Action (TRA), which was introduced by Fishbein and Ajzen in 1975 and 1980 respectively, has been integrated into the TAM to overcome some of its weaknesses. The TRA is based on behavioral intentions; one’s attitude towards performing the behavior and one’s subjective norm with respect to performing a behavior. Theory of Planned Behavior (TPB) is an extension of the TRA. It deals with conditions where the individual has no control of their behavior (Manueli, Latu, & Koh, 2007). This model has been applied to decipher people’s behavior in several fields such as public relations, advertising campaigns and others.
Studies of Adoption of new technologies are usually applied for marketing research. As industry players can use this model to evaluate the adoption potential of a new product. For example, Pedersen (2005) in his study on the adoption of mobile internet services, found that there was a significant relationship between perceived usefulness of the technology and external influences such as disposable income of households. This kind of findings can help the service provider when trying to sell his product in a new locality.
2.3.2 Domestication Approach
Domestication approach focuses on the process in which technology becomes an integral part of our everyday habits (Manueli, Latu, & Koh, 2007). Thus, it emphasizes on the process by which a technology find its way into our day-to-day activities. This approach emerged from an empirical and theoretical projects influenced by emerging literature on consumption in the early 1990s (Katz, 2003). Pederson (2005) suggests that domestication research findings should be used to provide a model that would explain the adoption of complex technologies such as mobile telephony services.
20 Studies of this sort could be aimed at explaining the adoption process or describing the consequences of a new product’s use from a social perspective.
Fischer (1992) using a domestication approach analyzed how the telephone technology permeated and transformed the essence of daily activities. Other technologies that have been studied using this approach are television and personal computers (Silverstone & Haddon, 1996). Here, they focused on explaining the dynamics of innovation, by privileging the role and perspective of the consumer. In other words, they looked at ICT as a social and cultural process.
2.3.3 Diffusion Approach
A classical diffusion approach is Rogers diffusion of innovation theory. Rogers diffusion of innovation theory involves the process by which an innovation is communicated through certain channels over time among the members of a social system (Rogers, 1962). Here, the characteristics of the innovation as perceived by the members of a social system, determine its rate of adoption. This theory comprises four elements: innovation, communication channels, time and the social system. In sum, new ideas are conveyed through networks and depending on the nature of the network and the role of its opinion leaders, the innovations are either adopted or rejected (Manueli, Latu, & Koh, 2007).
a) Innovation
The characteristics that determine how quickly an innovation is adopted are; relative advantage over existing products, compatibility, complexity, trialability, observability to the people within the social system.
21 b) Communication
Two main communication channels through which information get from one individual to another, are identified; mass media channels; which are more effective in creating knowledge about innovation and interpersonal channels; which are more effective in changing attitude towards a new idea. These two channels influence the decision to adopt or reject a new idea.
c) Social system
The social system comprises a boundary within which an innovation is diffused. The focus here is on how the social system’s structure affects the diffusion.
d) Time
The time dimension could be implicated in the diffusion process in three ways; innovation decision process, innovativeness and rate of adoption. The innovation decision process is the mental process through which an individual passes from first knowledge of an innovation to confirmation of his decision. Innovativeness is the degree to which an individual is relatively earlier in adopting new ideas than others. Rate of adoption refers to the number of members of the system that adopt innovation in a given time.
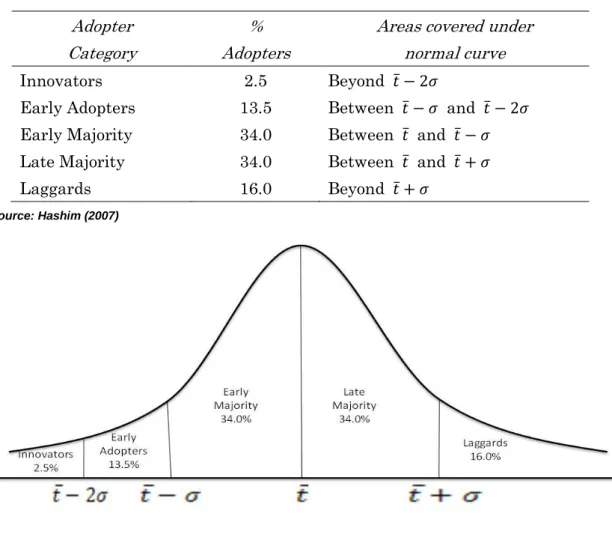
Rogers (1983) developed a methodology to determine the adopter categories. Here, he assumed that noncumulative adopter distribution follows a bell-shaped curve. Thus, the mean time of adoption ( ̅) and its standard deviation ( ) is required in order to generate the normal adopter distribution. Following the inflection or turning points of the normal curve, five adopter categories could be derived, as presented on Table 1 below.
22
Table 1: Adopter Categorization of Rogers Diffusion Model Adopter
Category
% Adopters
Areas covered under normal curve
Innovators 2.5 Beyond ̅
Early Adopters 13.5 Between ̅ and ̅ Early Majority 34.0 Between ̅ and ̅ Late Majority 34.0 Between ̅ and ̅
Laggards 16.0 Beyond ̅
Source: Hashim (2007)
Source: Martinez, Polo, & Flavian (1998)
Figure 1: Adopter Categorization of Rogers Diffusion Model
Rogers model of diffusion is easy to use. More so, the fact that the diffusion curve is assumed to be normal, permits the continuous acceptance of the product to be included and predicted in the adopter categories. In addition to this, it offers mutually exclusive standardized categories, which allow results to be compared, replicated and generalized across studies (Mahajan, Muller, & Srivastava, 1990). This attributed has made Rogers diffusion model one of the most accepted and employed model to investigate diffusion of products.
23 2.3.4 Bass Diffusion Model Vs Rogers Diffusion Model
Despite Rogers model simplicity, it provides no analytical or empirical evidence of why the size of the adopter categories should be the same for all new products (Mahajan, Muller, & Srivastava, 1990). In other words, its theoretical constitution does not explain why the size of innovators should be 2.5% regardless of the product being concerned. More so, Peterson (1973) argued that it is misleading to apply the basic normality assumption to different type of innovations and innovations environment. To prove the normality assumption is far from reality, he cited a number of instances where the product or innovation exhibited a non-normal distribution of adopters.
Mahajan, Muller, & Srivastava (1990) showed that the Bass diffusion model could be a more suitable way of developing the adopter categories of a new product. The reasons they advanced this premise is that;
1) The bass model does not assume the diffusion process exhibits a normal distribution,
2) It exploits certain unique analytical properties of diffusion models to derive adopter categories,
3) Inter-study comparisons can be made using the common values of the model’s parameters that describe the adopter distribution,
4) Continuous acceptance of new products can be included in the adopter categories.
Bass diffusion model overcomes the shortcomings of Rogers model by generating a category structure which consist of a size of adopters not identical for all innovations. At the same time, it retains the advantages of Rogers model such as the
24 possibility of predicting and linking continuous acceptance of new products to the model and the opportunity to compare results across studies. More so, among the different diffusion models used, Bass model is the only one that explicitly considers the communication process for innovation diffusion proposed by Rogers (Mahajan, Muller, & Srivastava, 1990). This makes Bass diffusion model an ideal substitute to the classical diffusion approach proposed by Rogers. It is for this reasons that Bass model was made a basis for the study of diffusion of ICT in Cameroon SMEs.
2.4 Theoretical Framework of Bass Diffusion Model
The Bass model proposes that the probability of purchase of a product (or adoption of technology as the case may be) at a given point in time is a linear function of the total proportion of previous buyers driven by innovation and imitation (Bass, 1969).
P(t) = p + qF(t) (1)
Where:
P(t): Probability of purchase
F(t): Total proportion of previous buyers p: coefficient of innovation (external influence) q:coeffiecient of imitation (internal influence)
The coefficient of innovation, p, is most commonly accepted as the coefficient of external influence. That is, the spread of an innovation due to external sources of information such as mass media. This basically involves any agent other than prior adopters that could influence the diffusion process including sales people and
25 government agencies too. Similarly, the coefficient of imitation, q, is referred to as the coefficient of internal influence. That is, one that measures the spread of an innovation due to internal or interpersonal source of information such as word-of-mouth. In other terms, adoption of a technology here is as a result of personal contact.
The number of people who have not yet adopted the technology is 1 – F(t). That is, the total fraction of potential adopters in a population (which is 1) minus the total proportion of previous buyers. From there, we can express the number of adopters at a given time t as the number of people who have not yet adopted times their probability of purchase, mathematically:
f(t) = [1-F(t)]P(t) (2)
Substituting (1) into (2) yields the following equation
f(t) = p+ [q – p]F(t) – qF(t)2 (3)
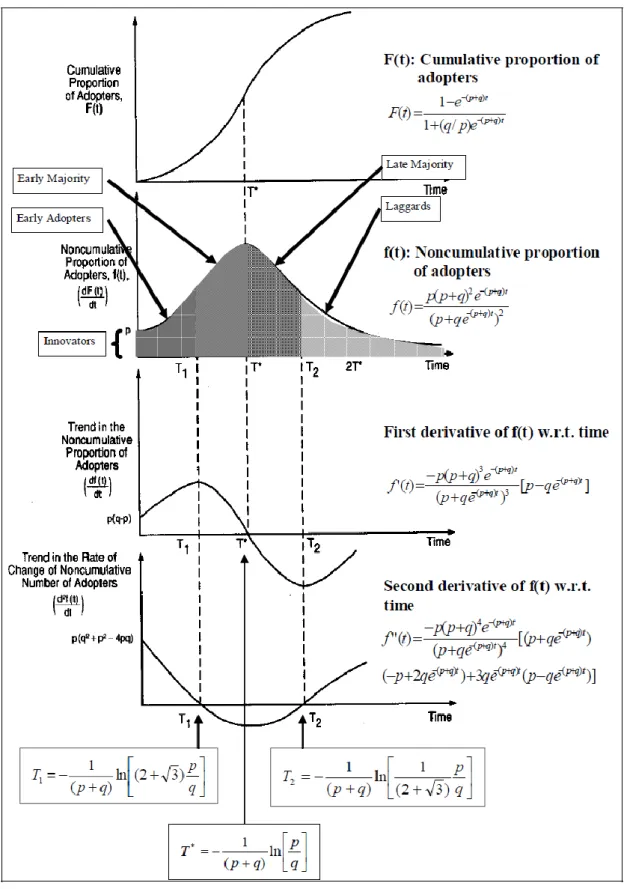
Integration of equation (3) yields the S-shaped cumulative adopter distribution, F(t) (the total proportion of previous buyers), which is modeled by Bass Model (with p, q ≥ 0) as follows:
( ) ( )
( ) ( ) (4)
Substituting equation (4) in equation (3), yields the following model:
( ) ( )( ( ) ( ) ) (5)
Equation (5) above, yields the noncumulative adopter distribution. By employing a first and second order differential of equation (5) with respect to time (t), we can find the turning points of the curve. Thus when f’(t)=0 we can derive the peak time of adoption denoted as T*.
26 The peak time of adoption, that is the point where f(t) reaches its maximum, should correspond to the inflection point of F(t). In other words, the point of time when the noncumulative adopters attain the critical mass should correspond to the time when the cumulative adopters reach the turning point of the S-shaped curve. Making t the subject of the equation when f’(t)=0 yields the following results;
( ) * + (6)
In the same light, we can compute F(T*), the total proportion of previous adopters at peak time T* and we can also compute f(T*), the number of adopters at peak time, T*. This is done by substituting the T* in the corresponding equations. Mahajan, Muller, & Srivastava (1990) went a step further to propose a method to determine innovation-specific adopter categories using this model. Mathematically;
( ) (7)
( ) ( ) (8)
Equally, the second order differential, ( ), of the noncumulative adopter distribution is;
( ) ( ) ( )
( ( ) ) [(
( ) )( ( ) ) ( ) ( ( ) )] (9)
Thus solving for t when f’’(t) = 0, gives the following 2 solutions;
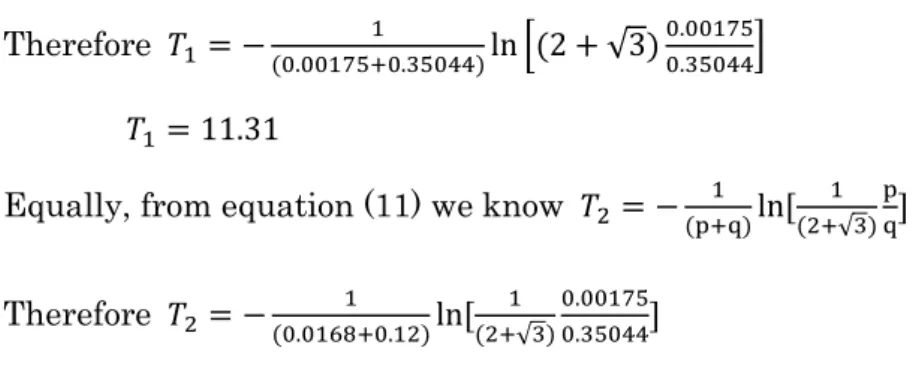
( ) *( √ ) + (10)
And, ( ) ( √ ) (11)
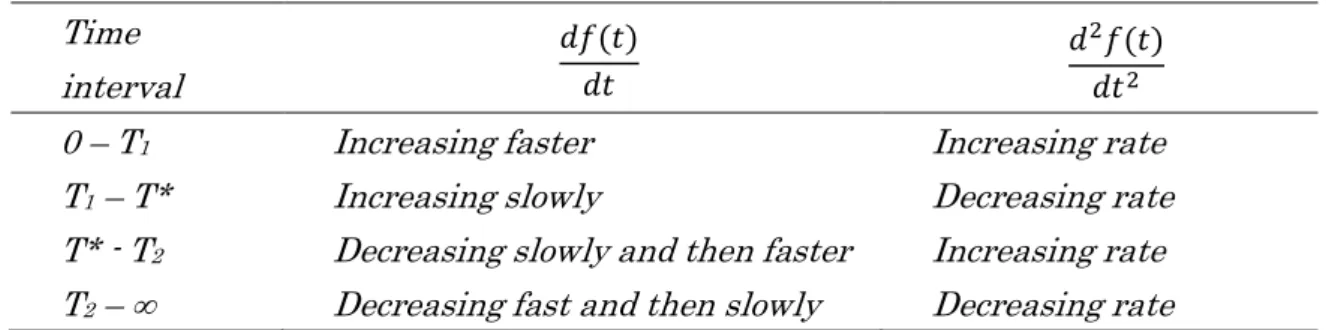
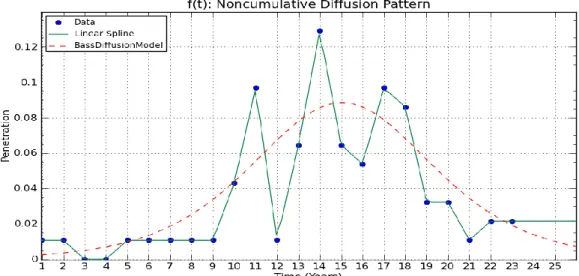
The observations on the curve could help determine the adopter categories. Studies have shown that trends can be used as an indication of the adoption pattern that the population of potential adopters may exhibit in its acceptance of the innovation
27 (Mahajan, Muller, & Srivastava, 1990). These trends can be obtained from the rates of change along the whole distribution. As a matter of fact, these trends for the Bass Model were summarized as illustrated in the table below.
Table 2: Different Trends of Adopters’ Noncumulative Distribution Time interval ( ) ( )
0 – T1 Increasing faster Increasing rate
T1 – T* Increasing slowly Decreasing rate
T* - T2 Decreasing slowly and then faster Increasing rate
T2 – ∞ Decreasing fast and then slowly Decreasing rate
Source: Mahajan, Muller, & Srivastava (1990)
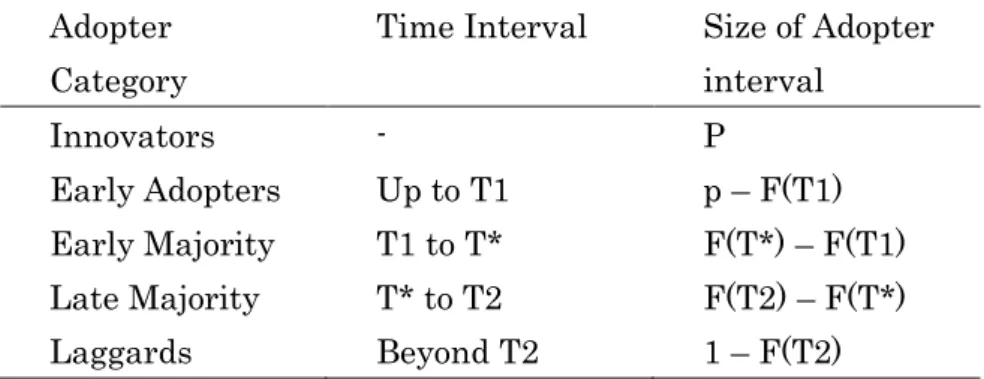
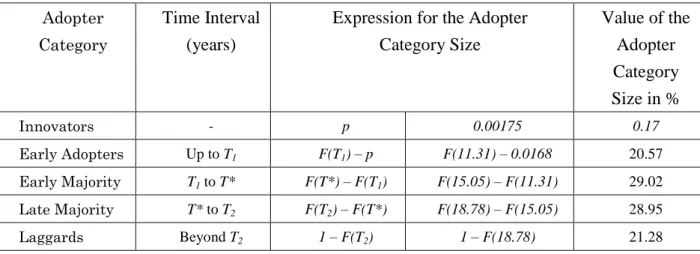
Based on these identified patterns, one can categorize adopters into four (4) groups, namely: early adopters, early majority, late adopters, and laggards. Following the noncumulative adopters distribution of the Bass model, one notices that the curve cuts the ordinate (y-axis). Thus f(t=0) is the fraction of adopters who initiated the diffusion process, also referred to as innovators. This assumption leads to five (5) categories of adopters just like Rogers Diffusion Model. This makes it easier to compare the size of each corresponding category in both models. In addition, it is worth mentioning that the categorization of the adopters of both models is based on the same analytic reasoning. That is, the classification of the adopters is based on the inflection points of each of the distributions.
In addition to this, the size of each category of adopters can be calculated when the corresponding time intervals are known. In order to obtain the proportion of individuals included in each category of adopters, one simply has to calculate the cumulative proportion of adopters F(t) using the equation (4) at each of T1, T*, and T2
28 respectively, and deduct the proportion in the previous categories. Table 3 describes this procedure.
Table 3: Different Category of Adopters in Bass Model
Adopter Category
Time Interval Size of Adopter interval Innovators - P Early Adopters Up to T1 p – F(T1) Early Majority T1 to T* F(T*) – F(T1) Late Majority T* to T2 F(T2) – F(T*) Laggards Beyond T2 1 – F(T2)
29
Source: Wong, Yap, Turner, & Rexha (2011)
30
3. THE CASE OF CAMEROON
3.1 Introduction to Cameroon’s Economy
Cameroon is located in the crossroad between central Africa and West Africa. It is a developing country blessed with a variety of natural resources. It is often referred to as “Africa in miniature” since it embodies most of the continents characteristics. It is a very diverse country with a multitude of landscapes, climates and ethnicities. Cameroon currently has a population of about 19.9 million according to the United Nations(2010) spread over 475,000 km2.
After independence in the 1960s, agriculture accounted for more than 40% of the GDP, while secondary sector contributed about 15%. Economic growth was mostly generated from a mixture of cash crops and subsistence crops. The economic growth was accelerated after the discovery of oil in the 1970s. The exploitation of oil coupled with intense agriculture saw the Gross Domestic Product (GDP) and export raise greatly. The resulting internal and external surpluses caused an increase in both private sector and government investments (Soderling, 1999). Cameroon thus experienced an economic boom with its growth rate increasing at an average rate of 6% per year with crude oil and agriculture being its main source of growth.
In 1986, when the market prices of oil, cocoa and coffee plummeted, Cameroon’s economy collapsed. The CFA franc became overvalued thus making Cameroon’s agric products more expensive and less competitive on international markets. These series of events plunged the country’s economy into a long and deep crisis, which ended in 1995 after the currency was devalued (Nkama, 2006).
The government of Cameroon with the support of the World Bank and UNDP set up a macro-model aimed at identifying the country’s main economic aggregates.
31 This framework was put in place to ultimately serve the Poverty Reduction Strategy Program (PRSP) directed at speeding economic diversification and boosting GDP (Nkama, 2006).
More recently, real economic growth accelerated to 4.1% in 2008, thanks to good results in the oil sector, ongoing infrastructure work, increased energy supply and programs to boost agriculture (African Development Bank, 2009). In an attempt to improve these results, the government has launched many development projects across the nation. The government has also put in effect policies aimed at promoting SME growth to achieve its goals.
3.2 SME Law in Cameroon
According to the Cameroon Law, SMEs are subdivided into three groups; Very Small Enterprises (VSEs), Small-sized Enterprises (SEs) and Medium-sized Enterprises (MEs). The SMEs are categorized in the National SME file on the basis of number of permanent employees and turnover when they registered. A company is considered a VSE if it has no more than 5 employees and an annual pre-tax turnover of no more than 15 (fifteen) million CFA francs. SEs are companies with 6 (six) to 20 (twenty) employees and an annual pre-tax turnover ranging from 15 (fifteen) million to 100 (one hundred) million CFA francs (National Assembly of Cameroon, 2010). An enterprise shall be considered an ME if it has 21 (twenty one) to 100 (one hundred) employees and an annual pre-tax turnover of more than 100 (one hundred) million CFA francs and less than 1 (one) billion CFA francs. Some difficulties might arise when trying to classify an enterprise, in that case the main criterion considered becomes the annual pre-tax return. However, for an SME to be considered as being setup it must fulfill the conditions for legal existence and the formalities specified by the law and regulations in force.
32 In order to support and oversee the policies above, the ministry in charge of Small and Medium Enterprises was created in Cameroon in 2004. Among others, this ministry has the responsibility to (National Assembly of Cameroon, 2010);
To promote and supervise SMEs
To help enhance socio-economic development of the country
To establish, in partnership with other professional bodies, a database for investors in this sector
To undertake studies in view of promoting information flow and migration of informal enterprises into the formal sector
The National Institute of Statistics in partnership with Social Security body (CNPS) latest survey in 2003 indicates that 80% of companies in Cameroon are SMEs. As a matter of fact out of 72,258 enterprises registered to the CNPS, 57,806 are in the SME sector (Research ICT Africa, 2006). The Littoral region leads the pack with 46.9% followed by the Center region with 19.4%. This explains the choice to conduct the survey for this study in these 2 regions since they account for about two third of the total population of SMEs in the country.
These figures should be taken with caution as they could be misleading since they just account for the companies registered with the Social Security body. However, a significant number of businesses in Cameroon operate in the informal sector and are thus not taken into consideration in the above statistics.
33
3.3 Current State of ICT in Cameroon
ICT in Cameroon is still in an infant stage. In most developed countries, access to computers, internet, telephony, radio and television are considered basic goods, which should be available to everyone in the society, this is not the case in Cameroon (Linden, 2011). Despite the increase in telecommunication market by more than 30% per year since 2002, penetration and usage is still far from adequate due to limited availability and affordability (Emage, 2006). However, the proliferation of cybercafés and public telephones has been helping fill this void. Emage (2002) adds that, ICT demand and usage is currently driven by personal activities or market strategies of the communication providers due to absence of coherent ICT policy.
Attributes of mobile and wireless technology systems such as low overhead cost, digitalized networks, falling costs of technological devices and ease of use, have helped facilitate their penetration into localities of the country. The mobile subscriptions have been growing at over 270% per annum for the last five years and now represent well over 80% of all phones in the country (Emage, 2006). In 2008 estimates showed that about 80% of the population had access to a phone (Arreymbi, Agbor, & Adnan, 2008).
However, looking at the Internet connectivity the number is still very low and the awareness of Internet among the general population is often nonexistent as the Internet penetration level is just around 4% in 2009 (Linden, 2011). The most popular Internet services are the Web, site hosting, e-mail, discussion forums and voice over Internet protocol (VoIP) service. Connections are by very small aperture terminal (VSAT) technology, public switched network, radio or wire leased line, or wireless (Wifi) (African Development Bank, 2009).
34
4. METHODOLOGY
Figure 3: Research Framework 4.1. Collection of Data
In order to verify the first hypothesis, it is important to collect data for SME performance and ICT Diffusion. Data for SME performance was obtained from IMD (World Competitiveness online) database. The IMD data provides an SME efficiency index for 58 countries based on their impact on global economy. These 58 countries shall be used in our cross-country analyses. As for ICT Diffusion, the data was collected from United Nations Conference on Trade and Development (UNCTAD) report, and is solely based on the year 2005.
The ICT Diffusion index is designed to evaluate ICT development using indicators of ICT diffusion across countries (United Nations Conference on Trade and
35 Development (UNCTAD), 2006). It measures the ICT diffusion index by averaging dimensions of connectivity and access. Connectivity here comprises the indicators; internet subscribers per capita, number of PCs per capita, number of telephone mainline per capita and the number of mobile phone subscribers per capita. Whereas Access consists of; the cost of local calls, GDP per capita, adult literacy rate and internet users. Index scores for each of these indicators are computed using the formula; value achieved / maximum reference value. Then the corresponding indicators are averaged in order to obtain the measure for access and connectivity.
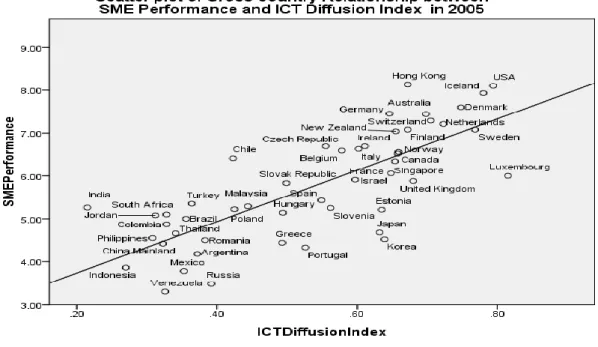
The SME performance and the corresponding ICT diffusion index for the year 2005 across the given 58 countries was then correlated in order to establish, if any, a relationship between these two variables.
The second part of the research involved the distribution of questionnaires to SMEs in Cameroon. The questionnaire is designed to obtain information about adoption of ICT at the SME level in Cameroon. One hundred (100) questionnaires were personally distributed in two (2) regions of Cameroon; Littoral region and Central region, the economic and administrative capitals respectively. A purposive sampling was conducted in these two regions in order to reach the targeted sample in due time.
In order to model the diffusion pattern of ICT for SMEs in Cameroon using Bass model, the data required is the time of its adoption. The constructed questionnaire therefore sought information in the following areas; (a) adoption time of ICT proxy, (b) characteristics of the respondents, (c) Reasons for adoption or rejection of ICT proxy.
The second hypothesis involves finding out whether the Bass Model can be applied to the ICT diffusion in Cameroon. The two ICT proxies that were used for this research are; computer per capita and internet subscribers per capita. “Per capita” in this
36 context refers to the small firms surveyed. Thus, the survey was structured to find out whether the firm concerned possessed computer for business purposes, regardless of the number of computers in the firm. In the same light, internet subscription was determined by finding out whether the firm in question had internet access, regardless of the number of employees who actually had access to internet within the company.
Generally, internet subscribers refers to those who pay for access to public internet, be it an IP or TCP connection. Internet subscribers is one of the main indicators of ICT diffusion. According to the United Nations Report; Core ICT Indicators (2005) this statistic is measured irrespective of the type of speed of access, the type of device used to access the internet or the method of payment. This implies that this indicator includes individuals who pay for internet via the cost of telephone calls. The fact that internet subscribers contain proportions of mobile telephone subscribers renders it an appropriate measure of ICT in this analysis.
Internet Subscription per firm in the Republic of Cameroon was collected from the questionnaire submitted to the SMEs. Internet subscription data usually appears as the proportion of the total population that has internet access. The data obtained from the survey would therefore be expressed as a percentage of the total adopters investigated.
The questionnaire was made up of 13 structured questions to address the three (3) main parts stated above. Previous models that have been developed to examine the adoption of ICT at the firm level, identified numerous factors that determine ICT adoption in a firm. Bayo-Moriones & Lera-Lopez (2007) identified the five (5) most accepted factors, namely; environment, firm structural characteristics, human capital, competitive strategies and internal organization. Elements of this model were adopted