TUMSAT-OACIS Repository - Tokyo University of Marine Science and Technology (東京海洋大学)
Research on capsizing alert based on detection
of three-dimensional center of gravity
学位名
修士(工学)
学位授与機関
東京海洋大学
学位授与年度
2020
Master’s thesis
RESEARCH ON CAPSIZING ALERT BASED ON
DETECTION OF THREE - DIMENSIONAL CENTER
OF GRAVITY
September 2020
Graduate School of Marine Science and Technology
Tokyo University of Marine Science and Technology
Master’s Course of Marine Technology and Logistics
Master’s thesis
RESEARCH ON CAPSIZING ALERT BASED ON
DETECTION OF THREE - DIMENSIONAL CENTER
OF GRAVITY
September 2020
Graduate School of Marine Science and Technology
Tokyo University of Marine Science and Technology
Master’s Course of Marine Technology and Logistics
Content
Abstract: ... 1
1. Introduction ... 2
2. Study Background ... 3
2.1. Famous vessel accidents in China and around the world ... 3
2.1.1. Accident in China ... 4
2.1.2. accident in the world ... 7
2.2. Reflections on the accident ... 8
2.3. The necessity of D3DCG research ... 9
3. Theory of D3DCG ... 9
3.1. Theory of D3DCG on vehicle ... 10
3.2. D3DCG Theory generalize to vessels ... 13
3.2.1. Theory of ship stability ... 13
3.2.2. Theory of D3DCG on vessels ... 16
3.2.3. Influencing factors of rolling and heaving ... 18
4. Capsizing experiment in enclosed water ... 19
4.1. Experiment with steel weight ... 20
4.1.1. Equipment experiment ... 20
4.1.2. Experiment on a tugboat model ship ... 22
4.1.3. Experiment on a workboat model ship ... 27
4.1.4. Experiment on a cargo boat model ship ... 30
4.1.5. Comparison among three steel experiments on FFT results ... 32
4.2. Experiment with ice weight ... 34
4.2.1. Equipment of experiment ... 34
4.2.2. Experiment on a tugboat ship model ... 35
4.2.3. Experiment on a workboat ship model ... 39
4.2.4. Experiment on a cargo boat ship model ... 42
4.2.5. Comparison among three steel experiments on FFT results ... 45
4.3. Conclusion of the experiments by D3DCG ... 46
4.3.1. Result of experiment with steel weight by D3DCG ... 46
4.3.2. result of experiment with ice weight by D3DCG ... 48
5. Capsizing experiment in open water ... 49
5.1. Process of experiment ... 49
5.1.1. Experiment on a tugboat ship model ... 50
5.1.2. Experiment on a workboat ship model ... 53
5.1.3. Experiment on a cargo boat ship model ... 56
5.2. Analyses of capsizing risk on experiment data by D3DCG ... 58
5.2.1. Conclusion of FFT result ... 58
5.2.2. Result by D3DCG concept ... 59
Abstract:
Water transportation is one of the most important ways for human beings. Along with the development of water transportation,it is necessary for us to focus on transportation security and safety. Therefore,research of capsizing alarm index is valuable. This paper investigates the capsizing alarm index by applying the theory of detection of three dimensional center of gravity (D3DCG) to ship to prevent capsizing accidents during marine transportation. The main objective is use D3DCG concept to measure ship floating in different condition. Through the experiment result to create a capsizing alarm index.
The experiment contains still water experiment,turbulence water experiment and open water experiment. At the same time,for getting more specific data,three different ship models are provided. They are tug boat,cargo boat and work boat. A jack is used for experiment to change height of weight. Through these facilities can get many different results in different floating conditions with different structure ship models. From these results, as ship model’s structure and jack’s height changes,center of gravity of ship model also changes. Safety floating condition and dangerous floating condition can be formed easily.
This paper mainly use some experiments to get data of different ship types in different water condition with different height,so that we can find change rules of center of gravity with different ships. From the result can see that when loading position of weight is rising, ships will be in dangerous condition, especially for some narrow and long ships. At the meantime, ballast is also important for ships, when ship type is similar, ship which has proper draft will be safer. D3DCG research in this paper can solve some safety problems during vessels works,especially some small vessels without capsizing alarm system. When the center of gravity of ships rise to dangerous condition, D3DCG system will alarm crew immediately so that emergency measures can be done in a short time. This capsizing alert system can prevent accident happening effectively , and it’s value to research and develop it.
1. Introduction
This paper mainly introduces research on capsizing alert based on the theory of detection of three dimensional center of gravity. This paper focus on the different ship types and different weight loading position, therefore it can be concluded the theory of D3DCG work process on different situation.
This paper will divide into six chapters. A brief introduction of content of each chapter is described as following.
Chapter 1 introduces whole contents briefly.
Chapter 2 mainly talks about the research background. When capsizing accidents happened, always caused huge affected on human’s life, so every capsizing accident should be emphasized. Accident’s statics in Zhejiang province, China were showed in this chapter. From the statics could see that although capsizing accident proportion is not high, it would cause huge property damage. And famous Chinese Eastern Star accident and South Korean Sewol accident were exampled in this part, from the investigation in both countries, the limitation of stability theory was found. So theory of D3DCG as a new method was put forward to solve capsizing accident. This paper also will explain the necessity of researching theory of D3DCG.
Theory of D3DCG is introduced in chapter 3. Firstly, theory of D3DCG on ground vehicle is introduced, contains the most basic principle and basic equations. For ground vehicle, there are two unknown value, so finally two equations are obtained to calculate the result. For better understanding D3DCG on ships, basic principle of ship stability also should be known, three kinds of ship floating condition is talked about in this chapter, at the meanwhile, the shortcomings of stable theory also are proposed. So the necessity of new method D3DCG is reflected. Theory of D3DCG on ships have three unknown value l,lmax and b, so three equations are needed. And based on the theory of rolling
Chapter 4 mainly introduce preliminary experiment in water tank. All the experiment was done in the laboratory. Experiment was divided into two steps, the first step is using steel weight, this experiment is mainly to determine theory D3DCG is working on different ship types and to make sure as weight height changed, the result is reasonable. The second step is using ice weight instead of steel weight, this step experiment is mainly to prepare for open water experiment, in order to protect environment and much easier operating process, ice is used to instead of steel. For match different types model ships, different type ice is prepared. Experiment use jack to change weight height, and use air bumbling to simulate small waves. After getting data from sensor, using FFT get rolling and heaving frequency result, and finally through theory D3DCG to get three unknow value l,lmax and b. Compared each model ship’s result, discover the relationship between ship type and
l,lmax and b.
Chapter 5 continues last chapter experiment, in this chapter, experiment in real sea was done. In this experiment, ice weight was used, all the experiment process was done in the pond of Tokyo University of Marine Science and Technology. For doing this experiment, external force should be thought about, model ships were influenced by waves and winds in the open water. As the getting the result, it was much confirmed that D3DCG concept can work on different type ships, and as the weight loading position getting higher, model ship becomes more unstable. And finally the relationship between l,lmax and b were also figured out.
Chapter 6 is the conclusion of all the experiment contents. Talking about the Significance of D3DCG theory research and the advantage of developing D3DCG devices.
2. Study Background
Water transportation always play an important role in a country’s economy, so to prevent maritime accident happening is necessary. It is relate to people’s safety, property, natural environment, etc.
2.1.1. Accident in China
As we all know China is a big country with complex water area,so it’s difficult to manage every channels. Sometimes accidents happening in unexpected situation. Because China is too huge to make a complete statistics,this paper select Zhejiang province as an example[1].
(1) Basic information of Zhejiang Province
Zhejiang is located in the middle section of the north-south channel in China. Port resource is unique, coastal channel and routes are extended in all directions. The customary route is nearly 5000 kilometers long. The flow of ships is large. The types of ships are diverse. Zhejiang has a long coastline and deep water, with 290.4 kilometers of deep-water shoreline, accounting for 33% of the China’s deep water shoreline, of which the shoreline that can build large berths of more than 100,000 tons is 105.8 kilometers long; there are a large number of 300,000-ton deep-water channels. Coastal port can berth up to 400,000-ton ships. Zhejiang is an important gateway for China ’s coast to radiate the world, connecting more than 600 ports in more than 100 countries and regions around the world, with more than 200 container routes, and there are more than 120 ocean routes among them.
(2)Water transportation accidents
Because Zhejiang sea area has a large number of ship flows with complex navigation environment, it is easy to cause security accidents. From 2001 to 2016, 1429 above general grade accidents happening in Zhejiang coastal area, 1046 people were killed and missing,799 ships sank, caused 17 billion Yuan lost. Table 2.1 shows statistics of 2001-2016 transportation accidents.
Figure 2.1 statistics of accidents in coastal waters in Zhejiang during 2001-2016 Source from Research on the Evaluation Index System of Zhejiang “Safety Sea Area”
Construction[1]
Table2.1 accidents statistics in Zhejiang coast during 2001-2016 Year Number of the
accident Number of dead and missing Number of ships lost Economic losses (ten thousand yuan) 2001 236 81 93 14517.00 2002 200 75 85 7688.14 2003 109 66 64 9221.57 2004 91 69 57 6797.44 2005 95 65 57 14922.30 2006 93 85 50 7754.76 2007 81 106 59 13421.19 2008 98 84 64 18135.28 2009 94 68 56 16110.58 2010 63 85 46 10661.17 2011 55 62 35 7491.55 2012 52 30 31 7403.26 2013 63 28 43 11317.28 2014 40 35 25 8369.11 2015 33 53 15 7223.4 2016 26 54 19 7019.3 Summary 1429 1046 799 168053.33
As show in the figure 2.1 , Zhejiang coastal accidents show decreasing tendency in recent years. However, due to the strong correlation in accidents, at the time being, accidents are relate to
0 2000 4000 6000 8000 10000 12000 14000 16000 18000 20000 0 50 100 150 200 250 2001200220032004200520062007200820092010201120122013201420152016 ec o n o mi c lo ss es qu antit y year
Number of the accident Number of dead and missing
environment, weather, etc, there will be some fluctuations in individual years. The direct economic losses of accidents show strong volatility, mainly because large ship accidents generally cause large economic losses, so more attention should be paid to the accident situation of large ships.
Table 2.2 accident type and grade statistics in Zhejiang coast during 2001-2016 Source from Research on the Evaluation Index System of Zhejiang “Safety Sea Area”
Accident types Accident grades Totally
number of accidents
Rate of accidents Ordinary accident Larger accident Major accident
Number Rate Number Rate Number Rate
Ship collision 35 42% 41 41% 13 43% 89 42% Capsize 14 17% 33 33% 8 27% 55 26% Contact loss 17 20% 12 12% 5 17% 34 16% On the rocks 3 4% 4 4% 3 10% 10 5% Fire explosion 3 4% 4 4% 0 0% 7 3% Run aground 3 4% 1 1% 0 0% 4 2% Swell damage 1 1% 1 1% 1 3% 3 1% Wind damage 0 0% 2 2% 0 0% 2 1% others 8 10% 1 1% 0 0% 9 4% summary 84 99 30 213 100% rate 39% 47% 14% 100%
From the table2.2 we can see that ship collision accidents account for the highest proportion among all the accidents, but capsize accidents also account for high proportion. Due to capsize accidents always cause people death and cargo losses, it will cause heavy property losses. (3) Eastern Star cruise ship capsizing accident
Eastern Star cruise ship capsizing accident happened at 21:30 on June 1st,2015. The occurred
place was in Yangtze River Damazhou Waterway, Jianli County, Hubei, China. On June 13, it was finally confirmed that there were 454 people on board at the time of the accident, including 403 tourists, 46 crew members, and 5 travel agency staff. A total of 442 people were killed and only 12 people were rescued. Both the captain and the chief engineer were rescued, and the certificate of competency was revoked.
Figure 2.2 Eastern Star Salvage Source from China Daily[6]
According to the investigation,Eastern Star is not equipped with an automatic alarm system, nor is it equipped with a marine black box, and after the transformation of the Eastern Star, the superstructure was added, resulting in an unstable center of gravity. Although this ship conform to the construction requirements, it cannot sail in extremely harsh weather. When the accident happened, Eastern star meet a strong wind but still kept sailing, finally capsized.
2.1.2. accident in the world
Except China,there are many serious marine accidents happened in the world.
Focus on South Korea, a worldwide famous marine accident called Sewol ferry capsizing accident has ever happened.
Sewol ferry capsizing accident happened at 23:48 on April 15th ,2014. At the time of the accident,
476 people were carried, 325 of which were high school students in Anshan Tanyuan Higher School. A total of 304 passengers and crew were killed in this accident, the most serious ferry disaster in
South Korea since the end of 1970.
Figure 2.3 Sewol Ferry Savage Source from China Daily[5]
From the investigation of South Korea government, get some possible causes of the accident: (1) Unreasonable sudden turn
(2) Cargo overload
Sewol ferry carried 2147.2 tons of cargo, more than twice the standard lord. (3) Insufficient ballast water and lack of balance resilience
Sewol ferry only carried 761.2 tons of ballast water, lower than the standard ballast water. (4) Inappropriate hull modification
The number of passengers in the third, fourth and fifth deck cabins of the ship has been modified and expanded, which is the main cause of the accident.
(5) Structural cut-off
Causes of this accident is similar to the Eastern Star, both ships were modified before using. Some inappropriate modifications finally became the main accident reasons.
and capsize accidents always cause huge property losses and a lot of people death. In order to decrease the loss of this kind of marine accidents, capsizing alarm system is valuable to research.
When accident happened, this kind of system can warn people, so that people can bracing immediately.
2.3. The necessity of D3DCG research
D3DCG (detection of three dimensional center of gravity) theory is a method for prevent capsize from happening. From the device which is supported by D3DCG theory, we can clearly see the ship's driving status, if dangerous driving condition appears, we will get feedback by the device.
From section 2.1 we can see that marine accidents always cause by collision and capsizing, and both of them will cause damage to people and property. Many ships’ stability have been decided when they built, some traditional stability calculating method are not suitable for a moving ships. So some kinds of security system is necessary.
D3DCG can provide a new stability verification system, it can detect and prevent ship from capsizing in real time. In addition, compare with some security devices, D3DCG equipment is cheaper to install so that it can be used for all kinds of ships, especially some small vessels like fishing boat. It will help all the operators to know the condition of their vessels. By using this equipment, the probability of accidents will be greatly reduced.
3. Theory of D3DCG
In this chapter, in order to help understand Detection of 3-Dimensional Center of Gravity, two parts will be proposed, contain theory of D3DCG on vehicle and vessels. Some equations and principles will be explained.
3.1. Theory of D3DCG on vehicle
In daily life, it is difficult for people to determine the center of gravity of the vehicle, only standard load can be known from production information. And almost vehicles don’t have security system, so theory of D3DCG was proposed to solve these problems.
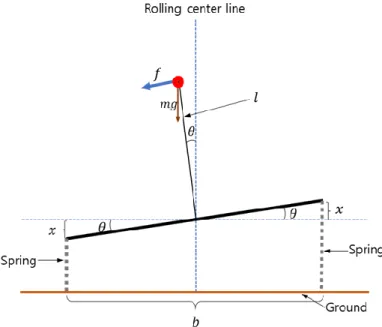
For a ground vehicle, in the cross section, using two springs to replace two tires, and the rolling motion is related to these two springs. In Figure 3.1, the structure of ground vehicle in cross section is shown. In order to a better understanding of theory of D3DCG.The following formula can be used to express the freedom of motion of the vehicle.
(1) Formulation of the vehicle’s simple harmonic motion 𝑇′ = 2𝜋√2𝑘𝑚 …(1) 𝑇′:vertical direction vibration period
𝑘:spring constant of vehicle 𝑚:mass
𝜋:circle rate
(2) Formulation of heel movement of the vehicle 𝑙𝑓 = −𝑘𝑥𝑏
2+ 𝑚𝑔𝑙 sin 𝜃 − 𝑘𝑥 𝑏 2 = −𝑘𝑥𝑏 + 𝑚𝑔𝑙 sin 𝜃 …(2) 𝑓:force added to the tangential direction of the center θ:rolling angle
𝑙:length from vehicle’s bottom center to center of gravity 𝑏:length between those two springs
Figure 3.1 The cross section of the ground vehicle for understanding D3DCG equation Source from alarm indexes of capsizing based on the detection of three dimensional center
of gravity Ko Wansik[3]
From Figure 3.1, x can be written as: 𝑥 =𝑏
2sin 𝜃 Insert this equation into equation(2):
𝑙𝑓 = −𝑘𝑏 2 2 sin 𝜃 + 𝑚𝑔𝑙 sin 𝜃 = −𝑚 ( 𝑘𝑏2 2𝑚𝑠𝑖𝑛 𝜃 − 𝑔𝑙 sin 𝜃) = −𝑚 ( 𝑘𝑏2 2𝑚− 𝑔𝑙) sin 𝜃 ∴ 𝑓 = −𝑚𝑙 (𝑘𝑏2𝑚2− 𝑔𝑙) sin 𝜃 …(3)
The rolling angle θ is enough small, so that we can consider sinθ ≈θ , So, the above equation can also be changed to
𝑓 = −𝑚𝑙 (𝑘𝑏2𝑚2− 𝑔𝑙) 𝜃 …(4)
It is equivalent to the equation of circular motion with l as the radius. So,the equation can be written that 𝑚𝑙𝑑 2𝜃 𝑑𝑡 = 𝑓 = − 𝑚 𝑙 ( 𝑘𝑏2 2𝑚− 𝑔𝑙) 𝜃 𝑑2𝜃 𝑑𝑡 = − 1 𝑙2( 𝑘𝑏2 2𝑚− 𝑔𝑙) 𝜃 𝑑2𝜃 𝑑𝑡 = −𝜔 2𝜃 ∴ 𝜔 =1𝑙√𝑘𝑏2 2𝑚 − 𝑔𝑙 …(5)
Substituting equation(5)into the rolling period T, 𝑇 =2𝜋 𝜔 𝑇 = 2𝜋 1 𝑙 √𝑘𝑏 2 2𝑚 − 𝑔𝑙 = 2𝜋𝑙 √𝑘𝑏2 2𝑚 − 𝑔𝑙 Because frequency and period are in inverse relationship, So
𝑣 = 1
𝑇 = √𝑘𝑏2
2𝑚−𝑔𝑙
2𝜋𝑙 …(6)
And heaving frequency the 𝑣’ is,
𝑣’=𝑇’1 = 1
2𝜋√ 2𝑘
𝑚 …(7)
By squaring both sides of equation(7),
𝑘 𝑚= 2𝜋
2𝑣′2 …(8)
By squaring both sides of equation(6), 4𝜋2𝑙2𝑣2=𝑘𝑏2
2𝑚 − 𝑔𝑙 …(9)
Substituting the equation(8)into the equation(9), 4𝜋2𝑙2𝑣2= 𝑏2𝜋2𝑣’2− 𝑔𝑙 4𝜋2𝑙2𝑣2+ 𝑔𝑙 − 𝑏2𝜋2𝑣’2= 0 ∴ 𝑙2+4𝜋𝑔2𝑣2𝑙 −𝑏
2𝑣’2
4𝑣2 = 0 …(10)
Because g, v, v’ are known value, l can be calculated by above equation.
Because of the limitation of the equation(4),in order to keep stable condition, inside part (11) need to be positive:
(𝑘𝑏2𝑚2− 𝑔𝑙) > 0 …(11) So the maximum of l can be written lmax,
𝑙𝑚𝑎𝑥= 𝑘𝑏2 2𝑚𝑔 𝑙𝑚𝑎𝑥 = 𝜋2𝑣’2𝑏2 𝑔 …(12)
All above equations are used for ground vehicle, for next section will introduce D3DCG equations for ship.
3.2. D3DCG Theory generalize to vessels
Because ship is different from ground vehicle, so the formulations of ground vehicle are not suitable to ship. So in order to calculate the center of gravity of ship, new equations should be proposed.
3.2.1. Theory of ship stability
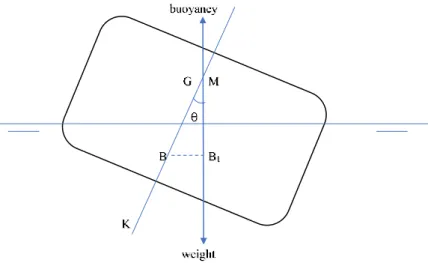
For obtaining the formulation of D3DCG on ship, theory of ship stability needs to be understood. The fundamental concept behind the understanding of intact stability of a floating body is that of Equilibrium. There are three types of equilibrium conditions that can occur, for a floating ship, depending on the relation between the positions of center of gravity and center of buoyancy. The first type condition is stable equilibrium.
(1) Stable equilibrium
(b) Stable equilibrium Figure 3.2 Stable equilibrium
Study the figure above. A stable equilibrium is achieved when the vertical position of G(center of gravity) is lower than the position of M(transverse metacenter). So, when the ship heels to an angle Ɵ, the B (center of buoyancy) will shift to B1. The lateral distance or lever between the weight and buoyancy in this condition results in a moment that brings the ship back to its original upright position.
(2) Neutral Equilibrium:
When the vertical position of G(center of gravity) coincides with the M(transverse metacenter). As shown in the figure below, in such condition, there is no force to help ship return stable condition. As a result, the ship would remain in the heeled position as long as neutral stability prevails. But when ship in this condition, sometimes will cause risk, some of the weight shift may cause capsizing.
Figure 3.3 Neutral equilibrium
(3) unstable Equilibrium:
An unstable equilibrium is caused when the vertical position of G(center of gravity) is higher than the position of M (transverse metacenter).As shown in figure 3.4, when the ship heels to an angle Ɵ, the B (center of buoyancy) will shift to B1. But because of the righting lever is negative, the moment created would result in creating further heel until a condition of stable equilibrium is reached. If the condition of stable equilibrium is not reached , finally it will capsize.
Figure 3.4 Unstable equilibrium
These three conditions consist the main ship stability theory, furthermore, based on this theory, every ship before operated by the first owner, there are perfect information on the ships by design
charts of the ships given by the shipyard typically such as Hydro Static Curve, which are all placed at the chart room of navigations deck. And before departure, ships officers or draft surveys measure ships drafts on the measurement sign (Free Board Mark) painted on the ship’s hull, which is an international regulation by IMO.
However sometimes only stability theory is not useful, if no Hydro Static Curve was available or drafts were not surveyed before departure, present stability theories didn’t work at all and therefore no ships offices knew what kind of loading conditions caused capsizing before departure. This is the case of the river tour boat in Yangzi river in China. Even though Hydro Static Curve was existed on a ship, if some additional structures added on the ship by the owner after the delivery from the shipyard, Hydro Static Curve didn’t work properly anymore. This is the case of the Korean ferry boat. So it’s necessary to find a new method to detecting a ship’s condition, no matter if Hydro Static Curve was available. As this situation’s demand, D3DCG is researched, this is a new theory for detecting ship’s center of gravity, based on this theory, even though there are no Hydro Static Curve or survey of drafts, ship’s stable condition can be found. In next section, D3DCG theory on ships will be introduced.
3.2.2. Theory of D3DCG on vessels
Three different types stable conditions are shown in last section. According to the theory of stability, the G and M are two important value to control ship’s stability. But in the real situation, this theory has a lot of limitations, so base on the D3DCG theory of ground vehicle, a new concept need to proposed.
Figure 3.5 Axis of motion for a ship’s natural motion
Source:Phoo Pyae Thu, March 2018, Innovative Warning System for Capsizing Prevention
As shown in figure 3.5, when ship floating in the open water, ship will be influenced by waves. And waves on the surface water are generated from circular motion. From the surface water, as the circular motion getting smaller until become a point, this point can be regarded as the motion center of wave. This point connect all circular tangents can be regarded as a pivot of wave motion. By the three-dimensional center of gravity(D3DCG)new concept, this pivot can also involve in the ship’hull swinging and can strongly affect ship stability.
Based on the concept upside, three new formulations now is proposed.
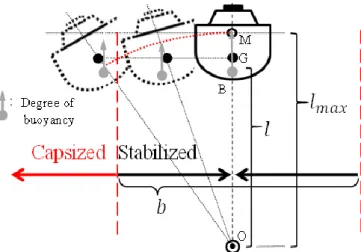
𝑙2+ 𝑔 4𝜋2𝑣2𝑙 − 𝑏2𝑣‘2 4𝑣2 = 0 …(13) 𝑙𝑚𝑎𝑥= 𝜋2𝑣’2𝑏2 𝑔 …(14) (𝑏 2) 2 = (𝑙𝑚𝑎𝑥)2− 𝑙2 …(15)
As shown in the below figure 3.6, l means the perpendicular distance between O and G, lmax means
perpendicular distance between O and M, v means frequency of natural of rolling motion, v’ means
frequency of natural of heaving motion, b means horizontal distance of ship rolling(distance of original G and new G), g means gravitational force constant. Among these value, l and lmax control ship’s floating
condition, lmax decreases as ship rolling, when l >lmax , ship going to capsize.
Compare to the equation of ground vehicle, new unknown value b is added, so a new equation(15) is added, too. Through upside three equations, we can get three unknown values lmax, l,b.
l
Center of gravity Wave motion in water
Ships’ natural motion on the surface of water
Figure 3.6 Hypothesis of Detection of Three-Dimensional Center of Gravity for ships Source:Phoo Pyae Thu, March 2018, Innovative Warning System for Capsizing
Prevention[4]
3.2.3. Influencing factors of rolling and heaving
Rolling and heaving are two important value in theory of D3DCG, so it‘s necessarily to figure out the influencing factors of rolling and heaving. For a ship, except experiment, to obtain the rolling and heaving, formula estimation is a universal way. From the formulation can know the period of rolling and heaving[2].
Rolling natural period formula is shown as below:
… (16) And heaving natural period formula can be written:
𝑇𝑧 = 2𝜋√(∆/𝑔 + 𝑚𝑧𝑧) (𝜌⁄ 𝑤𝐴𝑤)… (17)
Among these two equations, all the symbols are explained below: 𝐼𝑥𝑥: Rolling mass moment of inertia
𝐼𝑦𝑦: Pitching mass moment of inertia
𝐽𝑥𝑥:Rolling additional mass moment of inertia
𝐽𝑦𝑦:Rolling additional mass moment of inertia
∆:Displacement
𝑔:Gravity
𝜌𝑤:Density of water
𝐴𝑤:Waterline area
But for calculating the rolling and heaving natural frequency of ship, it is not enough for only two equations, so the total moment of inertia is put forward:
𝐼’= ∆(𝐵2+ 4𝑧
𝐺2)/(12𝑔)… (18)
Put this equation into (16), the new equation can get:
𝑇∅= 0.58√(𝐵2+ 4𝑧𝐺2)/ℎ𝑇… (19)
Compare to the equation (16), new equation of natural period of rolling eliminates two unknown value 𝐼𝑥𝑥 and 𝐽𝑦𝑦 , based on this equation, 𝑇∅ can be calculated. And we can know that rolling
motion is relate to beam, displacement and height of longitudinal stability of ship.
Due to the equation 𝑚𝑧𝑧 = ∆/𝑔, natural period of heaving also can be expressed as: 𝑇𝑧 = 2.8√𝛻/𝐴𝑤= 2.8√𝐶𝑣𝑝𝑑 … (20)
From equation (20), 𝐶𝑣𝑝 (vertical prismatic coefficient) and d(draft) are known values, so the rolling frequency can get easily. And as we all know 𝐶𝑣𝑝 =𝐶𝐵
𝐶𝑤 , and 𝐶𝐵 =
𝑉
𝐿𝐵𝑑 , 𝐶𝑤= 𝐴𝑤
𝐿𝐵 , so
heaving frequency is mainly relate to value V and Aw. In order to figure out the relationship, the next
chapter will conduct related experiments.
4. Capsizing experiment in enclosed water
The first step experiments were done in the No.3 research building in Etchujima campus of Tokyo University of Marine Science and Technology. For further open water experiment, some basic experiments are necessary. So experiment in enclosed water was prepared for previous research.
4.1. Experiment with steel weight
4.1.1. Equipment experiment
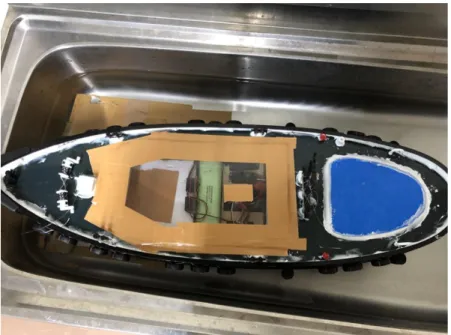
In order to explore the influence factor of capsizing condition, three ship models are prepared. All these three model ships have different size. First one is tugboat model ship, as shown in figure 4.1. This ship model’s superstructure has been removed in order to loading experiment material. For workboat model ship, there is no modification, and model is shown in figure 4.2. Cargo boat ship model is shown in figure 4.3, this model ship is longer and narrower than former two models. All the information of model ships are shown in table 4.1.
Figure 4.2 workboat ship model
Figure 4.3 cargo boat ship model Table 4.1 information of tugboat ship model
Type Scale Length Beam Height
Tugboat 1:75 770 240 450
Workboat 1:75 770 215 350
Cargo boat 1:100 1000 175 400
For research the impact of altitude changes on stability, a experiment jack is used. From figure 4.4, the wide and length can be known, both are 100mm, and the original height is 45mm. The height range of the jack is from 45mm to 160mm.The weight of the jack is 479g. And 1 kg weight is used in this experiment. For simulating real water condition in a enclosed water tank, a air pump is also prepared, it can provide small waves through four bubbling stones, it is shown in figure 4.6. And a
wireless sensor is used to get more accurate data., the symbol of up means the direction of sensor. This sensor was put into a waterproof bag to prevent damage. And because the cargo boat model ship are too light to lord the 1kg weight, some ballast put into the model ship.
Figure 4.4 Jack Figure 4.5 experiment weight
Figure 4.6 air pump Figure 4.7 wireless sensor
4.1.2. Experiment on a tugboat model ship
For doing this experiment, first of all, accelerate sensor should put into the tugboat model ship, and for get a good result, the position of the sensor, should as close as to the center of the tugboat model ship. For last section, in order to lord experiment material, superstructure is replaced by a plastic plate. After open wireless sensor, jack and weight will put on the tugboat ship model
Bluetooth connection with sensor. So after preparing every things, software in the laptop for collecting data will be opened. Because of the limitation of jack’s height, a 1.5cm board was used. This experiment started from 6cm height. Sampling frequency of the sensor is 200hz, and every experiment period is close to 60s, so that there are enough data to calculate the result. After one time experiment finishing, change height of the jack, every time lift up 2cm, repeat the process until the tugboat model ship going to capsize.
Figure 4.8 experiment process on tugboat ship model
During sensor collecting data, software on the laptop always kept opening, so all the data was collected by a file. In figure 4.10, the total experiment time is 484.01, the number of data is 96803, but not all the data is useful, because during experiment, height change 7 times, the operating process also recorded by sensor, compared to small waves, some big amplitude appeared. The first floating experiment started 0s, after 477.765s, ship model going to capsize, the final height is 18cm. All the amplitude appeared large and abnormal main cause by external force, just like getting and putting jack and weight. After operating process, there was a gradual stabilization process.
(a) Heaving motion
(b) Rolling motion
Figure 4.9 Time domain curve of rolling and heaving on the tugboat ship model For calculating the frequency domain results, data collected by sensor needed to do Fast Fourier Transformation, all these processes were done by software called Labview. The amount of data must be multiplier of 2 so that can fulfil requirements of FFT. For this experiment, 2048 data (10.24s) is selected for one time FFT, because it’s enough long period for detecting model ship’s center of gravity. And every floating experiment time is close to 60s(12000data), the FFT
repeat times was chosen. Finally combined 5000 FFT results into one graph.
6cm high heaving frequency 6cm high rolling frequency
8cm high heaving frequency 8cm high rolling frequency
10cm high heaving frequency 10cm high rolling frequency
14cm high heaving frequency 14cm high rolling frequency
16cm high heaving frequency 16cm high rolling frequency Figure 4.10 rolling and heaving FFT result of tugboat ship model
As the time data transfer to the frequency data, the frequency with largest amplitude is easier to find. Total frequency range is from 0 to 200, but the largest amplitude is main concentrate on 0 to 5 period. So only 0 to 5 frequencies are shown in figure 4.10. But not all the largest amplitude represent the real frequency, sometimes could be wrong. Because when put sensor into the tugboat model ship, the position can not perfectly at the center of the model, rolling and heaving data were affected by other freedom motion data. For make sure the real peak, each graph should compare with other graphs, and the calculating result of D3DCG concept also should be as a guideline. For 6cm height, data from 0 second was selected to start transformation, 8cm height was from 70 second,10cm height was from 135 second, 12cm height was from 205 second, 14cm height was from 295 second , 16cm was from 390 second. Table 4.2 is the summary of the heaving and rolling frequencies which were selected.
6 1.2695 1.5625 8 1.2695 0.9765 10 1.2695 0.9765 12 1.2695 0.7812 14 1.2695 0.5859 16 1.2695 0.4882
4.1.3. Experiment on a workboat model ship
Experiment process on the workboat model ship is almost same as the tugboat ship model, due to the work boat ship model already had space to lard experiment material, no modification needed to be done. Because of the structure of the workboat model ship, finally capsizing height also changed, compare to tugboat ship model, it only arrived 14cm before capsizing. This experiment started from 4.5cm, the lowest height of the jack.
Figure 4.11 experiment process on tugboat ship model
As show in figure 4.12, the floating experiment also started from 0s, about 490s workboat model ship going to capsizing. every floating period is close to 60s, about 12000data., the large amplitude appeared because of the operating process(contains put and get jack and weight). The experiment height range of the workboat ship model is from 4.5cm to 14cm, divide into
4.5cm(from 0s);6cm(from 80s);8cm(from 170s);10cm(from 280s);12cm(from 380s);14cm, altitude of 14cm is the capsizing height.
(a) Heaving motion
(b) Rolling motion
4cm high heaving frequency 4cm high rolling frequency
6cm high heaving frequency 6cm high rolling frequency
8cm high heaving frequency 8cm high rolling frequency
10cm high heaving frequency 10cm high rolling frequency
12cm high heaving frequency 12cm high rolling frequency Figure 4.13 rolling and heaving FFT result of workboat ship model
figure 4.13, five different height rolling and frequency were shown, most of the rolling frequencies are the highest amplitude, but the heaving frequencies should think much more to make sure the real value.
Table 4.3 Summary of FFT result on workboat ship model with steel weight Height(cm) Heaving frequency(Hz) Rolling frequency(Hz)
4 1.5625 0.9765
6 1.5625 0.9765
8 1.3671 07812
10 1.3671 0.4882
12 1.3671 0.3906
4.1.4. Experiment on a cargo boat model ship
Experiment on a cargo boat ship model also didn’t have to remove the superstructure, only two plastic plates were used to cover two holes of the model ship to prevent water. Same as other experiments, wireless sensor was put into the model ship, put the jack and weight on the model ship and then opened the software to collect data. The difference is data record started from 10s not 0s.
Figure 4.14 experiment process on tugboat ship model
In figure 4.15, the experiment started from 0 s and finally capsized at 363.745 s. As the jack lifted up to 10cm, the cargo boat model ship went to capsizing. All the experiment process could be divided into 4 parts, contained 4.5cm(from 10s);6cm(from 120s);8cm(from 235s) and
(a) Heaving motion
(b) Rolling motion
Figure 4.15 Time domain curve of rolling and heaving on the cargo boat ship model Because when jack lifted up to 10cm, the cargo boat model ship went to capsize quickly, so the data of 10cm height could not use for analysis, previous two experiments are the same. So three height of heaving and rolling frequency graphs were selected, shown in figure 4.16. From all these graphs, the heaving and rolling frequency of every stage could be defined. The frequency
4cm high heaving frequency 4cm high rolling frequency
6cm high heaving frequency 6cm high rolling frequency
8cm high heaving frequency 8cm high rolling frequency Figure 4.16 rolling and heaving FFT result of cargo boat ship model Table 4.4 Summary of FFT result on workboat ship model with steel weight Height(cm) Heaving frequency(Hz) Rolling frequency(Hz)
4 1.2695 0.7812
6 1.2695 0.6835
8 1.0742 0.4882
4.1.5. Comparison among three steel experiments on FFT results
same value. For rolling frequency, it’s related to height of longitudinal stability of ship, so as height of jack changed, rolling frequency changed.
Tugboat model ship’s heaving frequency is 1.2695, close to cargo boat model ship’s frequency, one of the reason is the shape below the boat draught is more similar, and due to the ballast for cargo boat model ship, also make heaving frequency lower than normal situation. Compare to workboat model ship, it lighter than tugboat model ship, and the bottom of workboat is flat, so Aw would be
larger than other model ships, as a result, heaving frequency of workboat model ship could be higher than tugboat and cargo boat model ship.
Table 4.5 Comparison of heaving frequency among three model ships Height(cm) Heaving frequency(hz)
Tugboat Workboat Cargo boat
4 / 1.5625 1.2695 6 1.2695 1.5625 1.2695 8 1.2695 1.5625 1.0742 10 1.2695 1.3671 / 12 1.2695 1.3671 / 14 1.2695 / / 16 1.2695 / /
From the information of model ship could know that cargo boat model ship’s beam is lowest, so rolling frequency of cargo boat is lower too. Even though ballast is put inside of cargo boat model ship, jack only could lift up to 12cm. Compare tugboat model ship with workboat model ship, ship type of these two models is close, but tugboat model ship is more stable, so rolling frequency of tugboat model ship is also higher.
Table 4.6 Comparison of rolling frequency among three model ships Height(cm) Rolling frequency(hz)
Tugboat Workboat Cargo boat
4 / 0.9765 0.7812 6 1.5625 0.9765 0.6835 8 0.9765 07812 0.4882 10 0.9765 0.4882 / 12 0.7812 0.3906 / 14 0.5859 / / 16 0.4882 / /
4.2. Experiment with ice weight
Figure 4.17 Experiment material of ice experiment
In order to prepare the open water experiment and protect the environment, ice weight was used to instead of steel weight. Due to the different types of the model ships, three different weights ice were used, three ice were made by three different volume iron boxes, exact weight was shown in figure 4.17. Biggest ice is 1170g, second is 910g, lightest is 420g. And for the jack could lord ice, a black non-slip mat was provided.
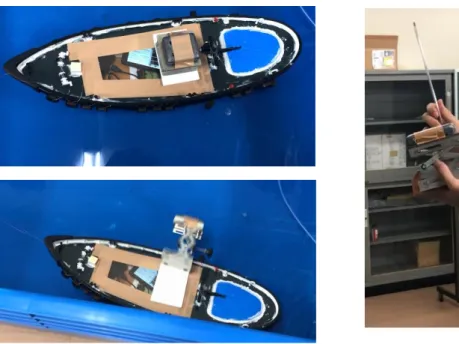
4.2.2. Experiment on a tugboat ship model
Compare to the experiment with steel weight, due to the limitation of ice, the jack was fixed on the tugboat model ship, only ice could be moved. This change had the advantage of ensuring that the position of the jack is not changed. When the height needed to change, the whole model ship had to pick up and then adjusted the jack, at the meanwhile, ice should be saved in ice box when didn’t use it to prevent melting. This operation would cause much bigger motion than previous experiment, so in order to ensure the result were not influenced, every height experiment was recorded by a individual file, operation period was not recorded. For the tugboat model ship, the biggest ice was used.
Figure 4.18 experiment process of tugboat model ship with ice
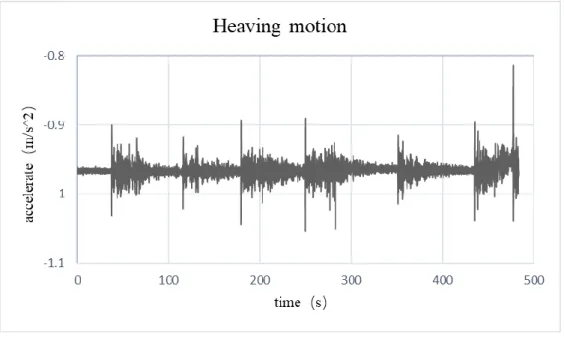
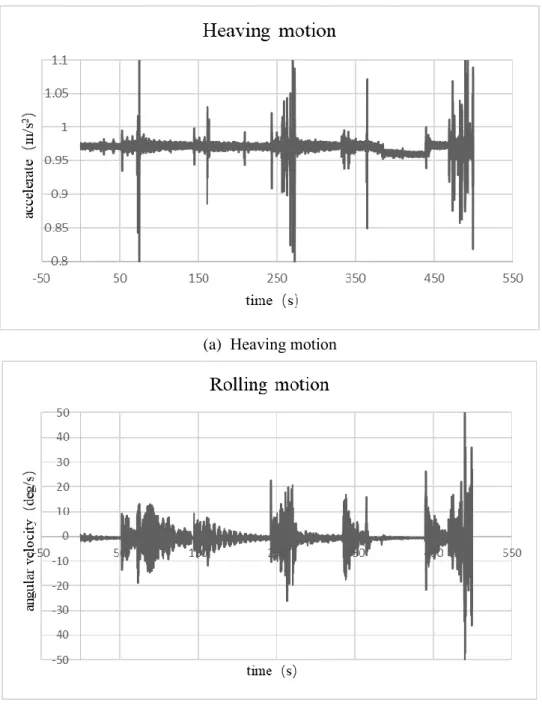
These heaving and rolling motion curves were different from experiment with steel weight, less large amplitude appeared, only capsizing moment showed large amplitude. It caused by the different operating process, data of every height period were recorded individually, and combine together finally. The first height experiment started from 0s and capsizing at 488.075s, from 4.5cm to 18cm, contains seven height series shown in figure 4.20.
(b) Rolling motion
Figure 4.19 Time domain curve of rolling and heaving on the cargo boat ship model
The data used for calculating was same as last experiment, still 2048 data, and repeated 5000 times. But this time, every height analysis process was done by individual file. Rolling frequency were much easier to recognize, but heaving frequency needed to compare each graph and selected the right frequency. The result of heaving and rolling frequency were shown in table 4.1.
4cm high heaving frequency 4cm high rolling frequency
6cm high heaving frequency 6cm high rolling frequency
8cm high heaving frequency 8cm high rolling frequency
14cm high heaving frequency 14cm high rolling frequency
16cm high heaving frequency 16cm high rolling frequency Figure 4.20 rolling and heaving FFT result of tugboat model ship Table 4.7 Summary of FFT result on tugboat ship model with steel weight Height(cm) Heaving frequency(Hz) Rolling frequency(Hz)
4 1.2695 0.9765 6 1.2695 0.9765 8 1.2695 0.8789 10 1.2695 0.6835 12 1.2695 0.4882 14 1.2695 0.4882 16 1.2695 0.1953
4.2.3. Experiment on a workboat ship model
The structure of the workboat model ship is lighter than tugboat model ship, so the lighter ice was use for the workboat model ship, the weight of ice is 910g. And jack also fixed on the model ship, before opened software, wireless sensor had already put inside.
Figure 4.21 experiment process of tugboat model ship with ice
The total experiment time of the workboat model ship is 385.275s, same as the tugboat model ship ice experiment, new data collecting method was used, every height data collected by a individual file so there was no large amplitude until model ship capsized. In figure 4.22, about 210s, in the heaving motion graph, a huge amplitude appeared, but in the rolling motion graph, this amplitude didn’t exist, this phenomenon may cause by the combination of all the data files.
(b) Rolling motion
Figure 4.21 Time domain curve of rolling and heaving on the cargo boat ship model The height range of this experiment is from 4.5cm to 12cm, and 12cm is the capsizing height, so for heaving and rolling frequency, 8 graphs could be drawn. All these graphs were superimposed by 5000 FFT results. The frequency selected was shown in table 4.6.
4cm high heaving frequency 4cm high rolling frequency
8cm high heaving frequency 8cm high rolling frequency
10cm high heaving frequency 10cm high rolling frequency Figure 4.23 rolling and heaving FFT result of workboat model ship Table 4.8 Summary of FFT result on tugboat ship model with steel weight Height(cm) Heaving frequency(Hz) Rolling frequency(Hz)
4 1.5625 0.8789
6 1.5625 0.7812
8 1.5625 0.6835
10 1.5625 0.5859
4.2.4. Experiment on a cargo boat ship model
The stability of the cargo boat model ship is worst, so the lightest ice was used. The weight of ice is 420g, as the sensor put into the model ship and ice lorded on the jack, opened the software to collect data.
Figure 4.24 experiment process of tugboat model ship with ice
The total experiment time is 266.105s, contains 53284 data. Heaving and rolling motion in figure 4.25 were combined by 4 data files included four different heights. Large amplitude appeared may cause by the unstable of the cargo boat model ship and the combination of data files.
(b) Rolling motion
Figure 4.25 Time domain curve of rolling and heaving on the cargo boat ship model
The height range of the experiment is from 4.5cm to 10cm, 10cm is the capsizing height, so 6 graphs were drawn by the FFT results. Heaving and rolling frequency selected is shown in table 4.7.
4cm high heaving frequency 4cm high rolling frequency
8cm high heaving frequency 8cm high rolling frequency Figure 4.26 rolling and heaving FFT result of cargo boat model ship Table 4.9 Summary of FFT result on tugboat ship model with steel weight Height(cm) Heaving frequency(Hz) Rolling frequency(Hz)
4 1.3671 0.5859
6 1.3671 0.4882
8 1.3671 0.2929
4.2.5. Comparison among three steel experiments on FFT results
FFT results of ice experiments are different from steel experiment, this time cargo boat model didn’t have ballast inside, but decreased weight of experiment material, so heaving frequency also changed. For tugboat model ship, ice weight is close to steel weight, so heaving frequency also very close. Same as workboat, although ice weight decreased, still close to steel weight, so heaving frequency also almost not change.
4.10 Comparison of heaving frequency among three model ships Height(cm) Heaving frequency(hz)
Tugboat Workboat Cargo boat
4 1.2695 1.5625 1.3671 6 1.2695 1.5625 1.3671 8 1.2695 1.5625 1.3671 10 1.2695 1.5625 / 12 1.2695 / / 14 1.2695 / /
16 1.2695 / /
For rolling frequency, due to the type of ice is larger than steel, so height of longitudinal stability changed, even though ice weight is close to steel weight. Selected tugboat model ship as sample, the same height compare to steel weight, rolling frequency is lower when loading ice weight. And except workboat model ship, other two model ships capsizing height didn’t change.
4.11 Comparison of rolling frequency among three model ships Height(cm) Rolling frequency(hz)
Tugboat Workboat Cargo boat
4 0.9765 0.8789 0.5859 6 0.9765 0.7812 0.4882 8 0.8789 0.6835 0.2929 10 0.6835 0.5859 / 12 0.4882 / / 14 0.4882 / / 16 0.1953 / /
4.3. Conclusion of the experiments by D3DCG
4.3.1. Result of experiment with steel weight by D3DCG
From the third chapter, the formulation of D3DCG were obtained, and all the frequency had been known in last section, so the value l, lmax, b could be calculated. The calculating process was
done by Labview software. Value l, lmax, b increased as the height elevated,except some abnormal
values.
Figure 4.27 D3DCG result of tugboat ship model with steel weight
Figure 4.28 D3DCG result of workboat ship model with steel weight
4.3.2. result of experiment with ice weight by D3DCG
When loading ice weight, almost calculating results by D3DCG were close to the steel weight, but as shown in figure 4.30, when altitude arrived 16cm , the value of l, lmax, b were much higher
than loading steel weight, from the of (lmax-l)/lmax could see that this floating condition was much
more close to capsize than before. And all the value of workboat model ship was lower than loading steel.on the other hand, all the value of cargo boat model ship was higher.
Figure 4.30 D3DCG result of tugboat ship model with ice weight
Figure 4.32 D3DCG result of cargo boat ship model with ice weight
4.3.3. Comparison between D3DCG results of steel and ice experiment
Compared steel and ice experiments on tugboat model ship, the final results of l, lmax were different,
when tugboat model ship lording ice weight, l, lmax were higher than loading steel at the same height,
empirically provable, (lmax-l)/lmax was lower. This phenomena mainly caused by the structure of ice, ice is
larger than steel, it will change the center of gravity to higher position. Same as work boat model ship, when height was same, loading ice was more unstable than loading steel. For the cargo boat model ship, it is different from other two model ships, when cargo boat ship model loading steel weight, there are 2kg ballast inside, but no ballast inside when loading ice, and weight of ice decreased.
5. Capsizing experiment in open water
Due to the limitation of indoor experiments, open water experiment is necessary. Although the air pump can create small wave, it is totally different from natural wave, and indoor experiment can’t provide wind influence.
Experiment was done in the pond of Tokyo University of Marine science and Technology, weather is cloudy. This experiment use wireless sensor and all the operations were done by laptop. Same as indoor experiments, every height data was collected by a individual file. After measuring a period floating experiment, got the model ship from the pond and changed height of the jack then put it back to the pond, at the meanwhile, put ice on the jack and started another measurement. Repeated this operation until the model ship went to capsize.
Figure 5.1 Experiment process in open water
5.1.1. Experiment on a tugboat ship model
Due to the operating process didn’t record by the wireless sensor, the amplitude of heaving motion showed very stable tendency. But some strange amplitude appeared, sensor connected
related to ocean waves.
(a) Heaving motion
(b) Rolling motion
Figure 5.2 Time domain curve of rolling and heaving on the tugboat model ship
Total experiment time was about 536 seconds, heaving and rolling motion in figure 5.2 were consist of seven files. When jack lifted up to 16cm, the tugboat model ship going to capsize. So six series height were chosen to analyze, from 4.5cm to 14cm. As shown in the figure 5.3, rolling frequency of each height is easy to figure out, but some graphs of rolling frequency needed to calculate and then decided the real amplitude. Final decided frequency was shown in table 5.1.
4cm high heaving frequency 4cm high rolling frequency
6cm high heaving frequency 6cm high rolling frequency
8cm high heaving frequency 8cm high rolling frequency
12cm high heaving frequency 12cm high rolling frequency
14cm high heaving frequency 14cm high rolling frequency Figure 5.3 rolling and heaving FFT result of tugboat model ship
Table 5.1 Summary of FFT result on tugboat ship model
Height(cm) Heaving frequency(Hz) Rolling frequency(Hz)
4 1.5625 0.8789 6 1.5625 0.7812 8 1.4648 0.6835 10 1.4648 0.4882 12 1.4648 0.2929 14 1.5625 0.1953
5.1.2. Experiment on a workboat ship model
The rolling and heaving motion of workboat model ship replied to the sensor is more stable, there is no large amplitude appeared in first 250s. After 250s, the amplitude of heaving motion was getting larger, because when jack lifted up, the tugboat model ship floating condition changed, in chapter 3, could be known that the model ship arrived the neutral equilibrium.
(a) Heaving motion
(b) Rolling motion
Figure 5.4 Time domain curve of rolling and heaving on the workboat model ship The total experiment time is about 350s(70000data), rolling and heaving motion in figure 5.4 was consist of 6 files. When jack lift up to 14cm, the workboat model ship went to capsize. So five series height data were transferred to frequency data. In normal situation, the highest amplitude corresponding to x axis is the real frequency, but in figure 5.5, almost highest amplitude is wrong. And final decided result could be shown in table 5.2.
4cm high heaving frequency 4cm high rolling frequency
6cm high heaving frequency 6cm high rolling frequency
8cm high heaving frequency 8cm high rolling frequency
10cm high heaving frequency 10cm high rolling frequency
Figure 5.5 rolling and heaving FFT result of workboat model ship Table 5.2 Summary of FFT result on workboat ship model
Height(cm) Heaving frequency(Hz) Rolling frequency(Hz)
4 1.4648 1.0742
6 1.5625 0.9765
8 1.4648 0.6835
10 1.5625 0.5859
5.1.3. Experiment on a cargo boat ship model
Compare both heaving and rolling motion, for the cargo boat model ship, due to ship type of the model ship, it is easier influence by waves, the rolling motion showed higher amplitude, and as ice weight decreased, heaving motion become more stable in figure 5.6.
(b) Rolling motion
Figure 5.6 Time domain curve of rolling and heaving on the cargo boat model ship All the data were recorded in 270s, and divide into four series height data, same as other results got before, rolling frequency is easier to recognize, but heaving frequency needed calculation and comparisons to decide. In table 5.3, the rolling and heaving frequency were obtained.
4cm high heaving frequency 4cm high rolling frequency
8cm high heaving frequency 8cm high rolling frequency Figure 5.7 rolling and heaving FFT result of cargo boat model ship
Table 5.3 Summary of FFT result on cargo boat ship model
Height(cm) Heaving frequency(Hz) Rolling frequency(Hz)
4 1.3671 0.4882
6 1.1718 0.2929
8 1.3671 0.0976
5.2. Analyses of capsizing risk on experiment data by D3DCG
5.2.1. Conclusion of FFT result
In real sea water condition, heaving frequency was not always keeping the same value, some small fluctuation appeared during every experiment. And due to the density of water became larger, so value V and Aw became lower, as a result , heaving frequency became higher. But heaving
frequency of workboat model ship didn’t change, this situation caused by little changed of V and Aw.
Table 5.4 Conclusion of heaving frequency Height(cm) Heaving frequency(hz)
Tugboat Workboat Cargo boat
4 1.5625 1.4648 1.3671
6 1.5625 1.5625 1.1718
12 1.4648 / /
14 1.5625 / /
Influenced by ocean waves and natural wind these kinds of external force, rolling frequency also changed. Rolling frequency was lower than indoor experiment and decreased quicker than before. Compare workboat model ship to other model ships could see that, rolling frequency was higher than other model ships, it ought to be the type of workboat was less influenced by natural external force.
Table 5.5 Conclusion of rolling frequency Height(cm) Rolling frequency(hz)
Tugboat Workboat Cargo boat
4 0.8789 1.0742 0.4882 6 0.7812 0.9765 0.2929 8 0.6835 0.6835 0.0976 10 0.4882 0.5859 / 12 0.2929 / / 14 0.1953 / / 5.2.2. Result by D3DCG concept
As getting the results of rolling and heaving frequency on each model ship, l,lmax,b could be
calculated based on the D3DCG concept. And all the results also divide by every individual height series. Value l,lmax,b showed the increasing tendency, (lmax-l)/lmax showed the decreasing tendency.
This result was close to the indoor experiment, that means D3DCG theory on the model ship in the real sea condition can be worked.
Compare to the indoor experiment, capsizing height decreased, because influenced by external force in real sea, model ships were easier to unstable condition. Value l,lmax were higher than before
on the same height. Before going to capsize, value (lmax-l)/lmax was much lower than indoor
influenced by natural element, it caused by the type of model ship. In all the experiments, Value l,lmax,b are always the lowest, but due to the draft of workboat model ship is small, it was still more
unstable than tugboat model ship.
Figure 5.8 D3DCG result of tugboat ship model
Figure 5.10 D3DCG result of cargo boat model ship
6. Conclusion
With the development of technology, water transportation is getting better day by day, but at the same time, it will also be accompanied by frequent water transportation accidents, despite the concern of ship safety around the world. The capsizing accidents do not account for a large
proportion of the total number of marine accidents, but when capsizing accidents happened, there is a huge loss of human life and property. In order to prevent accidents happening, D3DCG theory is put forward in this paper. For detecting center of gravity of ships, D3DCG concept only needs rolling and heaving frequency, so it does not require very sophisticated instruments, as a result, it can be equipped without much money. That means many small ships also can equip such kind of security alarm system. To discover influence of height and ship type on D3DCG theory, two experiments were done in this paper. The first experiment was divided into two parts, the first part is experiment with 1 kg steel weight, second part is experiment with three different weight ice cubes. All the experiment process was done in water tank with some air bubbling devices. Second experiment was done in the real sea condition, ice cubes continue to be used. Based on these two experiments, rolling and rolling were analysis by real time data, and l,lmax and b were calculated by
two frequencies. Compared each model ship result, could find the relationship between ship types and D3DCG theory, and compared each height of one model ship experiment, could figure out the relationship between altitude and D3DCG theory. Concluded all the experiment results could find
that value (lmax-l)/lmax could as a judgment index of ship condition, the lower this value, the closer
ship is capsized. And open water experiment is much closer to the real situation then indoor
experiment, influenced by external force, model ships were easier to capsize. But these experiments are not completed, much space left can be researched. It still has many limitations during
experiment, like complex experiment process, height change range is a little big, model ship’s ballast status is not same and so on. To get much more precise results, further experiments should be done. D3DCG research can help develop marine security by more economics way, hope this paper’s research can help D3DCG theory go a further stage so that human property and life safety can be better protected.
Reference
[1]Li Min. Research on the Evaluation Index System of Zhejiang “Safety Sea Area” Construction. Zhejiang University. 2018.
[2] Xiao Longfei, Yang Jianmin,Wang Minsheng,Yao Meiwang. The Natural Period of Motion of FPSO in Shallow Water[J]. Journal of Shanghai JiaoTong University.2005.39(5):686-690
[3]Ko Wansik(2019), Alarm Indexes of capsizing based on The Detection of Three Dimensional Center of Gravity, Tokyo University of Marine Science and Technology, Tokyo, Japan.
[4] Phoo Pyae Thu(2018), Innovative Warning System for Capsizing Prevention(Master thesis), Tokyo University of Marine Science and Technology, Tokyo, Japan.
[5] China group to salvage South Korea's sunken ferry,2015.8.5
http://www.chinadaily.com.cn/world/2015-08/05/content_21504785.htm [6] More countries send condolences over China's cruise ship accident,2015.6.5.

![Figure 2.2 Eastern Star Salvage Source from China Daily [6]](https://thumb-ap.123doks.com/thumbv2/123deta/6959053.1191522/13.892.130.753.115.585/figure-eastern-star-salvage-source-from-china-daily.webp)
![Figure 2.3 Sewol Ferry Savage Source from China Daily [5]](https://thumb-ap.123doks.com/thumbv2/123deta/6959053.1191522/14.892.129.752.140.515/figure-sewol-ferry-savage-source-china-daily.webp)