Annual Review (Inst. Nat. Sci., Nagoya City Univ.), Vol. 1, 55-58 (1996)
Application
of High-Performance
Capillary
Electrophoresis
to Quantification
of Products
of the Reverse
Transcriptase-Polymerase
Chain Reaction
Akihiko Moriyama 1, Kohei Matsukawa 2, Minako Matsubara l and Taiji Kato '
1 Institute of Natural Sciences, Nagoya City University, Mizuho-ku, Nagoya 467. Japan 2 Department of Bioregulation, Biomedical Institute, Nagoya City University, Medical
School, Mizuho-cho, Mizuho-ku , Nagoya 467, Japan
Abstract
To apply the high-performance capillary electrophoresis (HPCE) to the quantification of RT-PCR products, the conditions for the routine measurement were established as follows: the reaction mixture after RT-PCR (1 1) was diluted 20-fold with deionized water and introduced into the capillary tube by electrokinetic injection at -10 kV for 40 sec. Electrophoresis was performed at -13 kV for 21 min. DNA was quantified spectrophotometrically at 260 nm during electrophoresis. This method was applied to the quantification of gliostatin mRNA in A 431 cells and compared to the amount of corresponding protein. The amount of gliostatin mRNA was well correlated with that of the protein (r = 0.733), when RT-PCR products derived from $ -actin were used as internal standards. The data indicate that HPCE is useful to quantitate mRNA levels in cells.
Key words: PCR, capillary electrophoresis, gliostatin
[ I ] Introduction
Quantification of specific cellular mRNAs, as well as their protein products, is of great importance in if we are to understand the intracellular responses to the stimuli that induce the differentiation of cells. A combination of reverse transcription with a subsequent polymerase chain reaction (RT-PCR) allows the detection of minute numbers of transcript. For quantitative determinations, cellular mRNAs have been visualized after RT-PCR with radiolabeled or fluorescence-labeled nucleotide primers and agarose or polyacrylamide gel electrophoresis" These methods, while sufficiantly sensitive for the semiquantification of products of PCR, are frequently troublesome because of harmful radioactivity or fading of fluorescence under UV light. In addition, the radioactivity of 32P-labeled decays with a half life of 14.3 days, and fluorescence intensity can only be measured in arbitrary units and is dependent on the intensity of UV light used for excitation. Thus, it is difficult to compare the results from experiments performed at different times.
Compared with the conventional gel
electrophoresis, high-performance capillary electrophoresis (HPCE) allows better quantification of nucleotides by the direct and spectrophotometric quantification of DNA at 260 nm during electrophoresis. HPCE also allows the separation of DNA fragments of very similar molecular size.
In this note, we describe an application of HPCE to the quantification of PCR products. The method provides high resolution and a high degree of
sensitivity.
[11] Materials and Methods
Materials. The A431 cell line, derived from epidermoid carcinoma, was obtained from the Japanese Cancer Research Resources Bank (JCRB)
and cells were cultured in Dulbecco's modified medium (DMEM; GibcoBRL) that contained 10 % fetal calf serum. Gliostatin in the cell lysates was quantified by the enzyme-immunoassay (EIA) as described previously'.
Primers. Sequences of genes for /3 -actin and gliostatin (platelet-derived endothelial cell growth factor) were obtained from GenBank and used to
design the primer pairs. Specific primer pairs used to amplify the $ -actin mRNA were
5'-TACATGGCTGGGGTGGGTTGAA-3' and
5'-AAGAGAGGCATCCTCACCCT-3', and those used to amplify the gliostatin mRNA were
5'-GTGGAGGGGCTGTCCGCTCTGGTGGTGGAC-3' and
5'-CAGCATCCGCTCGAAGCGGCCAAGGGCCGA-3'. Preparation of RNA. Total cellular RNA was obtained as described by Chomczynski and Sacchi4). The amount of RNA recovered was quantified spectrophotometrically at 260 nm.
Reverse transcription reaction. First-strand cDNAs were synthesized from total RNA by MMLV reverse transcriptase with oligo d(T)16 priming. Each 20 ,u1 of reaction mixture for synthesis of cDNA synthesis reaction mixture contained 1 ft g of total RNA, lx PCR buffer (10 mM Tris-HC1, pH 8.0, 50 mM KC1, 1.5 mM MgCl2), 1 mM each deoxynucleotide triphosphate
(dATP, dGTP, dCTP, and dTTP), 20 units of RNAsin, 160 units of MMLV and 100 pmol of oligo d(T)16 primer. Reaction mixtures were preincubated for 10 min at 21 °C prior to synthesis of cDNA . The reverse transcription reactions were carried out for 30 min at 42 °C and reaction mixtures were heated at 95 °C for 5 min to terminate the reverse transcription reaction. PCR The "Primer dropping method" , as described by Wong et al.') was used for quantification of gliostatin mRNA, with /3 -actin mRNA as an internal standard. PCR was carried out in a GeneAmp PCR System 960 (Perkin-Elmer, Applied Biosystems) with 1 ill of each primer for gliostatin, 200 mM each dNTP and 2.5 units of Taq DNA polymerase in 10 mM Tris-HC1 (pH 8.0), 50 mM KC1, 1.5 mM MgC12, 0.1% gelatin, 10% dimethyl sulfoxide in a reaction volume of 100 Samples were overlaid with light mineral oil and heated to 95 °C for 3 min. Subsequent cycles were conducted in three steps: 1 min at 94 °C; 2 min at 50 °C; and 3 min at 72 °C. Primers for /3 -actin cDNA were added at the seventh cycle. After 30 cycles, the samples were incubated at 72 °C for an additional 7 min. The samples could then be stored at 4 °C. High-performance capillary electrophoresis (HPCE) One ,u1 of the reaction mixture after PCR was diluted to 20 #1 with deionized water and applied to the model 270A-HT system (Perkin-Elmer, Applied Biosystems) equipped with an HS cell capillary (60
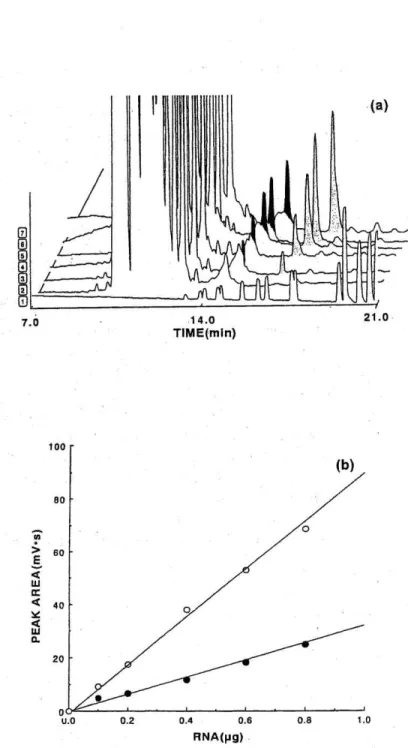
Fig. 1 (a) HPCE of DNA marker DNAs and products of RT-PCR.
RT-PCR was performed with varying amounts of total RNA from A431 cells (0, 0.1, 0.2, 0.4, 0.6, and 0.8 ft g) and 1 #1 of the mixture after RT-PCR was analyzed by HPCE (Electrophoretograms 2-7). Light gray peaks are represent results with primers for of gliostatin, and dark gray peaks those for of )3 -actin. Electrophoretogram 1, 1 kb ladder markers. The first 11 peaks in electrophoretogram 1 correspond to 75 bp, 134 bp, 154 bp, 201 bp, 220 bp, 298 bp, 349 bp, 396 bp, 506 bp, 517 bp, and 1,018 by in the order of migration time. The areas of the peaks are proportional to the sizes of the DNA fragments.
(b) Correlation between the quantity of RNA and the peak area after HPCE.
Peak areas in electrophoretograms 2 through 7 in Fig. 1 (a) are plotted against the quantity of RNA used for RT-PCRs.
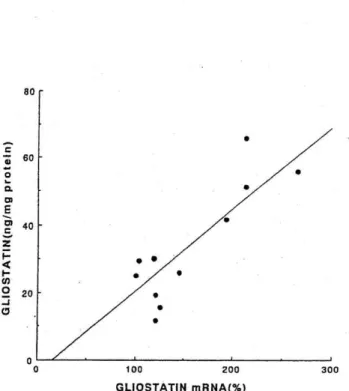
Fig. 2 Correlation between cellular levels of gliostatin mRNA and of gliostatin. Gliostatin mRNA was quantitated by HPCE after RT-PCR, relative to the amount of /3-actin mRNA as an internal standard, and the concentration of gliostatin was determined by an enzyme-linked immunoassay. The amount of mRNA in unstimulated cells was taken as 100%. The correlation coefficient (r) was calculated to be 0.733 (n---11)
cm, 75 ft m in diameter) according to the protocol from the manufacturer with minor modifications. Sample was loaded at -10 kV for 40 sec and electrophoresis was performed at 32 °C for 21 min, otherwise specified. The data were analyzed with 600E 1.02 software (Perkin-Elmer, Applied Biosystems).
[ Ill] Results and Discussion
Several factors affect the quantification of peak areas during electrophoresis with continuous monitoring. It is particularly important that the measured peak area be a function of the mobility of the sample and the quantity of the sample, because the lower mobility yields the broader peaks. In this study by HPCE, therefore, the sample was automatically and electrokinetically introduced into the capillary tube to compensate for the apparent dependence of peak area on mobility. Electrokinetic injection allows more accurate quantification than does hydrodynamic injection.
A preliminary study using various loading voltages ( —10 kV to —30 kV) and times (10 sec to 80 sec), showed that peak areas were proportional to both the loading voltage and the time taken for
injection.
The sensitivity was, however, almost
unaffected by the applied voltage and time taken for
injection since areas of peaks due only to noise were
also proportional to the voltage and the time.
It is
known that if the ionic strength of the sample,
another factor that affects electrophoresis, is lower
than that of the electrophoresis buffer, stacking of the
sample occurs. To get sharp peaks and improve
detectability, the mixture after RT-PCR was diluted
20-fold with deionized water and introduced into the
capillary tube by electrokinetic injection at —
10 kV
for 40 sec. Standard electrophoresis was performed at
-13 kV for 21 min.
When a 1-kb DNA ladder (Gibco BRL) was
injected
electrokinetically
and
subjected
to
electrophoresis, 11 peaks of fragments from 75 by to
1018 by were well separated from each other and the
peak areas were proportional to the sizes of DNA
fragments (Fig. la, electrophoretogram 1). Under
these conditions, DNA fragments of more than about
1 kb were not well separated. Although attempts to
utilize HPLC instead of HPCE have been reported'' ,
HPCE is different from HPLC in that high resolution
strictly depending on molecular sizes of DNA.
RT-PCR products derived from /3 -actin and
gliostatin mRNAs from varying amounts of total
RNA prepared from A 431 cells, were also subjected to
HPCE for quantification under these conditions.
Figure la shows the electrophoretogram
of these
products of RT-PCR . The peak of the cDNA for )3
-actin (218 bp) was well separated from that for
gliostatin (372 bp). Both peak areas corresponded to
the amount of RNA used as template for RT-PCR
(Fig. 1 b).
To validate the precision of this method, we
examined the correlation between the measured
amount of mRNA (arbitrary units) and the amount
of gliostatin protein (ng/mg protein estimated by a
separate EIA ) in A431 cells. The amount of gliostatin
mRNA was well correlated with that
of the
corresponding protein (r =0.733, n=11; Fig. 2).
In summary, HPCE is useful for quantification of
the products of RT-PCR without the use of
radioactive isotopes and fluorescent chemicals. This
method, furthermore, requires only a few microliters
of the reaction mixture after PCR and allows the
economic use of small amounts of sample RNA and
the reagents for. RT-PCR.
REFERENCES
1) J. Chelly and A. Kahn in The Polymerase Chain Reaction (K. B. Mullis, F. Ferre, R. A. Gibbs, eds)
pp. 97-109, Birkhauser, Boston, MA. (1994) 2) F. E. Karet, D. S. Charnock-Jones, Harrison-M. L.
Woolrych, G. O'Reilly, A. P. Davenport, and S. K.
Smith Anal. Biochem. 220, 284-390 (1994) 3) T. Hirano, K. Asai, K. Matsukawa, T. Kato
Biochim. Biophys. Acta 1176, 299-304 (1990) 4) P. Chomczynski and N. Sacchi Anal. Biochem. 162,
156-159 (1987)
5) H. Wong, W. D. Anderson, T. Cheng, and T. Raiabowol Anal. Biochem. 223, 251-258 (1994) 6) E. D. Katz in Methods in Molecular Biology -PCR
Protocols -Current Methods and Applications (B.
A. White ed) pp. 63-74, Humana Press, Totowa,
NJ. (1993)