acting on the mass is measured using an optical interferometer. The electrical response is evaluated by comparing the output signal of the force transducer with the inertial force of the mass as measured using the optical interferometer. Simultaneously, the mechanical response is evaluated by comparing the displacement of the sensing point of the transducer, which is measured using another optical interferometer, with the inertial force of the mass. To demonstrate the efficiency of the proposed method, the impact responses of a force transducer are accurately determined. © 2006 American Institute of Physics. 关DOI:10.1063/1.2239035兴
I. INTRODUCTION
Force is one of the most basic mechanical quantities and is defined as the product of mass and acceleration. Force transducers are widely used in various industrial and research applications. However, force transducers are typically cali-brated by standard static methods using static weights under static conditions. At present, there are no standard methods of evaluating the dynamic characteristics of force transduc-ers. This leads to two major problems in measuring varying force. One is that it is difficult to evaluate the uncertainty of the measured varying force. The other is that it is difficult to evaluate the uncertainty of the moment at which the varying force is measured.
Although methods for dynamic calibration of force transducers are not well established, several attempts have been developed to calibrate transducers against an impact force,1–3a step force,3 and an oscillation force.4–7 However, it is not clear how such calibrations can be applied to the actual wave profile of a varying force. Validation is therefore needed when applying the frequency response of one type of varying force to other types.
Some of the above methods are based on the “levitation mass method” 共LMM兲 proposed by the author.1,3,7 In this method, the inertial force of a mass levitated using a pneu-matic linear bearing8is used as the reference force applied to the object being tested, such as a force transducer1,3,7 or material.9–11Recently, a pendulum mechanism has been de-veloped as a substitute for the aerostatic linear bearing.12The inertial force of the levitated mass is measured using an op-tical interferometer. As for the methods proposed by the au-thor for the dynamic force calibration of force transducers against some typical dynamic forces, such as impact force,1 step force,3 and oscillation force,7 the electric responses of the force transducer against the typical varying forces are
evaluated. However, the mechanical behavior of the trans-ducer at the time when the impact load is applied to it, which would yield valuable information for understanding its elec-trical response, remains unknown.
On the other hand, some methods of analyzing the elec-tric response of force transducers against impact loads have been proposed.13,14In these methods, the inertial mass of the part of the transducer itself is considered to be the cause of the difference between the static response and the dynamic response of the transducer. However, no impact force trace-able to the International System of units共SI units兲 is used as the reference force in these methods. Therefore these meth-ods cannot be considered to be dynamic calibration methmeth-ods for force transducers.
In this article, a novel method is proposed, in which the electrical and mechanical responses of a force transducer against an impact load are simultaneously evaluated. The method is based on the levitation mass method, and the present analysis shows its efficiency.
II. EXPERIMENTAL SETUP
Figure1shows a schematic diagram of the experimental setup for measuring the electrical and mechanical responses of the force transducer against the impact load. A conven-tional S-shaped strain-gauge-type force transducer, whose nominal force is 200 N and which is statically calibrated with the standard uncertainty of approximately 0.4 N共0.2% to full scale兲, is attached to the base. An aerostatic linear bearing is used to obtain horizontal linear motion with neg-ligible friction acting on a mass共i.e., the moving part of the bearing兲.
Two optical interferometers, interferometer 1 and inter-ferometer 2, are built to measure the velocity of the mass and the sensing point of the force transducer, respectively. The
mass of the moving part, including a cube corner prism, M1, is approximately 2.6526 kg. The mass of the metal plate at-tached to the force transducer including the cube corner prism, M2, is approximately 0.0816 kg.
A Zeeman-type two-frequency He–Ne laser is used as the light source of the optical interferometers. The interfer-ometers have three photodetectors: PD0, PD1, and PD2. The frequency difference between the two orthogonal polariza-tion states emitted from the laser, frest, is monitored using a
Glan-Thompson prism 共GTP兲 and the first photodetector, PD0.
The total force acting on the moving part of the aero-static linear bearing, Fmass, is calculated as the product of its
mass M1and its acceleration a as follows:
Fmass= M1a.
In the measurement, the total force acting on the mass, Fmass, is considered to be the same as the force acting on the
mass from the force transducer being tested, since the fric-tional force acting on the mass is negligible.8The accelera-tion is calculated from the velocity of the levitated mass. The velocity of the mass共i.e., of the moving part of the aerostatic linear bearing兲, v1, is measured as the frequency Doppler
shift, fDoppler,1, which can be expressed as follows:
v1=air共fDoppler,1兲/2,
fDoppler,1= −共fbeat,1− frest兲,
whereair is the wavelength of the signal beam under the experimental conditions and fbeat,1, is the beat frequency, which is the frequency difference between the signal beam
and the reference beam and appears as the beat frequency at PD1. In this case, the linear polarization transmitted through the polarizing beam splitter PBS-1, whose frequency is larger than that of the other linear polarization, is used as the signal beam. The positive direction for the velocity, accelera-tion, and force acting on the moving part is toward the right in Fig.1. The position of the mass, x1, the acceleration of the
mass, a1, and the force acting on the mass, Fmass, are
numeri-cally calculated from the measured velocity.
The velocity of the sensing point of the force transducer, v2, which is attached to the right side of the transducer under
tested, is measured as the Doppler shift frequency fDoppler,2
which can be expressed as follows: v2=air共fDoppler,2兲/2,
fDoppler,2= −共fbeat,2− frest兲.
The beat frequency fbeat,2is measured using PD2. The
posi-tion x2and the acceleration a2of the actuator are numerically
calculated from the velocityv2.
The frequency fbeat,1appearing at PD1 is measured using
an electric frequency counter共model: R5363; manufactured by Advantest Corp., Japan兲. It continuously measures and records the beat frequency fbeat,1 1000 times at a sampling
interval of T = 400/ fbeat,1and stores the values in its memory.
This counter continuously measures the interval time every 400 periods without dead time. The sampling period of the counter is approximately 0.15 ms at a frequency of 2.7 MHz. Two other counters of the same model measure the frequen-cies frest and fbeat,2appearing at PD0 and PD2, respectively. The counters measure the frequencies without dead time and
FIG. 1. Experimental setup. Code: CC= cube corner prism, PBS= polarizing beam splitter, NPBS= nonpolarizing beam splitter, GTP= Glan-Thompson prism, PD= photodiode, LD= laser diode, ADC= analog-to-digital converter, DAC= digital-to-analog converter, and PC= personal computer.
the sampling interval T can be exactly calculated using the measured frequency f and the expression T = 400/ f.
The aerostatic linear bearing, Air-Slide TAAG10A-02 共NTN Co., Ltd., Japan兲, is attached to an adjustable tilting stage. The maximum weight that the moving part can support is approximately 30 kg, the thickness of the air film is ap-proximately 8m, the stiffness of the air film is more than 70 N /m, and the straightness of the guideway is better than 0.3m / 100 mm. The frictional characteristics were deter-mined in detail by means of the developed method.8
The output signal of the force transducer is measured using a digital voltmeter共model: VP5481L; manufactured by Panasonic Corp., Japan兲 at a sampling interval of 0.2 ms.
The measurements using the three electric counters 共R5363兲 and the digital voltmeter 共VP5481L兲 are triggered by means of a sharp trigger signal generated using a digital-to-analog converter共DAC兲. This signal is initiated by means of a light switch, which is a combination of a laser diode and a photodiode. In the experiment, only one collision measument was conducted and the electric and mechanical re-sponses of the transducers were obtained from the result of the measurement.
III. RESULTS
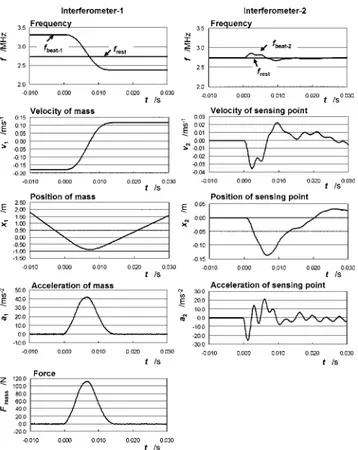
Figure2shows the data processing procedure in the col-lision experiment. During the colcol-lision experiment, the fre-quencies frest, fbeat,1, and fbeat,2 were measured using photo-diodes PD0, PD1, and PD2, respectively. The velocity v1, position x1, acceleration a1, and inertial force −Fmassof the moving part of the bearing were calculated from frest and
fbeat,1, which was measured using interferometer-1. The
ve-locityv2, position x2, and acceleration a2of the sensing point
of the transducer were calculated from frestand fbeat,2, which were measured using interferometer 2.
Figure3shows the force calculated from the output sig-nal of the force transducer and its static calibration results, Ftrans, and the force acting on the mass, Fmass, which is cal-culated as the product of the mass of the moving part, M1, and the acceleration of the mass as measured by the proposed method, a1. The figure shows the electric response of the
force transducer under the impact load. The maximum value and the full width at half maximum of the impact force were approximately 112.1 N and 6.9 ms, respectively. The colli-sion period is approximately 14.4 ms. The difference be-tween Ftrans and Fmass derived mainly from the difference
between the static characteristics and the dynamic character-istics of the transducer. The root mean square value 共rms value兲 of the difference, Ftrans− Fmass, during the collision
period was approximately 3.8 N.
Figure4shows the relationship between the acceleration of the sensing point, a2, and the difference between the
val-ues measured by the transducer and those measured by the proposed method, Fdiff= Ftrans− Fmass. The regression line,
Freg= 0.323a2, is also shown in the figure. Figure4shows the
same result of the single collision experiment as shown in
FIG. 2. Data processing procedure: calculation of the velocity, position, acceleration, and force from the measured frequency.
FIG. 3. Force measured by the force transducer and force measured by the proposed method.
FIG. 4. Relationship between the acceleration of the sensing point and the difference between the values measured by the transducer and those mea-sured by the proposed method.
Figs.2 and3 but in different manner. A strong correlation between Fdiff= Ftrans− Fmass and a2 was observed from the figure. If the transducer is considered as a mechanical struc-ture consisting of an inertial mass and a spring element, and if the output signal can be considered to represent the defor-mation of the spring, the inclination of the line, 0.323, can be considered as the estimated effective inertial mass of the transducer, Mestimated. The value Mestimated− M2 was
calcu-lated to be 0.241 kg, which corresponds to 57% of the total mass of the transducer itself. Since the transducer is S shaped and its deformation is designed to concentrate around the center of the transducer, the result that estimates the effective inertial mass at about half of the mass of the transducer is reasonable.
Figure 5 shows the difference between the values mea-sured by the transducer and those meamea-sured by the proposed method, Ftrans− Fmass, and the estimated inertial force of the
sensor element, Mestimateda2. The two curves coincide well
with each other. This indicates that the difference in the elec-tric response of the transducer between the static and dy-namic conditions can be well explained as the inertial force of the part of the transducer itself. The rms value of the residual, Ftrans− Fmass− Mestimateda2, during the collision
pe-riod was approximated at 0.7 N.
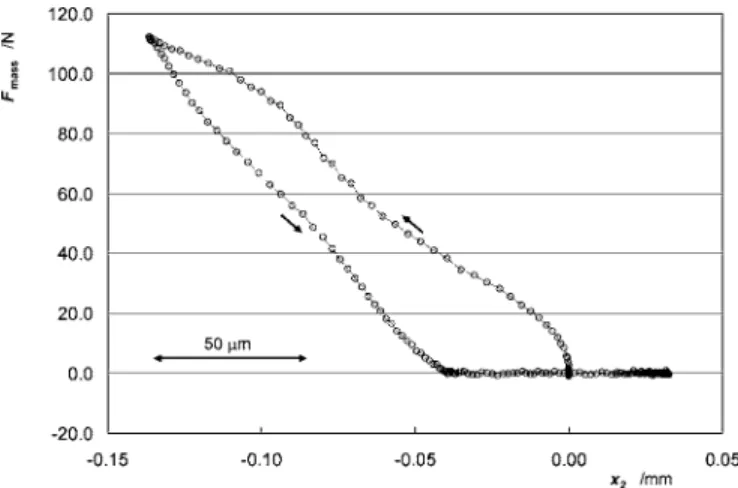
Figure 6 shows the mechanical response of the trans-ducer against the impact force. The viscoelastic hysteresis, which was caused by the viscosity of the mechanical struc-ture of the transducer, is clearly observed.
IV. EVALUATION OF UNCERTAINTY
In this section, the uncertainties both in measured force and the moment at which the dynamic force is measured are evaluated as follows.
A. Uncertainty of the force measured
The uncertainty components for the determination of the instantaneous value of the force acting on the force trans-ducer, −Fmass, are as follows:
共1兲 Electric counter 共R5363兲. The uncertainty originated from the electric counter R5363 with the sampling interval of dt = 400/ f 共s兲 is estimated to be approximately 100 Hz.
These uncertainties in the beat frequency, T = 400/ fbeat,1, and
the rest frequency, T = 400/ frest, correspond to an uncertainty
in the velocity of the moving part of approximately 4.5 ⫻10−5m / s, according to the expression v = −
air 共frest,1
− frest兲/2. This corresponds to an uncertainty in the
accelera-tion and force of approximately 4.3⫻10−1ms−2 and 1.1 N,
respectively.
共2兲 Optical alignment. The major source of uncertainty in the optical alignment is the inclination of the signal beam of 1 mrad, and it results in a relative uncertainty in the ve-locity of approximately 5⫻10−7, which is negligible.
共3兲 Mass. Mass of the moving part is calibrated with a standard uncertainty of approximately 0.01 g, which corre-sponds the relative standard uncertainty in force determina-tion of approximately 4⫻10−6. This is negligible.
共4兲 External force acting on the mass. For the external force acting on the moving part, the friction force acting inside the pneumatic linear bearing is dominant under the condition that the air film of approximately 8m thickness inside the bearing is not broken. The frictional characteristics of the air bearing are determined using the developed method.8The dynamic frictional force acting on the moving part, Fdf, is estimated by
Fdf= Av,
A = 8⫻ 10−2/kg s−1.
This is calculated to be approximately 0.02 N at a velocity of approximately 0.2 m s−1, which is negligible.
共5兲 Combined standard uncertainty. Therefore, the stan-dard uncertainty in the determination of the force acting on the force transducer under test is estimated to be 1.1 N. This corresponds to 1.0⫻10−2 共1.0%兲 of the maximum force
ap-plied to the force transducer under test of approximately 1.1⫻102N.
B. Uncertainty of the moment at which the force is measured
The velocityv1, position x1, acceleration a1, and inertial force −Fmass of the moving part of the bearing were calcu-lated from frestand fbeat,1. Therefore the shift of the moment at which the varying force is measured is estimated to be less than the sampling interval of the frequency counters of
ap-FIG. 6. Mechanical response of the transducer against the impact force. FIG. 5. Difference between the values measured by the transducer and those
measured by the proposed method, and the estimated inertial force of the sensor element.
dynamic characteristics of the elastic body, and 共4兲 signal processor: the difference between the static and dynamic characteristics of the electric signal processing system.
From the experimental result, it can be said that the ef-fect of the inertial mass was dominant for the case of the S-shaped strain-gauge-type force transducer used in the ex-periment. The rms value during the collision period, Ftrans
− Fmass− Mestimateda2, is approximately 0.7 N and it is
compa-rable to the measurement uncertainty of 1.1 N. The simple spring-mass model explains the difference between the static and dynamic characteristics of the output electric signal well. This indicates the possibility of developing a high static and dynamic performance force transducer by combining a strain-gauge-type force transducer with an accelerometer. A strain-gauge-type force transducer can be used to measure static force accurately but its low frequency characteristic is inadequate for dynamic force measurements. The proposed method can be used to evaluate both the electrical and me-chanical responses of a force transducer under varying forces and will be applicable for the development of such force transducer.
As shown in Fig.6, the moving part separated from the transducer at x2= 39m. This residual displacement
ap-proaches zero due to the damped oscillation after the im-pulse. This indicates that the structure is a viscoelastic one and cannot be fully explained as a simple spring-mass model. The mechanical response of a force transducer will be useful for developing an appropriate numerical model of the transducer in its design process.
With the proposed method, the electrical and mechanical responses of force transducers against impact loads can be simultaneously evaluated. This information is necessary for the proper understanding of the electrical response of a trans-ducer to varying load, and it will be useful not only for evaluating the uncertainty of the transducer under dynamic conditions but for developing a method of correcting the output signal of the transducer under varying load.
ACKNOWLEDGMENTS
This work was supported by a research aid fund granted by the Asahi Glass Foundation. The author thanks Professor J. D. R. Valera for the fruitful discussions.
1Y. Fujii, Rev. Sci. Instrum. 72, 3108共2001兲.
2Th. Bruns, R. Kumme, M. Kobusch, and M. Peters, Measurement 32, 85 共2002兲.
3Y. Fujii, Meas. Sci. Technol. 14, 1741共2003兲. 4R. Kumme, Measurement 23, 239共1998兲.
5Y. Park, R. Kumme, and D. Kang, Meas. Sci. Technol. 13, 654共2002兲. 6Y. Park, R. Kumme, and D. Kang, Meas. Sci. Technol. 13, 1311共2002兲. 7Y. Fujii, Meas. Sci. Technol. 14, 1259共2003兲.
8Y. Fujii, Rev. Sci. Instrum. 74, 3137共2003兲.
9Y. Fujii and T. Yamaguchi, Rev. Sci. Instrum. 75, 119共2004兲. 10Y. Fujii and T. Yamaguchi, J. Mater. Sci. 40, 4785共2005兲. 11Y. Fujii, Rev. Sci. Instrum. 76, 065111共2005兲.
12Y. Fujii, Rev. Sci. Instrum. 77, 035111共2006兲.
13Y. F. Li and X. B. Chen, IEEE Trans. Instrum. Meas. 47, 304共1998兲. 14K. J. Xu and L. Jia, Rev. Sci. Instrum. 73, 1949共2002兲.