Kiryu Junior College
NII-Electronic Library Service KiryuJunior College
Neural
Network
Applications
in
Environmental
and
Engineering
Research
-Prediction
of
Power
Output
from
a
Solar
Power
Generating
System-vengr*liffli
e:
ts
Vt6=i-
7V3
v
F
V-
tr
7
7'
]J()itwa)ki{l&tzi
X7AOM"EOi}nv)
fr-
ei
g
)i
Herchel
Thaddeus
C.
*Gunma
University
Ma
¢hacon,
Seiichi
Shiga*
,
Faculty
ofEngineering
Abstract
A
neural network model consisting of aninput
layer,
twohidden
Iayers,
and an outputlayer
wasbuilt
topredictthepoweroutput of a
photovoltaic
power
generation
system,Satisfactory
predictions
of thepower
output were obtained after thenetwerk was trained.
Keywerds:
Neural
network,Photovoltaic
power generationsystem,Neuron,
Network
architecture,Back
propagation
lntroduction
The biologicalnetwork of thehuman
brain
consists ofbillionsof cells called neurons. These neurons carry
information through interconnectionswhich enable us to
learn,
recognize, andpredict.
An
artificialneural networkcan
be
built
fromhundreds
of simulated neurons thatmimic the
human
brain's
abiiity tolearn
from
agiven
input
orinputs.
Unlike
expert systems, neural networks areincapable
offo11owing
rules.However,
theycanbe
trainedby
providing
them withinput
and outputinformation.
Thus,neural networks are capable ofrecognizing patterns.
Neural
network applications rangefrom
pattern andcharacter recognitioni'Z)
forecasting3・`),
anddecision
makingS'.
The
authorshave
publisheda paper on theuse of neural networksfor
diesel
engine combustion andperformance analysisfi).
Although theultimate goalof thisresearch
is
topredictthe
photovoltaicpower outputfrom
a ]OkW solar powergenerating system
given
a certain date and time, theimmediate goalat thisstage of theresearch isto develop
and traina neural network topredictthesystem generated
power output from temperature, humidity,and irradiance
l63
data.
Data
Acquisition
Temperature
(
℃)
andhumidity
(%)
readings wereacquired
from
sensors attached toa wirelessdata
logging
apparatus,Irradiance
(Wlm2)
was measuredby
apyranometer
with a spectral range of300
to2800
nrn anda
directional
response ofless
than +1-25
W
f
m7.The
pyranometer was also connected toawireless
data
logger.
Data
collectedby
the wirelessloggers
were sent to a communication base which was attached to a computer.The electrical power output generated from a 10 kW
photovoltaicpower generationsystem was monitorecl and
recorded through a real-time dataacquisition system. Fig.
1
shows the pyranometerlocated
at thebase
of thesolar module. Specificationsof the solar module are shown inTable
1,
DC power generatedby
the solar moduleis
converted intoAC power which issupplied to the utility
grid.
The
TraininglLearning
Data
Inorder to train
the
neural network,it
has
tobe
fed
with both input and output data. The
inputs
areiNtskmaJS(\SEee.
NII-Electronicng17I;-,
2006
Kiryu Junior College
NII-Electronic Library Service KiryuJumor College
Fig.1Thepyranometer[ocatedatthebaseofthesolar module.
Tabie.1 So[armodulespecification$,
Model
HIP-190B2Sanyo
RatedPowerCPmax) 190W MaximumPowerVoltage(Vpm)54.8VMaximumPowerCurrent(Ipm)3.47A
STC:
Cell
temp. 250C,AM
1.5,1000 Wlm2temperature(℃
),
humidity(%),
andirradiance(Wlm2)
.
The
output isthe
generated
electricalpower
(kW)
,
The
Neural
Network
A
neural netwerk consists ofinput,
output, andhidden
layersof neurons connected to each other. Here,we have 3
input
neurons, and 1output neuron representing ourinput
and output
data.
The
hidden
layer
serves as abridge
connecting
the
flow
ofinformation
from
the
input
layer
tothe
outputlayer.
The
neural network modeldesigned
here
is
theback
propagation
model whichis
a multi-layerfeed
forward
network thatutilizesthegeneralized
delta
rule,
Since
weknow
the
number ofinput
and output neurons,thenext step
is
todetermine
how
manyhidden
neurons arenecessary
for
arobust network.t
/fr
th
w
lhbo1r
Basically,
we started totraintheneural network, whichfrom
now on willbe
referred toasNN,
with only onehidden
layer.
Here,
wehave
3
input
neurons, a singlehidden
layer
with10
neurons, and a single output,The
neural network architecture
is
shownin
Fig.
2.
The
trainingstatus
is
presented
below:
MtstemaJit71Ept,
eg17T-,
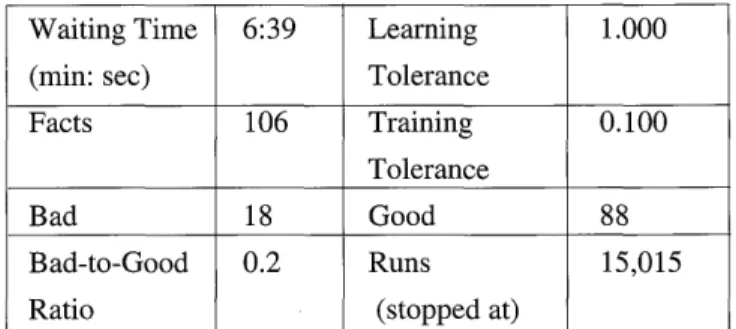
2oo6 164WaitingTime
(min:sec)
6:39Learning
Tolerance1.000
Facts
106
TrainingTolerance
O.100
Bad
18
Good
88
Bad-to-Good
Ratio
O.2 Runs(stoppedat) 15,O15
See
Fig.3.
The
trainingprogress
was monitored throughhistograms
oftheRMS error values as theNN trains.Thetop
graph
is
ahistogram
which showsthe
distribution
oferrorsover theentirerun, while thelower
graph
shows theprogress
of theerrors asthe
networkis
being
trained,Atfirst,
largeerrors can be recognized which istypical of aNN
asits
startsits
learning
process.
Typically,
theNNstops training until the specified acceptable tolerance is
reached.
In
the
first
test,thetrainingcontinuedfOr
quite
some time
but
convergence was not attained.Asa
consequence, theNN
trainingfbr
thisparticular
data
setwas stopped at
15,O15
runs oriterations.
Even
at thisstage,
18
bad
facts
remainfOr
abad-to-good
ratioofO,20.
It
is
obvious thenthat
thenetwork specifications need tobe
modified. neuron --.v-v).F L L・>"
output
hidcteoJa'yer
Fig2 The neuralnetwork architecture
(single
hidden layer),,t2.II@aLag-y!dttil!pmden-tqzeti
7'h
ththddlers
s
Due tothe difficultyof training theprevious network
model, one more hidden layerwas added to the network architecture. The revised NN architecture
is
shownin
Fig.
Kiryu Junior College
NII-Electronic Library Service KiryuJunior College = ek/l.vf[,xS 1.UULiU B.URO ffr"¢IE,SSEOo
'
o.gog o.Ego 1.MUU
ltwts
Rumslas2ztoIEo2asltown
Fig.3Ne±work trainingprogressatover 15,OOOiterations
(sing]e
hiddenlayer}.
Fig,4
4.Thus, there are now two hidden layersof
10
neurons ::'et"""""'{"each. The number of
input
and output neurons remainsthe
same. The training status is
presented
below:WaitingTime
(min:sec)
7:06Learning
Tolerance
1.000
Facts 106 TrainingTolerance
O.100
Bad
5
Good
101
Bad-to-Good
Ratio
O.05Runs(stoppedat)
15,O15
Even
though
the
bad-to-good
ratio exhibited asignificantimprovement,
thetrainingof thisnetwork architecture stillfailed
toattain convergence with thetrainingtolerance ofO,100.
A
toleranceofO.1
means thattheoutput value mustbe within 10% of the output range in order to be
considered correct. Fig. 5 shows thenetwork training
progressat 15,O15iterations.Itisobvious thatthenetwork cannot attain convergence at a training tolerance of
O,1
even
beyond
15,OOOiterations.Thus,thetraining tolerancehasto
be
increased
toahighervalue,3.77Tainin
wr'thtwohicldenlaers
7)Tainin
I.Bmgo O.EOD
--:/
'x
,f'....
output r2The Revisedneura] network architecture
(two
hiddenlayers).Ff,:fi.re#:
foterance
increased
to
O.2
Here, the network architecture remains unchanged, while
the training tolerance was initiallyincreased to O.4.
Although convergence was rapidly attained, analysis of
the histograms of the input-hidden-output connections
showed that the network still
has
the capacity to learn.Thus, the tolerance was decreased to 0.2,The training
sm
a.Qell o.sua 1.gao
klxlesl
Fig.5
Rufisl4S9Hto15M9Bshown
Networktrainingprogressatover 15,QOOiterations
(two
hiddenlayers,toleranceatO,1)./"etveus'ft
30.roDl
u.iOD Stl[t,;'eva.'・./t', a.gaD D.SOi 1.01Z t,argM Fig.6
Runs
t
toZOOshownNetworktrainingprogress atover 160 iterations
(two
hidden layers,toleranceatO.2).165
mtsntvajlvreet.
ng17e.
2oo6Kiryu Junior College
NII-Electronic Library Service
Kiryu Junior College
●
status
is
presentedbelow
:Wai
廿ngTime
(min :sec)4
:02Leaming
Tolerance1.
000
Facts105
TrainingTolerance0.
200 Bad0
Good 105Bad−
to−Good
Ratio0.
0
Runs
(COnVergenCe at)160
This time, the network trained fairly well with a bad
−
to−
good ratio of
O,
0.
Convergence was attained at l60iterations
.
Fig.
6shows the network trainingprogress
atl60 iterations
.
At thispoint,
the training was deemedsufficient for testing
.
一
networl (mo (
fel
Twelve fact files with input and output data were used to
test the trained NN model
.
The actual and the
predicted
output from the NN model were compared.
Figure 7 shows a satisfactory agreementbetween
these values.
1098765432 ぢ
9
δ 10 ≧ 当 刀 O ρ 6 」 O = Φ σ 」 O ≧ O 巳 」 ロ一
〇 ωActual vs
.
Netwo改 Output[
論
翻
211 董 01987S t G a6F54321Fig
.
7 Comparison of actual and predicted Neural Network output.
Conclusion
Although
there was a satisfactory agreementbetween
the actual and
predicted
neural network output,
it
is
clearthat the
perfomiance
of aNN
for
forecasting
or predictionis
proportionate
to the nu皿ber
of trainingfacts
ordata.
This
is
important
to enhance the neural networkslearning
process
.
Also,
we need more testingdata
to evaluate thetrained
NN .
桐生短 期 大 学紀 要
.
第17号.
2006 166
Since
at this stage of the research where the trainingdata
usedin
theNN
learning
process
was ratherlimited
,
there
is
a need to widen the conditions toinclude
seasonaland temporal variabilities such as sun angles and
atmospheric effects
,
like
cloudiness,
whichdetermine
thehourly,
daily,
monthly,
and annual photovoltaic systemgeneratlon
output.
)1
) 2 ) 3 ) 4 ) 5)
6
References
H .
Wechsler :Optimal
Sampling
Neural
Network
Performance , and Pattern Recognition
.
World
Congress on
Neural
Networks,19951nternational
Neural Network
Society
Annual Meeting,
(2
):164−
169
,
1995.
J
.
N.
Said, K
.
Khorasani,
C.
Y.
Suen:ANeocognitronSynthesized by Production Rule for Handwritten
Character Recognition
.
World Congress onNeural
Networks , 19951nternational Neural Network Society
Annual Meeting
,
(2):217−
221,
1995,
S
.
P.
Toulson :Forecasting Level and Volatility ofExchange Rates
.
WorldCongress
on NeuralNetworks,
19951nternational
NeuralNetwork
Society AnnualMeeting
,
(1):212−
215,
1995.
A .
N .
Gorban
, C
.
Waxman :NeuralNetworks
for
Political Forecast
,
World Congress on NeuralNetworks,
19951nternational Neural Network SocietyAnnual Meeting
,
(1):179−
184,
1995.
M .Schumann ,
R.
Retzko:Solving
Vehicle RoutingProblems with Self Organizing Maps
.
World Congresson
Neural
Networks ,
19951nternatienal NeuralNetwork
Society
Annual
Meeting,
(1
):189−192,1995,
B .Zhou,
H .
Machacon,
et.
al:ニ ュー
ラル ネッ トワー
クの手 法を 用い て吸 気 ガス 組 成 に よ るエ ンジン性 能 制 御とその 予 測
.
日 本機 械 学 会 集 (B 編),66
(
644
):297−302,
2000.
Acknowiedgment
The
authors wish to acknowledge the efforts of thefollowing
stlldents ofKiryu
Junior
College
:C ,
Uchiyama,
H .Eguchi,
M ,
Suzuki,
E .
Takahashi
,
K
Matsumura,
and,
M .Muraoka.
Kiryu Junior College
NII-Electronic Library Service Kiryu Junior College