〔研究論文〕
Oral Presentations in English Courses:
Effect of Instruction on Nonverbal Communication Competence
KUSANAGI Yuka
Abstract
English education as part of university-level liberal arts curricula requires both academic English literacy education (which includes instruction in how to give an academic presentation) and instruction in practical English conversation (Nihongakujutsukaigi, 2010a, 2010b). To learn how to give a presentation, students must develop not only their knowledge of the target language, the organization of presentations,
and the contents of their presentation; they also need to develop nonverbal communication skills. This study aimed to investigate the effect of nonverbal communication competence through three types of instruction: deductive, inductive, and a mix of both. The results showed that learners attained a good
performance for posture. Inductive instruction was the most effective for making eye contact, and deductive instruction had the most impact on the performance of gesture. The mixed method ranked last for both eye contact and gesture. The results show that no matter what form instruction takes, it helps learners improve
their nonverbal communication competence in oral presentations.
Keywords
: inductive instruction method, deductive instruction method, mixed instruction method, nonverbal communication1.
Introduction
In response to the spread of communicative language teaching (CLT), a practical aspect of English usage that was much emphasized in the 1990s, the Ministry of Education, Culture, Sports, Science, and Technology (MEXT) of Japan released an action plan called “‘Eigo ga tsukaeru nihonjin’ ikusei no tame no
!"! keikaku” [Action Plan to Cultivate “Japanese with English Abilities”] (2003) in order to teach the Japanese to be able to use basic English. According to the MEXT, many Japanese people in the last decade could not communicate with foreigners. The MEXT claimed that this fact would hinder the country’s
development and participation in the international community.
Reacting to the action plan, English education at both secondary and higher levels welcomed CLT. Gradually, however, there was a negative reaction to the emergence of CLT: CLT education was criticized for its ineffectiveness in the teaching of grammar. Nihongakujutsukaigi, the Science Council of Japan (2010a, 2010b), emphasized the need for instruction in academic English that includes academic writing and
academic speaking, which, in its turn, includes presentations.
2.
Literature Review
2.1.
Nonverbal Competence as Part of Communicative Competence
Research on verbal aspects of language and communication dominated the study of second language acquisition (SLA) and its application to education until the emergence of CLT in the 1980s,
when researchers and theorists began to consider the importance of nonverbal aspects of language and communication. Hymes (1972), the first researcher who proposed the concept of communicative competence, was also the first to highlight the need to include nonverbal communication components in
language teaching. Later, Brown (1980) included nonverbal competence in communicative competence, and Rivers (1983) stated that a student who was competent nonverbally should know when and how to use appropriate gestures and body language. Nonverbal strategies are highly emphasized in strategic
competence in this model.
The two most accepted communication competence models, which were developed by Canale and Swain (1980), Canale (1983), and Bachman (1990), also included nonverbal competence. In Canale and
Swain’s (1980) and Canale’s models (1983), (a) grammatical competence included mastery of paralanguage1, (b) sociolinguistic competence included mastery of the appropriate use of kinesics2 and proxemics3, and (c) strategic competence included mastery of nonverbal strategies.
Bachman and Palmer (1982) discussed receptive/productive and oral/visual skill modalities in relation to their idea of communicative competence. Bachman (1990) separated language competence into two large categories, organizational and pragmatic competence, in his communicative/language competence model. The first category consisted of grammatical competence and textual competence, and the latter category
consisted of illocutionary competence and sociolinguistic competence. In this model, Bachman stated, “Nonverbal manifestations of strategic competence ... are clearly an important part of strategic competence in communication” (1990, p. 100).
In any case, the idea of nonverbal competence was strongly related to the notion of authenticity of the target language. Brown said that nonverbal competence in communicative competence was “knowledge of all the varying nonverbal semantics of the second culture and an ability both to send and receive nonverbal
signals unambiguously” (1980, p. 202).
On a practical level of language education, researchers stressed the importance of nonverbal competence instruction. Jungheim (1995) reviewed the use of nonverbal behaviors in the communicative competence framework; he reported that gestures, gaze, and facial expressions were observed in textual use, and that gestures were used for both sociolinguistic and strategic uses. The focus of nonverbal
communicative competence instruction is on authentic and culturally coded speech-independent gestures in the target language and culture, which are called emblems. Researchers claimed that teachers should teach such gestures because they were used in everyday life, and therefore they are a must in learning a second
language (see Al-shabbi, 1993; Antes, 1996; Carels, 1981; Pennycook, 1985; von Raffler-Engels, 1980). Jungheim (1991) investigated the effect of explicit gesture instruction on acquisition of English emblems among Japanese learners by a gesture test that was developed by the researcher. The result suggested that deductive teaching was more effective than inductive teaching for the learners’
understanding of the target language gestures.
2.2.
How Nonverbal Competence is Incorporated in Public Speech
As the words “speech” and “oral presentation” suggest, information or a message is delivered through the speaker’s words. Freeburn (1994a) said that “... the most important weapon in a speaker’s armoury is the ability to reinforce meaning and intention vocally” (p. 32). Presenting the logical
point-to-point progression of well-organized content supported by appropriate data, quotations, and examples or anecdotes are all important elements of successful speech. Nevertheless, this does not promise a successful presentation. Presenters are also required to have knowledge of, and training in, how to deliver a speech,
such as the appropriate pronunciation, voice inflection, volume, and fluency.
In addition to these elements, appropriate uses of nonverbal skills and visual aids are also necessary for a successful speaker to learn (Freeburn, 1994a, 1994b, 1995). For instance, physical and verbal pointing
are considered important speech skills. Pointing at a visual aid draws listeners’ attention and helps their understanding. Changing of voice tone highlights messages, and keeps the audience engaged and interested. Silence, including pauses, also highlights key words and phrases.
Not only deictic gestures, pointing gestures, but also representational gestures can be useful tools for drawing the listener’s attention, adding information, and clarifying speech when they are used effectively and appropriately; on the other hand, when gestures are not produced successfully, they distract listeners’ attention rather than enhance their understanding (Neill & Caswell, 1993).
Good eye contact builds rapport between the speaker and audience, while weak eye contact creates uneasiness for the audience. To avoid such awkward feelings, the speaker should monitor the audience to see whether they are engaged, interested, amused, or confused.
In sum, the speaker must blend all these elements appropriately in order to give a successful speech or presentation. Awareness of all these speech skills and preparation are keys to success. A well-structured
presentation is to be spoken accompanied by nonverbal messages, not read.
2.3.
Purpose of the Research
Many Japanese university students have difficulty in giving an oral presentation using effective nonverbal skills. I have observed that many presenters just read scripts without using appropriate nonverbal skills, which might have improved the quality of their presentations. As a result, the quality of
their presentations suffered. Their lack of nonverbal competence led to unsatisfactory results.
From my teaching experience, I assume that teaching students nonverbal skills explicitly will help them improve their oral presentations; however, there are few studies on ways in which we can help EFL students attain successful nonverbal skills. For this reason, I sought the most effective instruction type in
order to improve the quality of instruction.
2.4.
Hypotheses
Explicit instruction in nonverbal speech skills promotes learners’ nonverbal production in speech. Teaching nonverbal speech skills both deductively and inductively leads to the highest achievement in students’ oral presentations. Deductive teaching yields better results than inductive teaching.
2.5.
Research Questions
Q
1.Which of the three approaches (the deductive method, the inductive method, or a mixture of the two) is the most effective in teaching nonverbal speech skills?Q
2.Which nonverbal speech skills are easy for students to develop, and which ones are difficult?3.
Background
This study was conducted at a private university in an urban area of Japan. The course aimed to develop freshmen’s communicative skills and was offered in two 90-minute lessons a week. The course
syllabus stated the following:
[The course] prepares students for communicating in an international environment. It combines language skill practice with development of international awareness. In the course, students start
by talking about themselves, their daily life, interests and personality. Skill training helps students overcome their fear of English and focuses on personal topics, which are of use when forming relationships with people from other cultures.
Teachers choose one of the textbooks selected by the university: Springboard 2 (Richards, 1999) or Let’s Talk 2 (Jones, 2002) according to the students’ levels and interests in each class. The English Program also had unified syllabi including a grade assessment policy. The final grade must be determined by the student’s attendance, participation, and final presentations (30%, 30%, and 40% respectively). At the end
of the course, all students were required to give a presentation of four to five minutes in length. Because the result of the final presentation is a large percentage of the final grade, the teachers must include speech skill instruction into the class syllabus. Speech preparation skills were taught using a speech textbook
called Speaking of Speech4 (Harrington & LeBean, 1996). The students’ presentations were assessed by three major speech components suggested by the book; however, each individual teacher designed and provided his/her own evaluation system to the class.
In the courses, final oral presentations were given as criterion-referenced tests that evaluated students’ achievement in speaking ability. At other institutions, oral proficiency is usually evaluated by an interview test (see Bachman, 1990; Bachman & Savignon, 1986; Jenkins & Parra, 2003; Ross & Berwick, 1992). An interview-type test may be ideal to assess the students’ oral and aural performances; however,
there was a time constraint for administering such an evaluation due to large class size. On average, each class consisted of 35 students, and for this reason the university decided to require short oral presentations demonstrating students’ achievements in speaking.
4.
Method
4.1.Participants
The participants included a total of 104 freshmen from three classes from the Spring semester. The classes were randomly selected for three treatment groups: the deductive, inductive, and deductive/ inductive groups. These classes were taught by three different non-native-speaking teachers of English
who had taught the course several times prior to that semester. Note that one of the classes, the inductive group, was taught by the author of this paper. The teachers were all familiar with the course syllabus and textbooks used in this course. The deductive group had 34 students, and the other groups had 35 students
each. The deductive and inductive groups were from the Department of Law, and the mixed group was from the Department of Literature. The level of the groups was considered lower intermediate according to the placement decision of the university.
Note that a control group was not added to this study because of educational concerns. The researcher thought that students who receive no instruction on nonverbal speech skills would not benefit as much as other students who do, and this potential result was against the researcher’s policy.
4.2.
Materials
For evaluation of the final presentations, a 4-point Likert analytic rating scale specially developed for this speaking course (Kumazawa, 2004) was used for assessing the students’ performances. In Kumazawa’s study, rater reliability for the older version of the scale (a 5-point Likert scale) among 34 student raters was
reported to be high: .99. The scale is written in Japanese and has three sections, which reflect the teaching components of the textbook Speaking of Speech (Harrington & LeBean, 1996). The first section of the scale is related to the physical message and consists of six items: eye contact, posture, gesture, voice inflection,
delivery, and volume. The second section focuses on the textual message and has five items: message, introduction, body, conclusion, and understandability. The third section centers on visual aids and contains two items: quality of visual aids and effective use of visual aids.
In this study, three items on kinesic skills (eye contact, posture, gesture) are used for analysis. In a wider view, voice-related production is considered as a nonverbal behavior, but the present paper focuses on only kinesic behaviors. The target performance goals are to (a) have equal and constant distribution of eye contact with audience, (b) have firm but relaxed posture, and (c) use gestures appropriately and effectively;
gestures should enhance speech (e.g., emphasis, comparison, showing the order, adding information). All the final presentations made by the students were videotaped for rating.
4.3.
Procedures
In this study, all the treatment groups had the same procedures except for the instruction. They had three 90-minute lessons focusing on the physical message, but the conditions were different. The
deductive group received the teacher’s explanations first and was then given exercises from the textbook. The inductive group did not use the textbook; instead, they watched videotaped final presentations by three speakers from the previous speaking course, videotaped group presentations that they performed
themselves, and watched their own group presentations on the video. The mixed instruction group received the teacher’s explanations, did exercises from the textbook, and watched the same videotape of final presentations by students from the previous course; however, they did not watch their own presentations. All the groups had a training session on evaluation and speech rehearsal. Prior to the presentation days, the students watched the videotape of three presentations that was used for the inductive group and the mixed instruction group; next, they evaluated the three speakers in the video using a 4-point Likert scale evaluation sheet. The purpose of this activity was to familiarize the students with the scale and
practice evaluating peer students for the actual presentation days.
Lastly, all the students gave final presentations for four to five minutes, self-evaluated their own speeches, and evaluated peer students’ speeches. The students chose speech topics from the topics in
the textbooks. During the presentations, a student camera person videotaped the presentations under the teachers’ supervision in each class.
After the semester ended, the videotaped data were sent to a rater who is a non-native-speaking teacher of English. She taught the same course in the previous year and was familiar with the students and the course goals in the program. She watched the videos and evaluated each student performance on the
4-point Likert scale, which was the same scale that the students used in the lessons.
4.4.
Analysis
All the scores of the 104 presentations evaluated by the rater were processed into an EXCEL spread sheet format. Then, the data were converted into SPSS version 11.0 and analyzed for descriptive statistics including means and standard deviations and One-way ANOVA to compare the instruction effect between the groups. At the stage of computing descriptive statistics, I decided to exclude the results of Item 2
(posture) in the ANOVA analysis because the mean revealed that Item 2 was too easy to perform for most of the students (Ms = 3.94, 4.00, 3.88 for Groups 1, 2, and 3 respectively). The assumptions of ANOVA were checked before running the One-way ANOVA (see Hatch & Lazaraton, 1991; Tabachinick & Fidell,
1996). One sample was omitted from Group 2 and Group 3 each in order to have equal N-size in each cell in the One-way ANOVA analysis. As a result, scores of 102 presentations (N = 102) were used for the analysis.
5.
Results
5.1.
Results for Research Question 1
Q
1.Which of the three approaches (the deductive method, the inductive method, or a mixture of the two) is the most effective in teaching nonverbal speech skills?5.1.1.
Overall kinesic skills (a combination of Item 1: eye contact and Item 3: gesture).
Split-half reliability of students’ performance in kinesics was .7379. The result of statistical analysis (One-way ANOVA) indicated that a significant effect was found between the groups (F = 17.550, df 2-99,
Fcri = 3.11, p < 0.05). As the hypothesis predicted, the inductive group made the least progress among the groups. However, contrary to the hypothesis, the deductive group exceeded the mixed instruction group. Scheffe’s Post Hoc Tests revealed that the three groups were different independently; however, eta squared
was .262, which means that the effect of the three instructional treatments weakened each separate group (see Tables 1, 2, & 3).
Table 1
Items 1 and 3: Descriptive Statistics
Group N Mean Std.
Deviation ErrorStd. Interval for Mean95% Confidence Minimum Maximum Lower Bound Upper Bound Deductive 34 6.62 1.18 0.20 6.21 7.03 4 8 Inductive 34 4.62 1.69 0.29 4.03 5.21 2 7 Mixed 34 5.74 1.26 0.22 5.29 6.18 3 8 Total 102 5.66 1.61 0.16 5.34 5.97 2 8
Table 2
Items 1 and 3: ANOVA Sum of Squares df Mean Square F Sig. Between Groups 68.314 2 34.157 17.550 0.000 Within Groups 192.676 99 1.946 Total 260.990 101
Table 3
Items 1 and 3: Scheffe and Post Hoc Test Mean Difference
(I-J)
Std. Error Sig. 95% Confidence Interval for Mean (I) GROUP (J) GROUP Lower Bound Upper Bound 1 2 2.00* 0.34 0.00 1.16 2.84 3 0.88* 0.34 0.04 0.04 1.72 2 1 -2.00* 0.34 0.00 -2.84 -1.16 3 -1.12* 0.34 0.01 -1.96 -0.28 3 1 -0.88* 0.34 0.04 -1.72 -0.04 2 1.12* 0.34 0.01 0.28 1.96 * The mean difference is significant at the .05 level.
Groups 1, 2, 3 refer to the deductive, inductive, and mixed instruction groups respectively.
5.1.2.
Eye contact (Item 1)
The result of the One-way ANOVA revealed that a significant effect was found between the groups (F = 30.759, df 2-99, Fcri = 3.11, p < 0.05). However, the significant result was in the opposite direction to the hypothesis. The inductive group performed the best, followed by the deductive group and the deductive and inductive group. Scheffe and Post Hoc Test indicated that the groups were independently different. Eta
squared was .383, which means that the effect of the three instructional treatments fairly weakened each separate group (see Tables 4, 5, & 6).
Table 4
Item 1: Descriptive Statistics
Group N Mean Std.
Deviation ErrorStd. Interval for Mean95% Confidence Minimum Maximum Lower Bound Upper Bound Deductive 34 3.412 0.609 0.104 3.199 3.624 2 4 Inductive 34 3.882 0.327 0.056 3.768 3.996 3 4 Mixed 34 2.735 0.790 0.136 2.460 3.011 1 4 Total 102 3.343 0.764 0.076 3.193 3.493 1 4
Table 5
Item 1: ANOVA Sum of Squares df Mean Square F Sig. Between Groups 22.608 2 11.304 30.759 0.000 Within Groups 36.382 99 0.367 Total 58.990 101Table 6
Item 1: Scheffe and Post Hoc Test
Mean Difference (I-J)
Std. Error Sig. 95% Confidence Interval for Mean (I) GROUP (J) GROUP Lower Bound Upper Bound 1 2 -0.471* 0.147 0.008 -0.836 -0.105 3 0.676* 0.147 0.000 0.311 1.042 2 1 0.471* 0.147 0.008 0.105 0.836 3 1.147* 0.147 0.000 0.782 1.512 3 1 -0.676* 0.147 0.000 -1.042 -0.311 2 -1.147* 0.147 0.000 -1.512 -0.782 * The mean difference is significant at the .05 level.
Groups 1, 2, 3 refer to the deductive, inductive, and mixed instruction groups respectively.
5.1.3.
Posture (Item 2)
The result of descriptive statistics showed that the students in all groups showed very high achievement on posture (Ms = 3.94, 3.88, 4.00). No instruction effect was seen between the three
Table 7
Item 2: Descriptive Statistics
Item Group N Mean SD
Item 1 Deductive 34 3.41 0.61 (Eye Con) Inductive 34 2.44 1.05 Mix 34 2.74 0.79 Group Mean 102 2.86 0.92 Item 2 Deductive 34 3.94 0.24 (Posture) Inductive 34 3.88 0.33 Mix 34 4.00 0.00 Group Mean 102 3.94 0.24 Item 3 Deductive 34 3.21 0.81 (Gesture) Inductive 34 2.18 0.83 Mix 34 3.00 0.65 Group Mean 102 2.79 0.88 5.1.4.
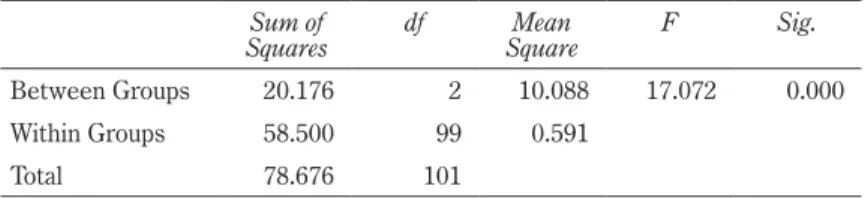
Gestures (Item 3)
The result of the One-way ANOVA indicated that a significant difference was found between the groups (F = 17.072, df 2-99, Fcri = 3.11, p < 0.05). Contrary to the hypothesis, the deductive group exceeded the other groups. The Mixed instruction group did better than the inductive group. Scheffe and Post Hoc Test revealed that the deductive group and the mixed instruction group had a similar tendency,
and they were different from the inductive group. This may suggest that deductive instruction had stronger impact on students’ gesture production than inductive instruction. Eta squared was .256, which means that the effect of the three instructional treatments weakened each separate group (Tables 8, 9, & 10). Jungheim
(1991) also reported that deductive instruction worked better than inductive instruction for understanding emblems. In the present study, the students’ gestures were fairly fixed in their forms and limited to the gestures that accompany utterances beginning with ‘First,’ ‘Second’, which were introduced in the speech
textbook. They also can be considered as emblems.
Table 8
Item 3: Descriptive Statistics
Group N Mean Std. Deviation
Std. Error
95% Confidence
Interval for Mean Minimum Maximum Lower
Bound BoundUpper
Deductive 34 3.206 0.808 0.139 2.924 3.488 1 4 Inductive 34 2.176 0.834 0.143 1.886 2.467 1 4 Mixed 34 3.000 0.651 0.112 2.773 3.227 2 4 Total 102 2.794 0.883 0.087 2.621 2.967 1 4
Table 9
Item 3: ANOVA Sum of Squares df Mean Square F Sig. Between Groups 20.176 2 10.088 17.072 0.000 Within Groups 58.500 99 0.591 Total 78.676 101Table 10
Item 3: Scheffe and Post Hoc Test
Mean Difference (I-J)
Std. Error Sig. 95% Confidence Interval for Mean (I)
GROUP
(J) GROUP
Lower
Bound BoundUpper 1 2 1.029* 0.186 0.000 0.566 1.493 3 0.206 0.186 0.546 -0.257 0.669 2 1 -1.029* 0.186 0.000 -1.493 -0.566 3 -0.824* 0.186 0.000 -1.287 -0.360 3 1 -0.206 0.186 0.546 -0.669 0.257 2 0.824* 0.186 0.000 0.360 1.287 * The mean difference is significant at the .05 level.
Groups 1, 2, 3 refer to the deductive, inductive, and mixed groups respectively.
5.2.
Results for research question 2
Q2. Which nonverbal speech skills are easy for students to develop, and which ones are difficult?
Among the three skills included in the evaluation, posture was the easiest to achieve for the students. Most of the students had good posture while giving final presentations (M = 3.94, SD 0.24). Since the final presentations were given as criterion-referenced tests, the result was ideal. The results of students’
performances on eye contact and gesture in the final presentations were very similar (M = 2.86, SD = 0.92 for eye contact, M = 2.79, SD = 0.88 for gesture). It means that the students could achieve the two skills considerably well, and their achievement of the two skills within the groups was homogenous (see Table 7).
6.
Discussion and Conclusion
The major findings of this study can be summarized as follows:
1.Among the three evaluation items, posture was the easiest nonverbal skill, and eye contact and gesture were almost equally difficult to perform in a speech. The deductive instruction significantly enhanced
the students’ overall kinesic performances.
2.The mixed deductive and inductive instruction method came next, and the inductive instruction method had the smallest effect on the students’ performances in the final presentations.
3.The inductive instruction method significantly enhanced the students’ eye contact. The deductive instruction method was the next best, and the mixed instruction had the least effect one eye contact. 4.The deductive instruction had the strongest effect on the students’ gesture production in the oral
presentations. The mixed instruction method had the second strongest effect, and the inductive instruction method had the smallest effect.
Questions arise after obtaining the above mixed results on instruction effect. Does effective instruction differ according to skills? Does instruction effect work differently on a single skill and a combination of skills? Further investigation using improved research methods must be conducted.
The mixed results of the study can be attributed to the messiness of the data, which may be explained as
follows.
Kumazawa (2004) reported that among the 13 items on the evaluation sheet, eye contact, gesture, and voice inflection were difficult items, and most of the student raters were lenient when assessing
these aspects of speech performances. This may have resulted from the ambiguous nature of nonverbal communication behaviors. Assessment of gestures is particularly difficult because they are strongly tied with speech in a conversation or a public speech. The appropriateness of gestures cannot be assessed
without speech. Thus, the successful use of gestures depends on the combined outcome of speech and gestures; gestures also determine the listener’s impression of the speaker’s speaking competence (see Jenkins & Parra, 2003; Ross & Berwick, 1992). This integrated nature of speech and gestures may make
assessment of nonverbal skills difficult for raters.
Second, some of the descriptions on the evaluation scale were vague, and this problem may have caused imprecise rating. According to the rater’s feedback, clearer distinctions should be made between the
scores, and this can be improved by checking the wording in each cell for Item 1 (eye contact). The rater also mentioned about a translation problem with the term “posture.” In the evaluation score sheet, “posture” was translated as shisei
(
姿勢)
. In Japanese, shisei refers to how upright the body is. In a public speech, the angle of the speaker’s standing position (the speaker facing the audience or not) and head (the bodyis upright in a good relaxing manner but with the head up or down) should be considered as well as how upright the speaker stands. The rater commented that this is one of the reasons why most of the students got very good assessment on their posture production irrespective of their actual achievement. The word
shisei can be rephrased by another word such as karada no muki
(
身体の向き;
bodily position)
or karada no kamae(
身体の構え; posture)
. In sum, the terms, descriptions, and the level of easiness between the 4-point scores in the evaluation sheet should be reexamined for further improvement of the scale.Third, more control of the quality of each instruction must be considered. It is ideal that the same instructor teaches all the groups; however, it is not always possible in practice. To overcome this problem,
design needs to be more carefully considered and teachers in each group should be briefed on the procedures more carefully. The same can be said about data collection. Although careful instructions were given for videotaping, the quality of visual data differed slightly in each group. More careful step-by-step
instructions should be given to the camerapersons.
Fourth, this study analyzed only the students’ performances at the end of the semester. Comparison analysis of their performances at different times (e.g., at the beginning or in the middle of the semester
vs. at the end of the semester) will present us with more meaningful results. Fifth, qualitative data such as teacher and students’ comments and observation of the lessons will give us a chance to understand how the students learn nonverbal skills. Lastly, to make this type of study more reliable, multiple raters’ assessment will result in more consistency in raters’ judgments on ambiguous human behaviors.
The results of this study suggest that explicit instruction in nonverbal speech skills (no matter if it was deductive, inductive, or the mixture of the two) helped the students acquire nonverbal competence at a fairly satisfactory level. Although mastering nonverbal competence is challenging for the students, they will
benefit from it in their future use of English or even in their first language. Therefore, by being presented with more opportunities to use different kinds of speech skills in future courses, students will be able to train themselves to become more confident speakers.
Notes
1)Paralanguage refers to some vocal features such as loudness and tempo, stress and intonation, vocal quality that accompany speech and contribute.
2)Kinesics is the study of bodily movements, gestures, head nods, and facial expressions. 3)Proxemics is the study of how individuals maintain a distance between them.
4)Speaking of Speech (Harrington & LeBean, 1996), a speech textbook designed for language students, tells learners that a good and clear speech is delivered by three types of messages: the physical message, the story message, and the visual message. The physical message includes voice inflection,
eye contact, gestures, and posture. The story message is the same as the speech structure of introduction, body, and conclusion. The visual message can be presented by visual aids such as graphs, charts, photographs, illustrations, maps, and diagrams. The ideas and information in this textbook
Acknowledgement
I would like to express my gratitude to the reviewer whose comments and suggestions were of inestimable value for my study.
References
Al-shabbi, A. E. (1993). Gestures in the communicative language teaching classroom. TESOL Journal, 2(3), 16 – 19.
Antes, T. A. (1996). Kinesics: The value of gesture in language and in the language classroom. Foreign Language Annals, 29(3), 439 – 448. doi: 10.1111/j.1944-9720.1996.tb01255.x
Bachman, L. S. (1990). Fundamental considerations in language testing. Oxford: Oxford University Press.
Bachman, L. F., & Palmer, A. A. (1982). The construct of validation of some components of communicative proficiency. TESOL
Quarterly, 16, 449 – 465. doi:10.2307/3586464
Bachman, L. F., & Savignon, S. J. (1986). The evaluation of communicative language proficiency: A critique of the ACTFL Oral Interview. The Modern Language Journal, 70 (4), 380 – 390. doi:10.1111/j.1540-4781.1986.tb05294.x
Brown, H. D. (1980). Principles of language learning and teaching. Englewood Cliffs, NJ: Prentice Hall.
Canale, M. (1983). From communicative competence to communicative language pedagogy. In Language and communication, Jack Richards and Richard Schmidt (Eds.), 2 – 25. New York: Longman.
Canale, M., & Swain, M. (1980). Theoretical bases of communicative approaches to second language teaching and testing.
Applied Linguistics, 1, 1 – 47. Retrieved from http://dx.doi.org/10.1093/applin/1.1.1
Carels, P. E. (1981). Pantomime in the foreign language classroom. Foreign Language Annals, 14 (5), 407 – 411.
Freeburn, R. D. (1994a). Speaking in public. Part I: Stand, speak, point and make them listen. Executive Development, 7 (4), 31 – 32.
Freeburn, R. D. (1994b). Speaking in public. Part II: Voice and image. Executive Development, 7 (6), 33 – 34.
Freeburn, R. D. (1995). Speaking in public. Part III: Let your body speak for you. Executive Development, 8 (1), 12 – 14. Hatch, E., & Lazaraton, A. (1991). The research manual: Design and statistics for applied linguistics. NY: Newbury House. Harrington, D., & LeBean, C. (1996). Speaking of speech. Tokyo: MacMillan Language House.
Hymes, D. (1972). On communicative competence. In J. Pride & J. Holmes (Eds.), Sociolinguistics: Selected readings (pp. 269 – 293). Harmondsworth: Penguin.
Jenkins, S., & Parra, I. (2003). Multiple layers of meaning in an oral proficiency test: The complementary roles of nonverbal, paralinguistic, and verbal behaviors in assessment decisions. The Modern Language Journal, 87(2), 90 – 107. doi:10.1111/1540-4781.00180
Jones, Leo. (2002). Let’s Talk 2. Cambridge: Cambridge University Press.
Jungheim, N. O. (1991). A study on the classroom acquisition of gestures in Japan. The Journal of Ryutsu keizai University,
26(1), 61 – 68.
Jungheim, N. O. (1995). Assessing the unsaid: The development of tests of nonverbal ability. In J. D. Brown & S. O. Yamashita (Eds.), Language testing in Japan. (pp.149 – 165). Tokyo: The Japan Association for Language Teaching.
Kumazawa, T. (2004). Analytic rating scale for IWE presentation performance. The Journal of Rikkyo University Language
Center Journal, 10, 27 – 44.
Ministry of Education, Culture, Sports, Science, and Technology. (2003). “‘Eigo ga tsukaeru nihonjin’ ikusei no tame no !"!#
shingi/chukyo/chukyo3/004/siryo/04031601/005.pdf
Neill, S., & Caswell, C. (1993). Body language for competent teachers. London: Routledge.
Nihongakujutsukaigi [The Science of Council of Japan]. (2010a). $%&'(#('#)*(+!: Gakujutsu kara no teigen: $%,-%..*% %#('# /!/!#)'# /!/! /!% 0 [Japan’s prospect: A proposal of science for liberal arts and liberal arts education]. Retrieved from http://www.scj.go.jp/ja/info/kohyo/pdf/kohyo-21-tsoukai-4.pdf
Nihongakujutsukaigi [The Science of Council of Japan]. (2010b). Kait!: Daigaku no bunyabetsuhosh! no arikata ni tsuite
[Expected Education for each academic field in higher education]. Retrieved from http://www.scj.go.jp/ja/info/kohyo/ pdf/kohyo-21-k100-1.pdf
Pennycook, A. (1985). Actions speak louder than words: Paralanguage, communication, and education. TESOL Quarterly, 19(2), 259 – 282. doi:10.2307/3586829
Richards, J. C. (1999). Springboard 2. Oxford: Oxford University Press.
Rivers, W. M. (1983). Communicating naturally in a second language: Theory and practice in language teaching. Cambridge: Cambridge University Press.
Ross, S., & Berwick, R. (1992). The discourse of accommodation in oral proficiency interviews. Studies in Second Language
Acquisition, 14, 159 – 176. doi:10.1017/S0272263100010809
Tabachinick, B. G., & Fidell, L. S. (1996). Using multivariate statistics (3rded.). New York: Harper Collins.
von Raffler-Engel, W. (1980). Kinesics and paralinguistics: A neglected factor in second-language research and teaching. The