Chapter 1 Research on Agricultural Economy in
Peru in the 1980s and 1990s
権利
Copyrights 日本貿易振興機構(ジェトロ)アジア
経済研究所 / Institute of Developing
Economies, Japan External Trade Organization
(IDE-JETRO) http://www.ide.go.jp
シリーズタイトル(英
)
Latin America Studies Series
シリーズ番号
2
journal or
publication title
Economic Liberalization and Evolution of Rural
Agricultural Sector in Peru
page range
3-10
year
2003
CHAPTER 1
RESEARCH ON AGRICULTURAL ECONOMY IN PERU
IN THE 1980s AND 1990s
Carolina Trivelli1 Introduction
The first years of the 1980s brought a number of changes in the economic and social environment in the country, which affected the agrarian research agenda. The international debt crises imposed serious restrictions on small countries like Peru and it became bottlenecks for most efforts aimed at managing or solving the economic crises of those years. Inflation began to be a persistent and growing problem. Macroeconomic analysis became the most appealing need. In this sense, agrarian researchers had to answer a number of questions about the role, potential, needs, and impacts of different macroeconomic scenarios in the sector, as well as the contribution of the agricultural sector to the macroeconomic stability (generation of foreign currency, jobs, prices).
In addition to this new economic setting, the increasing presence of Shining Path (Sendero Luminoso) mainly in rural areas in those years forced researchers to abandon fieldworks. This is important if we consider that during the 1970s and the first half of the 1980s, most of the work in agrarian research was based on fieldworks for microeconomic analysis on different rural activities. To complete the changing scenario, in 1983 we experienced a serious climatic distortion: El Niño. The effects of the climate changes were severe in most agricultural activities, and in the economy as a whole.
After 1985, with Garcia’s government, new macroeconomic policies were implemented. During the first two years we experimented, as never before, favorable relative prices for agricultural goods, subsidized inputs (credit, fertilizers, etc.) and a number of “promotional” policies to induce agrarian growth. However, the whole macroeconomic management was poor and in 1987 an increasing inflationary process and the deepening of the economic crises began, a situation that remained unsolved until the 1990s.
In the 1990s, the new government applied a structural adjustment program that redefined all economic relations in the country. In the agricultural sector, the adjustment began vigorously, but slowed down and had unclear objectives after the first years.
Based on the context described, it is easy to understand why agrarian research was centered on macroeconomic issues (the agrarian sector seen as one productive
1 Director and researcher of Institute of Peruvian Studies (Instituto de Estudios Peruanos:
sector), rather than continuing to study the microeconomic behavior of the different types of agricultural producers or rural economic strategies.
Agriculture and macro economy
Escobal (2000) presents a short and precise history of the evolution of the agricultural sector since the 1970s linking with major economic changes. The import substitution model adopted in the 1970s and the needs to provide reasonable prices for producers ended in a state managed marketing system. Most of the rural investments were held by the public sector. The public investments began losing significance as the economic crises appeared, but state control of important prices for agricultural development remained. The liberalization of the first years of the 1980s was truncated because of the international economic crises and by El Niño, among other factors.
With the new government, in 1985, input prices were fixed while the aggregated demand was expanding, bringing agricultural prices up compared to industrial prices (that were tied to the fixed exchange rate) (Escobal, 2000). Although increasing agricultural prices came together with subsidies for major inputs, this situation ended in 1988 because of the fiscal crises. This new setting did not change the situation for most rural producers. Escobal (1992) showed that subsidies favored only the richer producers and that all of them were counteracted by the inflationary process from 1988 (Escobal, 2000).
This complicated situation was reflected in the diminishing agricultural GDP in those years.2 Escobal (2000) points out that, in spite of the recession, the smaller and poorer rural households did better. Their lack of market integration protected them from the crises (through crop diversification and self-support). However, at the end of the 1980s nearly 80% of rural population was below the poverty line. There was almost no investment (public or private) in the sector, and no sectoral policy.3
The 1990s began with a new government, which was faced with the challenge of redefining the economy to overcome the crises. The strategy adopted by the new government was to liberalize the economy and to promote a market oriented policy together with a structural adjustment. Agrarian sector was one of the most affected by the reforms adopted in the first two years. After 1992, reforms in agriculture became unclear and with mixed goals.
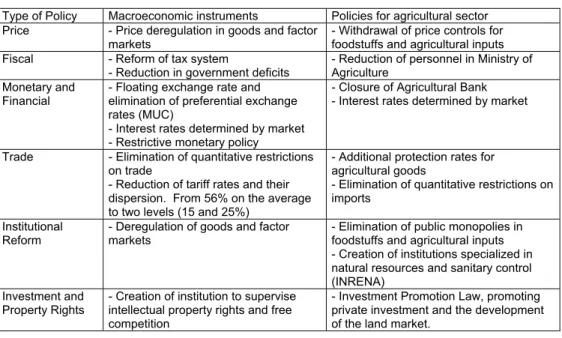
Reforms implemented for agriculture are presented in Table 1.
2 Agricultural GDP experienced a contraction of 16.5% between 1988 and 1992 (Hopkins,
1999).
3 GDP was decreasing as well as the importance of the sector in the economy. Hopkins
(1999) shows that agriculture contributed with 23% of the GDP in the 1950s and around 12% in the late 1980s. At the end of the 1990s, however, INEI estimates that agricultural
Table 1. Main Policies Implemented by the Government
Type of Policy Macroeconomic instruments Policies for agricultural sector Price - Price deregulation in goods and factor
markets
- Withdrawal of price controls for foodstuffs and agricultural inputs Fiscal - Reform of tax system
- Reduction in government deficits
- Reduction of personnel in Ministry of Agriculture
Monetary and Financial
- Floating exchange rate and elimination of preferential exchange rates (MUC)
- Interest rates determined by market - Restrictive monetary policy
- Closure of Agricultural Bank - Interest rates determined by market
Trade - Elimination of quantitative restrictions on trade
- Reduction of tariff rates and their dispersion. From 56% on the average to two levels (15 and 25%)
- Additional protection rates for agricultural goods
- Elimination of quantitative restrictions on imports
Institutional
Reform - Deregulation of goods and factor markets - Elimination of public monopolies in foodstuffs and agricultural inputs - Creation of institutions specialized in natural resources and sanitary control (INRENA)
Investment and Property Rights
- Creation of institution to supervise intellectual property rights and free competition
- Investment Promotion Law, promoting private investment and the development of the land market.
Source: Hopkins (1999) p. 155.
Following Hopkins (1999) the impacts of the reforms could be discussed in three areas: prices and production, sustainability of agricultural growth and rural poverty. In terms of prices and production, after the reforms, agricultural GDP began a recovery trend. Dancourt and Mendoza (1994) show that immediately after the reforms, due to their negative effect on agricultural prices, agricultural output continued to fall. However, Hopkins (1999) shows that beginning in 1993 GDP began its recovery. Between 1993 and 1996 annual agricultural GDP grew around 9%. The trend continued in the next years but at a slower rate.4
As shown by Dancourt and Mendoza (1994) relative prices for agricultural products experienced reductions throughout the 1990s. Moreover, in year 2000 some nominal agricultural prices fell. This price behavior reduces profitability and investments in the sector, although it helps to avoid increases in poverty through cheaper consumption goods.
After the first years, the reforms in the sector began losing vitality and the orientation of the agricultural policy changed, smoothing some reforms, diffusing their impacts, or changing completely their original goals. Political power of some agricultural authorities could even obtain special measures for the sector, such as commercial protection or tributary exceptions, although they were against the whole economic orientation and strategy.5 These measures affected the next issue of discussion: the
sustainability of the growth trend.
4 It is necessary to be careful with GDP data because of the known data manipulation in the
last years of the decade.
Concerning sustainability of agricultural growth, Hopkins (1999) notes that together with the reforms and the economic stabilization some other key actions contribute to the goal of having sustainable growth in the sector. In this sense, the end of Shining Pass (Sendero Luminoso), the construction of rural roads, privatizations, reforms in key markets such as land and credit represent important issues. However, recognizing the improvements achieved in the last years Escobal (2000) points the need for further reforms, in almost all aspects and topics mentioned, in order to observe a sustainable growth trend in the agricultural sector.
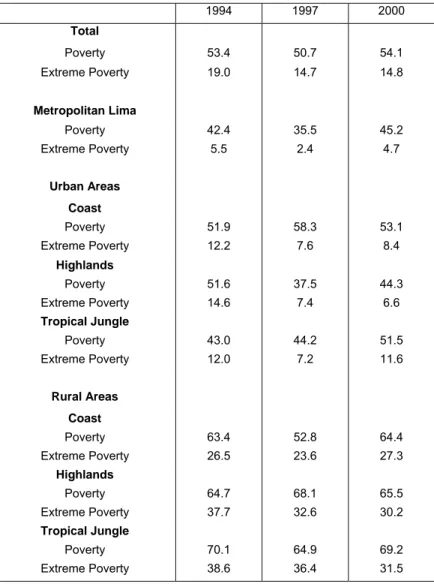
Finally, the rural poverty problem has attracted great attention, mainly due to its magnitude and severity. As shown in Table 2, poverty in rural areas is a problem affecting almost all inhabitants in rural areas. In that sense, the viability of developing efforts based on the private initiatives through the market are very limited. Trivelli (2000) showed that non-poor rural households are nearer to being poor than being rich.
The research agenda developed in the second half of the decade of the 1990s was focused on measuring the impact of the various reforms, to understand the new context, and to open again the road to conduct more microeconomic analyses. After 1996 or 1997 the interest in the evolution of the sector as a whole began to lose attractiveness. The main reforms, with all their limitations, were done; most impacts were less important than expected (or desired), mostly due to problems in other sectors or specific market or to political interference; and, most reforms had been already evaluated. All this together with the absence of discussions on agricultural sector policy, favored researchers' option was to go back and to analyze microeconomic aspects of the agricultural and rural sector.
In this context, agrarian researchers began to look back at the microeconomic foundations, but not as a way to capture and understand behaviors but to study market integration practices, possibilities and limitations of different groups of producers and rural households. This new research agenda was defined as a natural consequence of the reform impacts analysis, of the new scenario that allows again field works and the existence of valuable data sets to make the first approach to the microeconomic analysis such as National Living Standard Survey (ENNIV) and the 1994 Agrarian Census.
Research on rural poverty
Studies of rural poverty in the sixties or seventies were general in nature. Only occasionally the particular problem of rural poverty was treated. Up to the 1980s, a large proportion of rural poverty studies was handled as a minor part of bigger evaluations on the health of the economy. There were two approaches to study rural poverty in these first decades: a) explain the distributive problem and the “dualism” of Peru’s economy and b) understand the relations at the core of the rural society.
The studies of wealth distribution and the definition of the relations between the modern and traditional sectors gave new insights into why economic growth was not sufficient to reach “economic success”. After the pioneer work of Webb and Figueroa (1975), the vision of a homogeneous social group of rural poor was
discarded because there was much inequality among them. This conclusion resulted in the surge of specific case studies.
With the economic crises of the 1980s and the upsurge of terrorism, the problem of poverty (which had been acquiring relevance in researches) couldn’t become a major research theme. The emphasis of the studies centered solely in the economic problem, leaving behind the ethnographic-social component of the research.
The evolution of the name given in poverty studies to the individuals (from indian to
peasant, and then to just poor in the last decade) showed that the process, by which
poverty affects society, had become irrelevant. It doesn’t matter what made them poor.
Finally, in the 1990s, there were two major approaches to the study of poverty: one is to quantify poverty with the help of living standards surveys and the other is to evaluate impact of different policies in certain groups of population.
Rural poverty studies
The majority of studies are based on the information given by the National Living Standard Survey (ENNIV). However, it is necessary to have in mind the big disparities between the different regions in Peru and that the national average could not represent the poor.
Distributive problems and their impact on poverty have returned to the literature after some decades but the conclusions reached are diverse. Some researchers say that wealth distribution has polarized while others say that the problem has ameliorated.
Several methods can be used to identify the poor. The most commonly used methods are poverty lines and the FGT. Both use the database of the ENNIV and an estimate of the basic products consumed by individuals. This type of database has some limitations but at the same time can give lots of information to the researcher.
A second group of methods is to use an indicator of unsatisfied basic needs (NBI) and the integrated method, which define several categories of poverty. Eguren et al. (1997) find that using this last method, only 13.3% of rural Andean households are located in the category integrated, which is a result of the lack of basic need.
Regional distribution of poverty
In absolute terms, the majority of poor are located in urban zones (where 70% of the population lives). Yet, extreme poverty is concentrated in the rural highland area (sierra). This is reflected in the statistics which show that for 1985, more than 3 million people did not manage to cover the basic consumption needs and had at least one basic needs unsatisfied. In 1997, the number rose up to more than 4.3 million.
The Peruvian heterogeneity compels the use of precise sources of information. In that sense, sampled information obtained by surveys does not always capture the particular characteristics of determined social groups. Yet it is necessary to have in
mind that an excess quantification might also result in a loss of subsidiary information. Furthermore, as the non-poor group is nearer to being poor than to being rich, a precise poverty line could be irrelevant in practice.
Looking at the statistics, there is a considerable proportion of non-poor that benefits from social programs of poverty alleviation such as the “Vaso de Leche” (free milk for breakfast) program. This speaks for the fragile situation of the non-poor. If they would not be able to continue to receive help from this type of programs, they might return to the category of poor. In the same sense, it is important to note that non-poor homes are not concentrated in areas integrated into the national economy, reaffirming the existence of a subtle dividing line between poor and non-poor. The ENNIV shows that as the level of income rises, the education level of the parents increases and the economic dependency ratio of the households decreases. Reflecting upon the situation of the rural inhabitants as a whole, it can be stated that to develop these areas there is an urgent need of public policies that include the poor and the non-poor. The precarious situation of the rural area is such that poverty-alleviation programs are not enough. There is a need for a strategic development program of peasants.
Public policies and rural poverty
There has been an evolution in the measure of poverty alleviation policies. Universal policies were encouraged in the 1970s but they were replaced in the 1980s by emergency programs that made distinction between social assistance programs and social policies. Finally, the last decade has seen the appearance of focalized social spending and poverty alleviation programs. This last approach to poverty reflects the absence of a unified fight against poverty and despises the inclusion of poverty-easing measures in macroeconomic policy.
Many researchers state that rural areas will only see a substantial improvement if there is significant and sustainable increase in real GDP per capita in rural area and especially in industries such as construction and agriculture. Jointly, the social assistance should continue its effort to bring permanent (investments in education and health) and temporal (poverty alleviation) support. In this sense, permanent
expenditure in social programs has increased from the 1980s to the 1990s.
Nonetheless, the expenditure for education and health has been unevenly distributed. In 1996 just 35% of the expenses benefited the 40% poorest population. This reaffirms that the distribution of social expenditure goes in hand with the distribution of population and not in hand with the distribution of wealth.
There has been an improvement in the quality of education brought to rural areas, but it should be articulated with other complimentary changes (e.g. incentives for teachers, fight against functional illiterates, etc.).
Table 2 Poverty by geographical zone (% of population) 1994 1997 2000 Total Poverty 53.4 50.7 54.1 Extreme Poverty 19.0 14.7 14.8 Metropolitan Lima Poverty 42.4 35.5 45.2 Extreme Poverty 5.5 2.4 4.7 Urban Areas Coast Poverty 51.9 58.3 53.1 Extreme Poverty 12.2 7.6 8.4 Highlands Poverty 51.6 37.5 44.3 Extreme Poverty 14.6 7.4 6.6 Tropical Jungle Poverty 43.0 44.2 51.5 Extreme Poverty 12.0 7.2 11.6 Rural Areas Coast Poverty 63.4 52.8 64.4 Extreme Poverty 26.5 23.6 27.3 Highlands Poverty 64.7 68.1 65.5 Extreme Poverty 37.7 32.6 30.2 Tropical Jungle Poverty 70.1 64.9 69.2 Extreme Poverty 38.6 36.4 31.5
Source: ENNIV 1994, 1997 and 2000 Elaborated: IEP
References
Dancourt, O. y W. Mendoza (1994) “Agricultura y política de estabilización en el Perú, 1990-92” en Perú: El problema agrario en debate. SEPIA VI. Dancourt, O.; E. Mayer y C. Monge (eds.). Lima SEPIA-CAPRODA.
Escobal, J. (2000) “El gran ausente: el agro” en La reforma incompleta Abusada, R.; Du Bois, F.; Morón, E. y Valderrama, J. (eds.). Lima: Universidad del Pacífico e Instituto Peruano de Economía. pp. 173- 226.
Escobal, J. (1992) “Impacto de la política de precios y de crédito agrícola sobre la distribución del ingreso en el Perú: 1985-1990” Documento de Trabajo 19. Lima: GRADE
Hopkins, R. (1999) “El impacto del ajuste estructural en el desempeño agrícola” en
El Perú de Fujimori Lima: CIUP-IEP. pp. 151-179.
Trivelli, C. (2000) “Pobreza rural: Investigaciones, mediciones y políticas públicas” en Perú: El problema agrario en debate. SEPIA VIII. Hurtado, I.; C. Trivelli, y A. Brack (eds.). Lima: SEPIA.
Von Hesse, M. (2000) “Aspectos macroeconómicos” en Desafíos del Desarrollo
Rural en el Perú. Trivelli, C.; von Hesse, M.; Diez, A. y L. del Castillo. Colección