The Effect of Product Classifications on the
Formulation of Export Unit Value Indices: A
Comparison of Export Unit Value Indices based
on SITC and HS
著者
Kinoshita Soshichi
権利
Copyrights 日本貿易振興機構(ジェトロ)アジア
経済研究所 / Institute of Developing
Economies, Japan External Trade Organization
(IDE-JETRO) http://www.ide.go.jp
journal or
publication title
IDE Discussion Paper
volume
213
year
2009-08-01
INSTITUTE OF DEVELOPING ECONOMIES
IDE Discussion Papers are preliminary materials circulated
to stimulate discussions and critical comments
JEL classification: C43, F15
Keywords:
Export value indices, Export unit value indices, SITC Code, HS Code, Quality change adjustment* Professor emeritus of Nagoya University ([email protected])
IDE DISCUSSION PAPER No. 213
The Effect of Product Classifications on the
Formulation of Export Unit Value Indices:
A Comparison of Export Unit Value Indices
based on SITC and HS
Soshichi KINOSHITA*
August 2009
Abstract
With the globalization of economic activity, the relative weight of foreign trade in national economic activities has increased, and the question of how to measure trends in the value and quantity of international trade has become an important issue for policy-makers and economists. This paper compares the chain-linked indices formulated by Masato Kuroko, based on HS this fiscal year for individual industry categories and countries with chain-linked indices based on SITC-R1 codes, in order to study how changes in the quality composition of the same products, which cannot be considered using unit value indices based on SITC-R1 codes, can be considered using unit value indices based on the more detailed HS product classifications.
The Institute of Developing Economies (IDE) is a semigovernmental,
nonpartisan, nonprofit research institute, founded in 1958. The Institute
merged with the Japan External Trade Organization (JETRO) on July 1, 1998.
The Institute conducts basic and comprehensive studies on economic and
related affairs in all developing countries and regions, including Asia, the
Middle East, Africa, Latin America, Oceania, and Eastern Europe.
The views expressed in this publication are those of the author(s). Publication does not imply endorsement by the Institute of Developing Economies of any of the views expressed within.
INSTITUTE OF DEVELOPING ECONOMIES (IDE), JETRO 3-2-2, WAKABA,MIHAMA-KU,CHIBA-SHI
CHIBA 261-8545, JAPAN
©2009 by Institute of Developing Economies, JETRO
No part of this publication may be reproduced without the prior permission of the
IDE-JETRO.
Introduction
With the globalization of economic activity, the relative weight of foreign trade in national economic
activities has increased, and the question of how to measure trends in the value and quantity of
international trade has become an important issue for policy-makers and economists. In relation to
this issue, the United Nations Statistics Division has formulated manuals which provide standards
for measurement, and has also published a number of surveys and research reports.(Note 1)
Using international trade statistics formulated by the UN, the trade index project of the Institute of
Developing Economies organizes trade flows by individual product classifications and products in
addition to total value, and formulates indices for price and quantity by product classification and
product. In this type of procedure, it is necessary at the initial stage to achieve consistency between
the country codes and product codes used in the trade statistics of different countries, in order to
enable comparison of trade data (value and quantity) over a time series. Next, unit value indices and
quantity indices are formulated by product classification and product using the values and quantities
for the individual product codes which have been rendered consistent.
The characteristics and problems of the trade price indices formulated by the IDE’s trade index
project have already been studied.(Note 2) This paper will compare unit price indices formulated using
different product classification levels, and will consider problems related to product homogeneity
and the treatment of changes in quality.
1. Unit Price Indices and Price Indices as Trade Price Indices
The price data employed in the formulation of trade price indices can be divided into unit values and
survey prices. According to UN surveys, with the exception of a small number of countries, trade
price indices are formulated using unit values as trade prices. The main countries which use survey
products), and the US.(Note 3)
In Japan, the Ministry of Finance formulates trade price indices using unit values, and the Bank of
Japan publishes import and export price indices based on survey prices. Because the methods of
surveying prices and of calculating the indices differ, trends in both totals and individual
classifications do not necessarily match in these two sets of trade price indices.
When trade price indices are formulated based on survey prices, representative products are
specified and a price survey is conducted, with quality held constant and only changes in prices
being focused on. By contrast, the average price for each product (value÷quantity) in customs
statistics is used in the formulation of trade price indices based on unit values, and changes in price
and changes in quality are therefore both reflected in the price indices. Because of this, if there is a
simultaneous increase in prices and a change or increase in quality, price indices based on unit
values will overestimate the price increase by the amount of the increase in quality.
Clearly, to formulate price indices which reflect the true trends of trade prices, it would be most
desirable to calculate the indices on the basis of survey prices, for which homogeneous quality has
been maintained. However, the majority of countries actually formulate indices based on unit values.
The main reason for this is the fact that it is difficult to conduct price surveys for a large number of
products. Considering Japanese indices for base year 2000, we find that the unit values of
approximately 2,100 products were focused on to formulate export price indices based on customs
statistics, but only approximately 200 products were surveyed in the formulation of export price
indices by the Bank of Japan.(Note 4)
There is therefore a limit to the usefulness of trade indices based on survey prices as tools for
understanding trends in import and export prices at detailed classification levels, making it necessary
2. Problems of Unit Value Indices and Approaches to Their Resolution
When employing customs trade statistics, if there are no gaps in the statistics, quantity data can be
used together with value data for each classified product. With respect to value, Japanese statistics
are denominated in yen, while UN trade statistics are all expressed in US dollars, making
international comparison possible. The units of quantity employed are either kilograms or number;
the same units are employed for specific products by the vast majority of reporting countries. In
some cases, countries have employed kilograms up to a specific point in time, and have then made
the transition to number. In some cases also, quantity data is lacking for some countries.
Unit value indices for a classification j are calculated as follows when value (Vit) and quantity (qit)
are available for each product (i) classified in classification j:
UVIj=Σwji*(pit/pi0)
Here, UVIj is the unit value index for classification j, wji is the weighting of product i, pit is the
value of product i for year t, and pi0 is the value of product i for base year 0.
The problematic issue in the formulation of unit value indices is whether quality is homogeneous for
product i. When product i is a product group for which quality differs in detailed classifications,
changes in the unit values of product i reflect, in addition to changes in the unit values of detailed
classifications of the products, changes in the composition of the products within detailed
classifications encompassed by product i, i.e. changes in quality. This issue can be discussed as
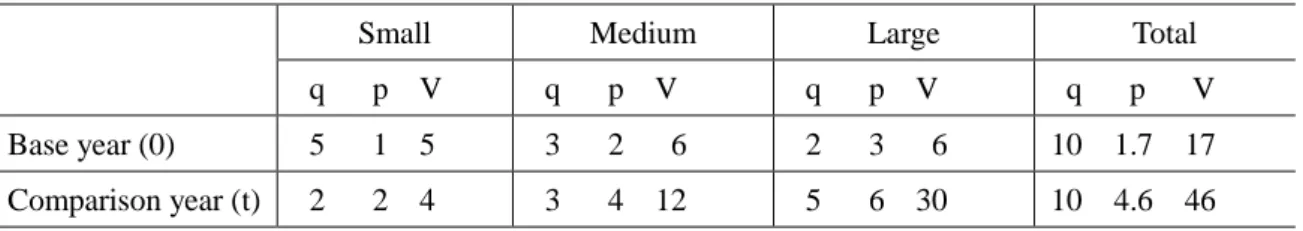
follows, using an example drawn from a UN report (Table 1). Here, q is quantity, p is unit value, and
Table 1 Hypothetical example: Value and quantity by size of refrigerators
Small Medium Large Total
q p V q p V q p V q p V Base year (0) 5 1 5 3 2 6 2 3 6 10 1.7 17 Comparison year (t) 2 2 4 3 4 12 5 6 30 10 4.6 46
Source: United Nations (1981), p.15
In terms of changes in unit value by refrigerator, what this shows is that for all sizes p(t)/p(0)=2 and
there is a 100% increase, but the unit value as totaled from the separate sizes is 4.6/2.71, or a 171%
increase. The unit value calculated for the total is 36% higher than the original unit value. This is
because the relative weight of high-cost products in the total export value of refrigerators has
increased.
One method of preventing this overestimation or underestimation of unit value indices is to employ
the most detailed possible trade product classifications. Considered in terms of the example above,
this would involve breaking the classification of refrigerators down into more detailed classifications
by size.
3. Characteristics of the IDE UN COMTRADE-based Indices
The IDE’s trade index project uses trade statistics based on SITC and HS drawn from the UN
COMTRADE database as basic data for the formulation of trade price indices. However, as Table 3
shows, the SITC has been revised three times since 1960, and the edition in use therefore differs
depending on the period under consideration. The HS has also been revised twice since 1988.
When using trade data organized by product as long-term time series data, it is therefore necessary to
achieve consistency between the different classification systems for the same products. In the UN
COMTRADE data, the product classifications for different revisions have been standardized by
whether Rev. 1, 2 or 3 is employed.
In the following discussion, IDE export unit value indices are SITC-R1 indices for all periods and
indices linking different classification standards from SITC-R2 to HS-2002, as formulated by
Masato Kuroko using COMTRADE data. These unit value indices cover 21 industry categories.(Note
5)
As for the product numbers for each classification standard, the approximately 1,300 products for
SITC-R1 increases to approximately 1,800 for R2 and approximately 3,000 for R3, and the greater
detail of classifications sees the number increase to approximately 5,000 for HS. Because of this,
comparison of series based on SITC-R1 and series based on HS can be considered to enable
clarification of the effect of changes in the composition of detailed level products which make up the
same category of products on changes in unit values. To take an example of one same category of
products, it is possible to analyze the effect of changes in the composition of passenger vehicle
classified by displacement on changes in the average unit values of passenger vehicles.
The indices formulated by Masato Kuroko for use in comparisons are therefore chain-linked indices
which are able to reflect time series changes in trade structure. The merit of chain-linked indices is
that the weighting is not fixed in the base year or the comparison year, enabling changes in the
export structure from the base year onwards to be reflected.
When chain-linked indices are formulated, weighted average indices are not calculated for the base
year. Instead, aggregate average indices are calculated for each year (with the base year as 100) by 1)
computing annual changes in the unit value for each item with the previous year as 100, 2)
aggregating them using the weights of previous year , and 3) multiplying these year-to-year change
4. Formulation of Export Unit Value Indices by HS Classification
This section will discuss changes in classification standards, products numbers, and coverage in the
formulation of indices for unit value indices based on SITC and HS formulated for the US, Europe,
and major Asia-Pacific countries including Japan.
4.1 Changes in Classification Standards in International Trade Statistics used in the
Formulation of Indices
The SITC, a classification system developed by the UN in 1950 for use in the formulation of trade
statistics, has undergone four revisions since its original publication, with Rev. 1 in 1962 and Rev. 4
in 2007. The HS, originally developed by the Customs Cooperation Council (now the World
Customs Organization) in 1988, has undergone two revisions, in 1996 and 2002. The IDE uses the
SITC revisions for periods in which the HS cannot be used, and uses HS series in place of the SITC
for periods for which it can be used. In this way, by using the most detailed classification standard
possible for product classifications, we are able to adjust the overestimation or underestimation of
export unit value indices when comparing them with export price indices.
Looking at the Table 4 on comparison of the classification standard by country, we find that HS can
be used from 2000 onwards for all 26 countries for which indices are formulated, but from 1990, this
figure is for only 13 countries, including Japan and Germany, countries which record high export
values. However, SITC-R3 series can be employed for some 3,000 products for the US and nine
European countries. From 1980-1989, SITC-R2 series are used for 22 countries.
It may therefore be considered most appropriate when comparing SITC-R1 and HS series to limit the
period for comparison to the period from 1995 onwards. This point should be borne in mind in the
following discussion, in which the period from 1980 onwards is divided into the 1980s and the
Table 2 Availability of SITC and HS by country
Rev.1 Rev.2 Rev.3 1988 1996 2002
1 JPN 62~76 77~88 89~96 97~02 03~05 479,249 2 USA 62~78 89~89 90~91 92~96 97~02 03~06 782,000 2 CAN 62~78 79~88 89 90~96 97~02 03~05 276,635 3 AUT 62~78 79~88 89~94 95~96 97~02 03~06 64,155 3 BEL 62~78 79~88 89~95 96 97~02 03~06 187,838 3 DEU 62~78 79~88 89~96 97~02 03~05 550,120 3 DNK 62~76 77~88 89 90~98 97~02 03~06 50,380 3 ESP 62~78 79~88 89 90~96 97~02 03~05 113,325 3 FIN 62~76 77~88 89~96 97~02 03~06 45,473 3 FRA 62~78 79~88 89~94 95~96 97~02 03~05 300,024 3 IRL 62~76 77~88 89~92 93~96 97~02 03~06 77,081 3 ITA 62~77 79~88 89~94 95~96 97~02 03~05 239,886 3 NLD 62~78 79~88 89~92 93~96 97~02 03~05 213,382 3 NOR 62~76 77~88 89~93 94~96 97~02 03~06 60,058 3 PRT 62~79 80~88 89~96 97~02 03~05 23,234 3 SWE 62~76 79~88 89~92 93~96 97~02 03~05 87,724 3 GBR 62~78 79~88 89~93 94~96 97~02 03~05 281,564 5 CHN 84~92 93~96 97~02 03~05 249,203 5 HKG 62~78 79~92 93 94~96 97~02 03~05 201,860 5 IDN 62~79 80~89 90~96 97~05 65,604 5 KOR 62~76 79~88 89~96 97~02 03~06 172,268 5 MYS 62~78 79~88 89 90~97 98~02 03~05 98,229 5 PHL 62~77 78~91 92~96 97~00 01~05 03~05 39,783 5 SGP 62~79 80~89 90~97 98~02 03~05 137,804 5 THA 62~76 77~89 90~99 00~02 03~05 68,962 4 AUS 62~79 79~88 89~96 97~02 03~05 63,870
SITC HS Export values (year
2000, million of US dollar) Area Country
Note: Area 1=Japan, 2=north America, 3=Europe, 4=Australia, 5=east Asia “Country” indicates ISO 3digit alphabetical country code. (Note 6)
4.2 Comparison of Export Product Organized by Category: Japan and the US
The product numbers in separate categories used in the formulation of Kuroko’s indices for the US
and Japan were organized for separate product classification standards. As a result, when product
numbers are compared for SITC and HS in Table 3, the HS-2002/SITC-Rev.1 ratios are 4.6 for
Japan and 6.0 for the US in all categories. For Japan, the multiplication factor of the product
Table 3 Product numbers in separate categories : Japan vs US a. Japan's exports Ratio R1 R2 1988 1996 2002 Agricultural products 46 54 133 113 119 2.6 Mine products 24 34 70 69 70 2.9 Foodstaffs 81 110 235 290 299 3.7 Textiles 90 128 500 518 532 5.9 Apparel 24 69 221 212 216 9.0 Leather products 21 21 74 76 85 4.0
Lumber and wood products 21 25 71 75 86 4.1
Paper and pulp 39 48 139 135 139 3.6
Rubber and plastics 13 18 65 69 85 6.5
Chemical products 189 253 811 840 849 4.5
Petrochemical products 15 18 26 30 23 1.5
Ceramics 51 53 137 137 133 2.6
Iron and steel 56 65 187 164 205 3.7
Non-ferrous products 41 47 118 125 147 3.6
Metal Products 61 64 250 262 220 3.6
Machinery 63 150 492 489 505 8.0
Electrical equipment and machinery 25 63 258 296 281 11.2
Transport equipment 27 34 109 116 112 4.1
Precision instruments 29 28 144 149 154 5.3
Miscellaneous manufactured products 45 47 166 134 131 2.9
Total 961 1329 4206 4299 4391 4.6 b. US exports Ratio R1 R2 R3 1988 1996 2002 Agricultural products 73 76 148 298 261 266 3.6 Mine products 35 34 46 110 112 110 3.1 Foodstaffs 103 101 247 403 448 453 4.4 Textiles 65 60 187 523 541 564 8.7 Apparel 17 56 67 244 244 245 14.4 Leather products 14 16 23 60 77 90 6.4
Lumber and wood products 11 4 29 62 69 73 6.6
Paper and pulp 26 49 77 138 147 149 5.7
Rubber and plastics 10 9 27 53 60 74 7.4
Chemical products 142 185 362 757 837 851 6.0
Petrochemical products 14 18 25 39 39 34 2.4
Ceramics 30 24 90 89 103 99 3.3
Iron and steel 41 31 153 193 171 211 5.1
Non-ferrous products 46 44 68 127 127 148 3.2
Metal Products 24 25 46 166 203 158 6.6
Machinery 27 73 260 388 403 416 15.4
Electrical equipment and machinery 13 29 100 172 238 219 16.8
Transport equipment 19 28 46 72 101 102 5.4
Precision instruments 12 27 36 69 73 72 6.0
Miscellaneous manufactured products 15 35 14 69 60 56 3.7
Total 737 924 2051 4032 4314 4390 6.0 HS2002/ SITC-R1 product numbers Product categories SITC HS SITC HS Product numbers HS2002/ SITC-R1 Product categories
plastics (RB), and the three machinery-related categories machinery (MC), electrical equipment and
machinery (EM) and precision instruments (PI). The total was eight for the US, adding leather
products (LT) and lumber and wood products (WD) in addition to the three categories already listed
for Japan in the light industry category, and substituting metal products (MT) for the PI listed for
Japan in the heavy industry category.
4.3 Coverage of Products by Category (Export Value-based): Japan and The US
As indicated above, the formulation of indices by category based on the HS offers the advantage of
significantly increasing the number of products employed. At the same time, it is also important that
the coverage rate for the numbers and values of the increased number of products is high for all
categories. Here, it is necessary to determine the coverage of both SITC-R1 and HS for the US and
Japan.
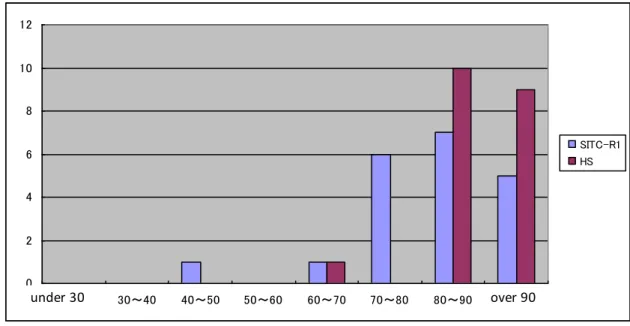
A comparison of the distribution of average values by coverage class for Japan and the US for the
period 1980-2005(6) is shown in figures 1. For Japan, except for a coverage of 60% for one category,
the coverage for the HS series for the remaining 19 categories is 80% or higher. These figures are
considerably higher than the figures for SITC-R1. In the case of the US, by contrast, for SITC there
are seven categories for which the coverage is 80% or more, but for HS, there are only eight. For
both HS and SITC-R1, there are seven categories for which coverage is less than 60%. While the US
has two less categories for which coverage is between 40-50% and two more categories for which
Figure 1 Distribution of sectoral average coverage of export values (1) Japan 0 2 4 6 8 10 12 30未満 30~40 40~50 50~60 60~70 70~80 80~90 90以上 SITC-R1 HS under 30 over 90 (2) USA 0 1 2 3 4 5 6 7 30未満 30~40 40~50 50~60 60~70 70~80 80~90 90以上 SITC-R1 HS over 90 under 30
5. Comparison of SITC-R1 Indices and HS Indices
The Kuroko indices have been formulated for 1962 to 2005(6); however, the comparison in this
paper is limited to 1980 onwards. One reason for this is that SITC-R1 is the classification from 1962
to 1977-1978, and this makes it impossible to measure the effect of increasing the detail of
classifications. Another reason is the fact that in the long-term time series from 1962 onwards,
indices for some countries are discontinuous, making comparison difficult. From the 1980s,
chain-linked indices for 20 industry categories can be used for almost all countries, making it
possible to conduct comparisons.
However, indices based on HS can only be formulated for early-adopting countries from 1989, and
for all remaining countries from 1995 onwards, and HS indices from 1980 onwards therefore contain
series based on SITC-R2 and SITC-R3. Because of this, comparisons between countries have been
divided into three time periods – 1980-1990, 1990-2000, and 2000-2005(6) – in order to study the
effect of increasing the detail of product classifications.
In comparing two indices, the quality index has been defined using the following formula, and the
annual average rate of change of this index has been employed.
Quality index = SITC-R1 indices / HS indices
5.1 Comparison by Industrial Category and Country: 1990 Onwards
Here, the rate of change of quality indices based on SITC-R1 will be compared by industry category
from 1990 onwards, a period in which the number of products by industry category increased
3-5-fold. 13 countries are compared, representing six Asian countries, the US, and six European
Figure 2 Quality changes of machinery-related sectors 1990-2005(2006) Machinery -3 -2.5 -2 -1.5 -1 -0.5 0 0.5 1 1.5
JPN CHA HKG SGP KOR MYS GER FRA UK ITA NLD BEL USA
Electorical equipment and machinery
-4 -3 -2 -1 0 1 2 3 4 5
JPN CHA HKG SGP KOR MYS GER FRA UK ITA NLD BEL USA
Transport Equipment and machinery
-7 -6 -5 -4 -3 -2 -1 0 1 2 3 4
Presision Instruments -6 -4 -2 0 2 4 6 8
JPN CHA HKG SGP KOR MYS GER FRA UK ITA NLD BEL USA
There were two countries for which 1% or more positive change occurred in the machinery category,
10 in the electrical equipment and machinery category, six in the transport equipment category, and
seven in the precision instruments category. Negative change of 1% or more was measured for four
countries in the machinery category, one country in the electrical equipment and machinery category,
three countries in the transport equipment category, and four countries in the precision instruments
category. In the machinery category, the increase in value due to the increase in quality in the
electrical equipment and machinery category was greatest.
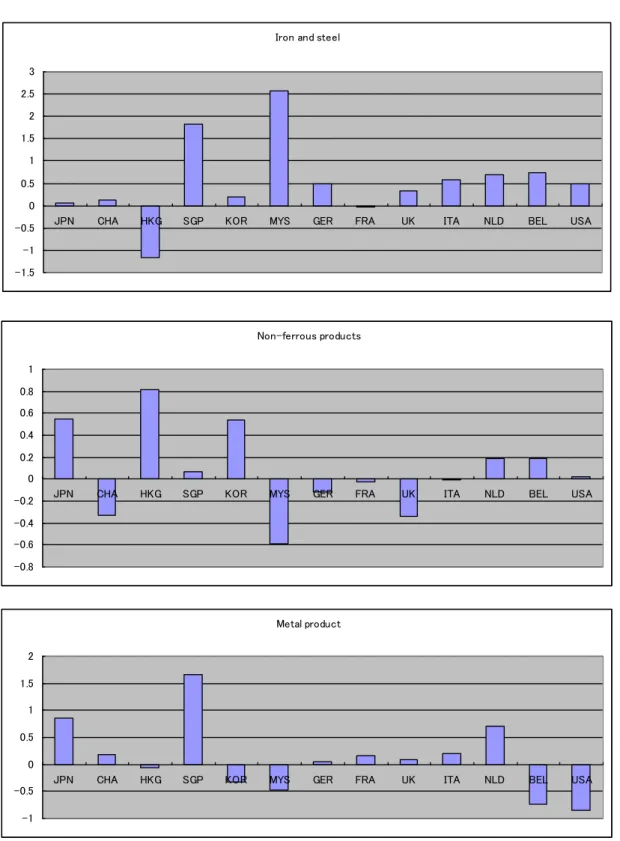
Comparing the metal-related categories next, we find in Figure 3 two countries with positive quality
changes of 1% or more in the iron and steel category, no countries in the non-ferrous metals category,
and one country in the metal products category. One country recorded negative change of 1% or
more in the iron and steel category, and no countries recorded negative change of 1% or more in the
non-ferrous metals or metal products categories. The change in quality in this these categories was
extremely low in comparison to the machinery categories.
The results of remaining categories were summarized as follows:
Figure 3 Quality changes of metal-related sectors: 1990-2005(2006)
Iron and steel
-1.5 -1 -0.5 0 0.5 1 1.5 2 2.5 3
JPN CHA HKG SGP KOR MYS GER FRA UK ITA NLD BEL USA
Non-ferrous products -0.8 -0.6 -0.4 -0.2 0 0.2 0.4 0.6 0.8 1
JPN CHA HKG SGP KOR MYS GER FRA UK ITA NLD BEL USA
Metal product -1 -0.5 0 0.5 1 1.5 2
displaying negative change of 1% or higher.
Mining: 10 countries were measured as displaying positive change of 1% or higher, of which six
countries displayed positive change of 2% or higher.
Foodstuffs: 8 countries displayed positive change, but only 1 displayed change of 1% or more. Four
countries displayed negative change, of which 2 displayed change of 1% or higher.
Textiles: Seven countries displayed positive quality change, of which two displayed change
exceeding 1%.
Apparel: Four countries displayed positive change, of which one country displayed change of 1% or
higher.
Leather products: Eight countries displayed positive change, of which four displayed change of 1%
or higher.
Lumber and wood products: 11 countries displayed positive quality change, of which four displayed
change of 1% or higher.
Paper and pulp: 10 countries displayed positive quality changes; three Asian countries displayed
positive quality changes of 1% or higher.
Rubber and plastics: Eight countries displayed positive quality changes, with three countries
displaying quality changes of 1% or higher.
Chemical products: Five countries displayed positive quality changes, and eight countries displayed
negative quality changes. Two countries displayed a rate of change of 0.5% or higher including
positive and negative change.
Petroleum and coal products: Three countries displayed positive quality change, with one country
displaying positive change of 1% or higher. Of 10 countries displaying negative quality change,
seven displayed change of 1% or higher.
of 1% or higher. Negative quality change was 1% or less.
5.2 Comparison by Country and Industry Category (1): Japan and the US
This section will discuss the quality changes for Japan and the US when quality changes are
measured for separate periods for whole world and for important regions.
First, we will discuss the results of Japanese exports to the whole world.
As shown in Table 4, eight categories of a total of 19 displayed positive quality change for the
1980s; from 1990 onwards, this figure increased to 17. In addition, if the period from 1990 onwards
is divided into the 1990s and the 2000s, 13 categories display positive quality change for each period.
Of these, four categories, mining, foodstuffs, leather products, and metal products, display a quality
increase of 1% or higher for the 1990s, while eight categories, agricultural, forestry and fisheries
products, mining, apparel, leather products, paper and pulp, ceramics, transport equipment, and
precision instruments, display a quality increase of 1% or higher for the 2000s.
Table 4 Japan's quality changes in exports by sector; Exports to the world
Product categories T(80-90) T(90-00) T(00-05) T(90-05) Agricultural products -0.31 -0.28 3.62 1.00 Mine products -2.01 1.96 7.47 3.77 Foodstaffs -0.36 1.69 -1.79 0.52 Textiles 0.37 0.74 0.74 0.74 Apparel -0.27 -0.79 3.15 0.51 Leather products 1.00 6.96 3.07 5.65
Lumber and wood products -0.86 0.32 -0.25 0.13
Paper and pulp 2.05 -0.65 2.92 0.52
Rubber and plastics -0.61 0.75 -0.99 0.17 Chemical products 0.36 -0.60 0.51 -0.23
Petrochemical products 1.40 0.19 -4.20 -1.29
Ceramics 0.18 0.86 2.22 1.31
Iron and steel -0.44 -0.05 0.27 0.05 Non-ferrous products -0.17 0.76 0.14 0.55
Metal Products -0.16 1.46 -0.35 0.85
Machinery -1.04 0.14 0.56 0.28
Electrical equipment and machinery 1.24 0.52 -0.61 0.14 Transport equipment 0.70 0.44 1.11 0.66
Precision instruments -3.50 0.55 2.87 1.32
Number of positive sector 8 13 13 17
Max 2.05 6.96 7.47 5.65
Table 5 shows quality changes measured by the unit value of exports to the entire world for the four
machinery-related categories divided by export market (North America, the EU, and Asia).
Table 5 Rate of Quality Change for Japan by Export Market: 4 Machinery Categories
North
America EU East Asia World
North
America EU East Asia World
Machinery 0.72 -0.01 0.33 0.14 1.55 0.59 1.25 0.56
Electrical equipment and machinery 0.42 1.26 0.79 0.52 -2.67 1.71 -0.63 -0.61
Transport equipment 1.63 -0.03 -3.66 0.44 1.18 2.28 0.89 1.11
Precision instruments 0.79 1.88 -1.93 0.55 5.01 1.25 4.86 2.87
1990-2000 2000-2005
Product categories
Source: Calculated from indices formulated by Kuroko.
Looking at the 1990s, the greatest rate of increase in quality in the machinery category occurred in
the North America, in the electrical equipment and machinery category in the EU, in the transport
equipment category for North America, and in the precision instruments category in the EU. For the
2000s, the greatest rate of quality increase occurred in the machinery and the precision instruments
categories for North America, and in the electrical machinery and transport machinery categories for
the EU. Asia recorded the second highest rate of increase in quality after North America in the
machinery and precision instruments categories. Looking at the whole world, excepting electrical
equipment and machinery, the rate of quality increase was higher for the 2000s than for the 1990s.
We will now look at Table 6 showing the detailed results for North American exports to the whole
world.
For the 1980s, 10 industry categories out of 19 recorded positive quality changes for exports; this
figure increased to 14 from 1990 onwards. From 1990 onwards five industry categories recorded
positive quality increases of 1% or higher, as follows: mining, leather products, petroleum and coal
products, transport equipment, and precision instruments. If the period from 1990 onwards is divided
Table 6 US quality changes in exports by sector; Exports to the world Product categories T(80-90) T(90-00) T(00-06) T(90-06) Agricultural products 0.47 0.63 -0.13 0.35 Mine products 0.13 -1.00 10.13 3.04 Foodstaffs 0.08 -0.09 -0.69 -0.31 Textiles 0.36 -0.30 -0.27 -0.29 Apparel -0.49 0.57 -4.97 -1.54 Leather products 1.39 -3.17 10.43 1.72
Lumber and wood products -0.08 -1.23 2.86 0.28
Paper and pulp 0.09 0.19 0.46 0.29
Rubber and plastics 6.69 1.68 -0.49 0.86
Chemical products -0.77 0.45 -0.43 0.12
Petrochemical products -1.23 3.51 0.94 2.54
Ceramics -0.34 -1.17 -0.05 -0.75
Iron and steel -2.84 0.99 -0.30 0.50
Non-ferrous products -0.12 0.01 0.05 0.02
Metal Products 2.24 -0.32 -1.74 -0.85
Machinery 1.67 0.93 -0.02 0.57
Electrical equipment and machinery -0.24 -2.55 5.03 0.23
Transport equipment -1.68 1.93 -0.34 1.07
Precision instruments 5.39 -1.13 11.11 2.22
numbers of positive sector 10 10 8 14
Max 6.69 3.51 11.11 3.04 Min -2.84 -3.17 -4.97 -1.54
For the 1990s, three industry categories, rubber and plastics, petroleum and coal products, and
transport equipment were measured as displaying a quality increase of 1% or higher; for the 2000s, 5
categories, mining, leather products, paper and pulp, electrical equipment and machinery, and
precision instruments, displayed an increase of 1% or higher.
For North America in the 1990s, for the machinery-related categories, when changes in quality are
compared by export market, the greatest rate of change of quality is recorded for Canada in the
machinery category, for Asia in the electrical equipment and machinery category, for the EU in the
transport equipment category, and for Japan in the precision instruments category. For the 2000s, the
rate of increase is highest for machinery category in the EU and for transport equipment and
Japan as export market. (See Table 7).
Table 7 Rate of Quality Change for North America by Export Market: 4 Machinery Categories
Japan EU Asia North
America Japan EU Asia
North America
Machinery 0.17 -0.30 0.63 1.65 -6.11 2.01 0.87 0.44
Electrical equipment and machinery -1.25 -1.86 4.70 -2.72 -1.62 -0.07 -0.89 -0.90
Transport equipment -2.85 1.50 0.70 0.01 -3.86 -0.18 6.22 0.46
Precision instruments 2.10 0.75 -4.08 0.91 -11.34 -15.51 3.21 -21.10 Product categories
1990-2000 2000-2006
Note: Calculated from indices formulated by Kuroko.
5.3 Comparison by Country and Industry Category (2): Asian Region
Quality indices were calculated for 8 countries in the Asian region (excluding Japan) for 19 industry
categories.
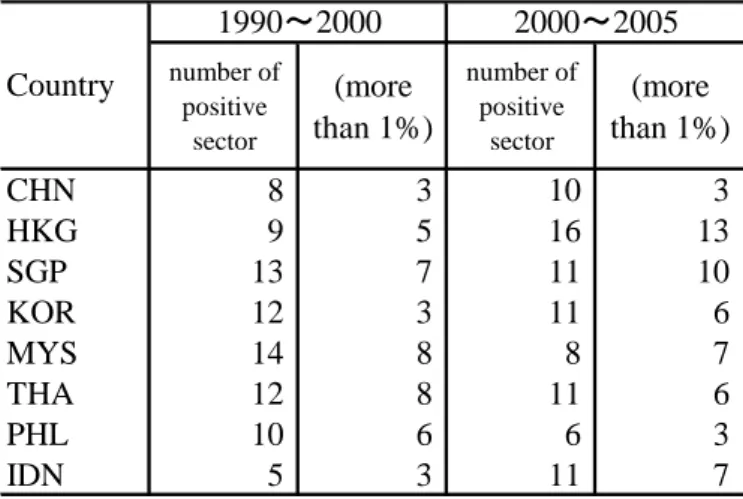
Looking first at quality changes for the 1990s and the 2000s when the period from 1990 onwards is
divided into two. As shown in Table 8, for the 1990s five countries including Singapore recorded
positive changes in 10-14 industry categories, and for these (excluding South Korea), six-eight
categories displayed an annual rate of change of 1% or higher.
Table 8 Export quality changes of 19 sectors
number of positive sector (more than 1%) number of positive sector (more than 1%) CHN 8 3 10 3 HKG 9 5 16 13 SGP 13 7 11 10 KOR 12 3 11 6 MYS 14 8 8 7 THA 12 8 11 6 PHL 10 6 6 3 Country 1990~2000 2000~2005
For the 2000s, six countries and areas including Hong Kong record positive change in 10-16
categories, with change greater than 1% in 13 categories and 10 categories for Hong Kong and
Singapore respectively.
Next, we will examine the characteristics of these quality changes for each important category..
Looking at results for the four machinery-related categories in Table 9, we find that for machinery,
for the 1990s, South Korea and four ASEAN nations displayed positive change, with the highest rate
of increase recorded by Malaysia at 9.5%. For the 2000s, positive change was displayed only by
China and Hong Kong, with the figure highest for Hong Kong at 2.2%.
Table 9 Quality changes of machinery-related sectors
90~00 00~05 90~00 00~05 90~00 00~05 90~00 00~05 CHN -1.16 0.18 1.26 2.07 -0.46 0.15 -2.62 -6.88 HKG -5.36 2.21 0.63 4.80 1.25 5.08 -0.33 6.18 SGP -1.54 -4.38 1.21 6.11 -7.92 1.74 4.98 3.34 KOR 1.62 -0.12 0.20 2.78 0.64 2.35 -0.99 9.30 MYS 9.50 -13.30 1.16 5.60 -6.06 -6.49 8.69 2.58 THA 1.65 -5.06 4.29 14.63 -3.44 2.53 -5.75 2.73 PHL 2.58 -3.07 -1.16 7.97 -0.89 6.18 -6.13 -16.25 IDN 5.65 -2.93 -0.93 0.79 0.24 -1.02 -1.13 10.39 max 9.50 2.21 4.29 14.63 1.25 6.18 8.69 10.39 min -5.36 -13.30 -1.16 0.79 -7.92 -6.49 -6.13 -16.25 Country (% per year) Machinery Electrical machinery Transport equipment Precision instruments
Excluding the Philippines, for electrical equipment and machinery all countries displayed positive
change from 1990 onwards. However, the rate of increase was higher for all countries in the 2000s
than in the 1990s. The rate of increase in quality was particularly marked in the case of Thailand.
For transport equipment, Hong Kong displayed the highest rate of increase in the 1990s, at 1.25%.
Other countries all displayed positive or negative change of 1% or below. In the 2000s, by contrast,
Only Malaysia and Indonesia displayed negative change.
For precision instruments, Singapore and Malaysia displayed positive change of 2% or higher for
both periods. Of the other countries, China, the Philippines, and Indonesia displayed negative change
for both periods.
For the three machinery-related categories excluding machinery, the increase in quality was greater
for the 2000s.
Looking at results for other categories shown in Table 10, we find that positive change was
displayed by China, Hong Kong, and Indonesia in the agricultural, forestry and fisheries for both
periods. The greatest rate of increase in quality was displayed by Malaysia in the former period and
by Indonesia in the latter period. In the lumber and wood products category, China, Hong Kong, and
Singapore displayed positive change for both periods, with the highest rate for China and Hong
Kong at approximately 2.6% for the former period, and the highest rate for Singapore at 4.56% for
the latter period. Finally, for the ceramics category, both Singapore and Thailand displayed positive
change for both periods, with Singapore displaying the greatest increase for both periods. For the
latter period, Hong Kong, Singapore, Thailand, and Indonesia displayed quality increase rates of 2%
or higher.
Table 10 Quality changes of agriculture and others
90~00 00~05 90~00 00~05 90~00 00~05 CHN 0.80 0.55 2.61 1.63 -0.86 -0.18 HKG 0.82 2.82 2.59 1.18 -0.53 2.73 SGP -3.09 3.25 0.88 4.56 5.02 3.72 KOR -3.34 -1.61 0.64 -0.56 -0.66 2.27 MYS 2.05 -1.28 -1.34 -4.99 2.82 -0.21 THA -1.88 1.25 -0.38 -1.86 0.84 2.84 PHL 1.14 -1.02 0.91 -2.49 -5.98 -0.99 IDN 0.66 4.37 -0.05 -0.34 -0.31 3.43 max 2.05 4.37 2.61 4.56 5.02 3.72 min -3.34 -1.61 -1.34 -4.99 -5.98 -0.99 (% per year) Agriculture Wood and its product Non-metallic minerals Country
5.4 Comparison by Country and Industry Category (3): The European Region
First, we will consider the distribution of positive quality changes by industry category for the 1990s
and the 2000s for 13 countries including Germany. Table 11 shows the summary results.
For the 1990s, 11 countries, excluding the UK and Denmark, displayed positive change in 10
industry categories or more. By contrast, only four countries – Germany, France, Italy, and Spain –
displayed positive change in 10 industry categories or more for the 2000s. For the 1990s, Germany,
Belgium, and Norway displayed an increase in quality of 1% or higher in either 0 or 1 industry
category, while the figure was 7-8 categories for Holland and Spain. For the 2000s, Denmark,
Norway, and Finland recorded quality increases of 1% or higher in three industry categories or less,
while the remaining countries recorded increases of 1% or higher in 4-6 categories.
Table 11 Quality changes of 19 sectors number of positive sector (more than 1%) number of positive sector (more than 1%) DEU 11 0 11 4 FRA 14 4 10 5 GBR 8 4 8 6 ITA 14 4 14 5 NLD 15 8 9 4 BEL 14 1 4 4 ESP 13 7 11 5 POL 10 4 9 2 DNK 6 2 8 4 SWE 11 4 9 4 NOR 10 1 9 3 FIN 10 2 5 2 AUT 11 5 9 5
Next, we will compare the change in quality indices for the four machinery-related categories, as in
the case of Asia.
change for machinery for the 1990s, and the change was 1% or less in each case. In the 2000s, the
number of countries recording positive change increased to seven, with the highest rate recorded by
the UK at 3.09%.
Table 12 Quality changes of machinery-related sectors
90~00 00~05 90~00 00~05 90~00 00~05 90~00 00~05 DEU -0.46 2.53 0.71 4.06 0.61 0.54 0.30 2.81 FRA -0.16 0.44 2.06 0.41 0.62 1.00 -1.99 1.12 GBR -3.50 3.09 -4.83 1.65 2.29 -0.68 -0.87 2.50 ITA -0.25 0.04 1.12 2.27 0.82 3.14 -0.43 1.16 NLD -0.53 -2.93 3.51 6.19 3.02 -0.62 1.42 -6.74 BEL 0.56 -1.07 0.35 6.09 -0.19 -3.49 -1.57 -2.07 ESP -0.92 1.17 0.07 -0.78 0.87 1.62 -0.69 1.37 POL -0.22 0.74 1.24 1.44 4.52 3.43 3.37 -8.14 DNK -0.81 -1.39 0.49 -1.39 -0.35 0.41 -1.49 10.29 SWE 0.04 -0.66 5.66 -3.19 0.12 -0.48 0.10 5.00 NOR -3.83 0.17 -0.56 -2.43 0.84 -0.74 0.05 0.31 FIN 0.64 -5.72 2.26 -5.89 1.52 -2.36 -0.86 -0.94 AUT -0.30 -4.66 1.27 -3.28 -0.51 1.88 -1.12 -5.21 max 0.64 3.09 5.66 6.19 4.52 3.43 3.37 10.29 min -3.83 -5.72 -4.83 -5.89 -0.51 -3.49 -1.99 -8.14
Country Machinery Electrical machinery Transport equipment Precision instrument
For electrical equipment and machinery, 11 countries, excluding the UK and Norway, all recorded
positive change in quality, with Sweden recording the highest increase at 5.66%. For the 2000s, the
number of countries recording positive change declines to seven, with Germany, Holland, and
Belgium recording increases of 4% to more than 6%. Of the five countries which recorded positive
change for both periods, the rate of increase of quality indices increased in the 2000s for Germany,
Italy, Holland, and Belgium, but not for France.
For transport equipment, the number of countries recording positive change declines from 10 for the
1990s to seven for the 2000s. For the 1990s, four countries, the UK, Holland, Portugal, and Finland,
more in the 2000s, this time Italy, Spain, Portugal, and Austria. Portugal is conspicuous here,
recording the highest rate of increase for both periods, at levels from 3 to more than 4%.
For precision instruments, five countries, Germany, Holland, Portugal, Sweden, and Norway, display
positive change for the 1990s; of these, Holland and Portugal display change of 1% or higher. The
number of countries displaying positive change increases to eight for the 2000s, with seven countries
recording positive change of 1% or higher, including Denmark at 10.29%.
Considering the machinery-related categories as a whole, the increase in quality was greater for the
2000s than for the 1990s.
Looking next at the three metal-related categories, changes in quality by country from 1990 onwards
were shown in Table 13.
Table 13 Quality changes of metal-related sectors
90~00 00~05 90~00 00~05 90~00 00~05 DEU 0.45 0.54 -0.12 -0.10 0.06 0.03 FRA -1.21 2.36 0.06 -0.16 0.11 0.27 GBR 0.65 -0.30 -0.20 -0.61 0.87 -1.44 ITA 0.51 0.73 -0.32 0.61 0.16 0.26 NLD 0.67 0.76 0.40 -0.22 0.89 0.33 BEL 0.08 1.85 0.38 -0.11 -1.10 -0.11 ESP 0.43 0.70 1.66 5.78 -0.24 -0.49 POL -0.09 -0.74 -0.36 -0.52 -0.75 0.72 DNK 0.02 -1.90 -1.25 -0.16 -0.84 0.70 SWE -0.40 -1.05 -1.09 0.64 0.99 0.49 NOR 0.44 1.07 -1.51 -0.32 0.03 0.03 FIN -0.71 -0.61 0.53 0.11 0.07 2.44 AUT 0.84 -0.20 0.10 0.01 0.49 0.59 max 0.84 2.36 1.66 5.78 0.99 2.44 min -1.21 -1.90 -1.51 -0.61 -1.10 -1.44 Iron-steel Nonferrous metal Metal products Country
For the iron and steel category, France, Belgium, and Norway recorded positive change of 1% or
higher for the 2000s. All other countries recorded either negative or positive change of 1% or less for
both the 1900s and the 2000s. For non-ferrous metals, excepting Spain, five-six countries recorded
in quality of 1.66% for the 1990s and 5.78% for the 2000s. For metal products, the only countries
which recorded a change in quality of 1% or more were Sweden for the 1990s and Finland for the
2000s. Overall, the measured quality changes in the metal-related categories can be judged as being
low.
Last, we will examine the characteristics of quality changes in light-industry categories, namely textiles, apparels and leather products by country. The result is shown in Table 14.
For textiles, the countries with positive quality change from 1990 onward are Netherlands and Spain for the 1990s and Italy and Spain for the 2000s. The 2000s saw nine countries with negative changes, four of which record more than 3%.
For apparel, only two countries, UK and Belgium recorded positive changes of more than 1% in the 1990s. For the 2000s, Belgium showed positive change of 10%, while negative changes of more than 3% were recorded in five countries, Germany, UK, Spain, Finland and Austria.
For leather products, in the 1990s, countries with quality changes of more than 1% are Netherlands, Spain and Sweden. Remaining countries recorded positive change of less than 1% or negative change. For 2000s, significant positive changes were recorded for France (3.2%) and Austria (5.2%). Remaining countries showed characteristics similar to the case of textiles.
Table 14 Quality changes in exports of light industry sectors
90~00 00~05 90~00 00~05 90~00 00~05 DEU 0.88 -1.53 -0.53 -13.07 0.08 -2.21 FRA -0.09 -0.39 1.19 -1.64 -0.52 3.20 GBR -1.23 -0.99 -2.90 -7.16 -1.85 0.84 ITA 0.36 1.31 -0.53 0.16 -0.19 -0.98 NLD 1.42 1.57 1.23 -0.42 1.76 -0.23 BEL -1.18 -3.36 0.36 10.61 0.50 -1.77 ESP 1.89 -3.04 0.95 -3.22 2.00 -1.49 POL 0.05 0.01 0.59 0.52 -1.35 -6.33 DNK -0.27 -7.24 -3.19 -2.40 -2.32 -0.99 SWE -0.43 0.35 -0.49 1.29 1.73 0.10 NOR 0.38 -1.04 -0.06 -0.85 -0.90 -1.61 FIN 0.23 -1.77 -1.35 -11.28 -0.22 -3.94 AUT 0.16 -4.98 -0.28 -5.76 -1.69 5.17 max 1.89 1.57 1.23 10.61 2.00 5.17 min -1.23 -7.24 -3.19 -13.07 -2.32 -6.33 Textile Apparel Leather product
6. Conclusion
In the preceding discussion, we have compared unit value indices formulated based on SITC-R1 and
the ones based on HS for the period from 1980 onwards by industry category and country, in order to
study the effect of differences in the digit level of product classifications on export unit value indices.
Comparison of unit value indices based on SITC-R1 which incorporate the effect of increases in
quality (more advanced functions, increased size, etc.) for the same products with indices based on
HS, which are able to adjust the effect, has shown that the former indices tend to be overestimated
for certain industry categories and certain countries.
Of course, the HS indices used here have been based on the UN 6-digit standard; if indices based on
the 9-digit codes used by reporting countries were used, it would have been possible to formulate
indices closer to genuine price indices.
In relation to the interpretation of the results of this study, it will be necessary to engage in further
study as to whether the cases in which negative change occurs in quality indices can be regarded
simply as declines in the quality of the products.
Footnote
1 See United Nations (1981), (1991), (2003).
2 Kinoshita (2003) compared for Japan, the US, South Korea and Taiwan the fixed-weighted
export unit value indices compiled by IDE with export price indices of those four countries and
region. Next, Kinoshita (2005) compared fixed weighted unit value indices with chain-weighted
ones sector by sector for Japan, the US and four East Asian countries and region, and concludes
superiority of chain-weighted indices over fixed weighted indices. Further, Kinoshita (2008)
computed SITC five digit unit value indices and HS nine digit indices(nine digit) for Japan’s
3 United Nations (2003) made a survey on compilation of external trade index to member
countries and summarized the reports from 77 countries in the following items; namely index
number series produces, source of information, index calculation methods, release dates, revision
policy, dissemination and compiling agency.
4 Trade price indices by Ministry of Finance cover the commodities with the share of more
than 1/100,000 of total exports or imports of base year and the transaction of 32months over 36
months during the three year centering the base year. Base year changes every five year from 1985
and Fisher formula index. On the other hand, Bank of Japan index covers the commodities with the
share of 5/10,000, and Laspeyres formula is used changing the base year every five year.
5 Kuroko (2009) reports the results of HS unit value indices of export and imports by sector
for the period from 1962 to 2005(2006). Areas covered are 25 countries and region including nine
East Asia, North America and Europe.
6 JPN=Japan, USA=United States, CAN=Canada, AUT=Austria,
BEL=Belgium-Luxembourg (1962-1998) and Belgium (1999-), DEU=Former Federal Republic of
Germany (1962-1990) and Germany (1991-), DNK=Denmark, ESP=Spain, FIN=Finland,
FRA=France, IRL=Ireland, ITA=Italy, NLD=Netherlands, NOR=Norway, PRT=Portugal,
SWE=Sweden, GBR=United Kingdom, CHN=China, HKG=Hong Kong, IDN=Indonesia,
KOR=Korea, MYS=Malaysia, PHL=The Philippines, SGP=Singapore, THA=Thailand,
References
Kinoshita, Soshichi (2003), “Calculation of Trade Price Indices by Commodity and Characteristics
of Results: A Comparative Analysis of Taiwan, South Korea, the US and Japan”, in
Noda、Yosuke eds., Compilation and Application of Trade Indices: in East Asian Countries
and Regions, Institute of Developing Economies
Kinoshita, Soshichi (2005), “On the Estimation and Properties of Sectoral Export Unit Value
Indices: Focusing on Fixed-weighted and Chain-weighted Indices of IDE,” in Noda,
Yusuke (eds.), Trade Indices in East Asian Countries and Regions: Basic Subjects from
Compilation to Application, IDE
Kinoshita, Soshichi (2007), “On the Co-movement of Sector Export Prices by Country in the World
Market: An Approach by Principal Component Analysis,” in Noda, Yusuke and Kuroko
Masato ed., Trade0related Indices and Trade Structure, IDE
Kinoshita, Soshichi (2008), “On the Effects of Commodity Classification on the formulation of
Export Unit Value Indices: Comparison of Export Unit Value Index of Transport
Equipment based on SITC and HS,” Noda, Yusuke et al. Comparative Analysis of Trade
related Indices (in Japanese), IDE
Kuroko, Masato(2005), “Calculation of Trade Indices based on UN COMTRADE data Connected
by SITC-RI,” in Noda, Yusuke eds., Trade Indices in East Asian Countries and Regions:
Basic Subjects from Compilation to Application, IDE
Kuroko, Masato (2009), “Compilation of Trade Indices Using UN Comtrade Data Based on SITC
and HS,” in Noda, Yusuke et al., Trade Indices and Change of Trade Structure, IDE
Dridi, Jemma and Kimberly Zieschang (2004), “Export and Import Price Indices,” IMF Staff Papers,
Vol.51, No.1
Misrepresent Price Indices,” IMF Staff Papers WP/07/121
United Nations (1981), Strategies for Price and Quantity Measurement in External Trade – A
technical report, Statistical Papers, series M, no.69
United Nations (1991), Methods used in Compiling the United Price Indices for External Trade, Vol.
II, Statistical Papers, series M, no.82
United Nations (2004), National Practices in Compilation and Dissemination of External Trade