Research Productivity in the Japanese Pharmaceutical Industry
-Economies of Scale, Economies of Scope and Spillovers-
Yosuke Okada
†, Akihiro Kawara
‡†
Graduate School of Economics, Hitotsubashi University Office of Pharmaceutical Industry Research
‡
Office of Pharmaceutical Industry Research
OPIR Research Paper Series No.15 February 2004
Research Productivity in the Japanese Pharmaceutical Industry
-Economies of Scale, Economies of Scope and Spillovers-
*Abstract
We examine the relationship between firm size and research productivity in the Japanese top ten pharmaceutical firms for the years 1981-1994. By using the number of successful patents as research performance measure, we find significant returns to scope in drug discovery research. We also find nearly constant returns to scale at the individual therapeutic level. These findings suggest that Japanese pharmaceutical firms are relatively small in terms of research scope, regardless of firm size per se. The Japanese firms may be able to enlarge the scope of research without suffering from marginal productivity decline at the firm level. Concerning knowledge spillovers, we find positive correlation between domestic competitors’ research spending and individual firm’s patenting. But we detect negative correlation between research expenditures of large western pharmaceutical firms and the Japanese firms’ patenting. This suggests that appropriation mechanism of patent may be very effective in drug discovery research, and may predominate over probable knowledge spillovers among pharmaceutical firms especially in globally patented drug discovery research.
JEL classification: L65, O31, O30
Correspondence: Yosuke Okada
Graduate School of Economics Hitotsubashi University
Naka, Kunitachi, Tokyo, 186-8601, Japan
E-mail: [email protected]
*We are grateful to helpful comments from Akira Goto, Sadao Nagaoka, Takanobu Nakajima, Hiroyuki
Odagiri, Kojiro Sakurai, Yoshindo Takahashi, Mitsuo Yashiro and other seminar participants at Hitotsubashi University, Kyushu University, Development Bank of Japan, the Institute of Developing Economies, and the Office of Pharmaceutical Industry Research. We would like to thank to Hiroyuki Hirai for superb research assistance. A lot of pharmaceutical researchers giving us beneficial opportunities of field interviews are greatly acknowledged. Financial support was provided by the Ministry of Education, Culture, Sports, Science and Technology for the 21st Century COE Program (Normative Evaluation and Social Choice of Contemporary Economic Systems, Hitotsubashi University) and the Japan Pharmaceutical Manufacturers Association (JPMA). The conclusions and opinions expressed herein are our own, and all errors and omissions remain our sole responsibility.
1. Introduction
Recent M&A movement among western large pharmaceutical firms has made the Japanese counterparts look relatively smaller and smaller. What the extent returns to scale in pharmaceutical research are important? What are the main determinants of scale effect? The purpose of the present study is to clarify the determinants of returns to scale in drug discovery research in Japanese pharmaceutical industry. By using the number of successful patents as a performance measure, we explore the extent of scale economies, scope economies and knowledge spillovers as the determinants of research productivity.
Previous studies emphasize that patent is a very important appropriation tool in pharmaceutical research (Mansfield et al., 1981; Mansfield, 1986; Levin et al., 1987; Klevorick et al., 1995; Cohen et al., 2002). Almost all product patents which include patent claims to new chemical entities (NCEs) are filed as soon as promising chemical compounds are found. Costly clinical trials commence after priority of patents are secured. Therefore patent is arguably an appropriate measure of research productivity in drug discovery research.
Drug discovery and drug development have distinct features in terms of cost structure
and stage-specific skill. As for drug discovery research, the goal is to find new chemical compounds from numerous targets and find drug leads which may have desirable effects. On the other hand, the main purpose of development research is to further screen drug candidates through lead optimization, development, clinical trials and regulatory approvals to ensure that screened compounds are safe and effective. It takes around 10 to 18 years to advance a drug candidate to regulatory approval in Japan (JPMA, 2003).
Because of the lengthy gestation period and the fact that the period is increasing, average development cost per NCE has increased dramatically. Total development cost is estimated to increase at an annual rate of 7.4% above general price inflation (DiMasi et al., 2003). The reasons appear to be higher clinical trail costs, the adoption of expensive new technologies, and that “firms are focusing development more on treatments for chronic and degenerative diseases, which typically require longer and more expensive testing” (DiMasi et al. 1991, p.133). Another possible reason would be the strengthened regulation of clinical practice such as Good Clinical Practice (GCP) after the thalidomide disaster in the late 60s and the SMON tragedy in the early 70s in Japan.
Cost per successful NCE tends to be very high because the cost of compounds that fail should be included in the cost (Danzon et al., 2003). Pharmaceutical R&D is subject to a very low success rate. Only a small portion of R&D projects actually contributes to firm’s profitability (Grabowski and Vernon, 1994). The cost of drug development from pre-clinical stage to regulatory approval is especially high, which is estimated to be 30 to 50 billion yen per NCE in Japan (Yamada, 2001). The portion of drug development cost to total R&D expenditure
is more than 50 percent in Japan (JPMA, 2003). The average pre-tax out-of-pocket cost per new drug in the US is estimated to be 403 million dollars and capitalizing out-of-pocket costs to the point of marketing approval at a real discount rate of 11% yields a total approval cost estimate of 802 million dollars (DiMasi et al., 2003).
On the other hand, a drug discovery research is an intrinsically scientific activity. Therefore the extent of returns to scale and appropriate boundary of a firm’s research activity
are not very certain1. Multiple research projects are usually in progress concurrently in which
resource spending levels are considerably different among them (Henderson and Cockburn, 1996). Furthermore, technological opportunities are different among therapeutic areas. Note that the distribution of average returns to R&D projects is highly skewed (Grabowski and Vernon, 1994). Therefore, the very long and risky research process makes it very important for pharmaceutical firms to make appropriate decisions to go or stop a research project in order to maximize the option value as a whole.
As Cockburn and Henderson (2001-b, p.1034) suggested, a “large portion of observed variation in research productivity is likely to reflect differences in technological opportunity across research areas, but since most firms conduct R&D in a variety of areas it is very difficult to control for these effects at the level of the firm.” Henderson and Cockburn (1996) explore research productivity by using detailed information of internal records of ten western pharmaceutical firms. They examine the relationship between research expenditure and successful patent at the research program level. They find no evidence of returns to scale at the therapeutic class data, and convincingly argue that the primary advantage of large firms is their ability to realize returns to scope: to sustain an adequately diverse portfolio of research projects, and to capture and use internal and external spillovers of knowledge.
It is very difficult to collect internal firm data on research activity. Therefore similar micro-econometric studies have been disappointingly scarce. To overcome this data restriction, we utilize disaggregated patent data at the therapeutic level from Derwent World Patent Index (DWPI) and Derwent Patent Citation Index (DPCI). These are valuable patent databases since all patents are classified by their originally defined therapeutic classes (Derwent Manual Code)
in pharmaceutical research2.
Main result of the present study is that there are significant returns to scope and nearly constant returns to scale in drug discovery research. These findings suggest that Japanese pharmaceutical firms are relatively small in terms of research scope, regardless of firm size per
se. The Japanese firms may be able to enlarge the scope of research without suffering from
1
Concerning firms’ R&D boundary, see Arora and Gambardella (1990, 1994), Pisano (1990), Hagedoorn et al. (2000), Henderson et al. (1999) and Odagiri (2003).
2
marginal productivity decline at the firm level.
We also examine the extent of spillovers by using the stylized method initially developed by Jaffe (1986). He formulates a spillover pool as the weighted sum of research expenditures of other firms. The weight is calculated by technological distance among firms. By constructing the similar explanatory variables, we find positive correlation between Japanese firms’ patenting and their Japanese rivals’ research spending, although the statistical significance is quite weak. More importantly, we find statistically significant negative correlation between Japanese firms’ patenting and western large companies’ research. Appropriation mechanism of patent may be very effective in drug discovery research and predominate over very probable knowledge spillovers among pharmaceutical firms.
The rest of the paper is structured as follows. Section 2 lays out literature review. Section 3 presents our basic hypotheses. Section 4 provides a description of data. Section 5 shows our econometric specification. In Section 6 we describe our variable construction and assess the degree to which the variables used are likely to provide good measures for our hypotheses testing. Section 7 presents our empirical findings. Section 8 concludes with a short summary and directions for future research.
2. Literature Review
Concerning the relationship between firm size and research productivity, four salient hypotheses
have been examined in the empirical literature3. First, larger firms may be able to retain a lot of
cash-flow to invest research. Second, larger firms may be able to spread fixed costs over multiple research projects. Third, larger firms may be less efficient in research due to agency cost of more bureaucratic internal organization. Finally, larger firms may be able to exploit economies of scale and scope in research. Our main focus lies in the last hypothesis.
Cash-flow hypothesis would be convincing, but cash-flow itself may be the result of research outcome. A large portion of research expenditure is personnel cost, and tacit knowledge is accumulated as human capital within a firm. The transfer of tacit knowledge bears thereby a considerable adjustment cost in research. Smaller and new innovative firms are likely to experience high cost of capital but it is beyond the scope of the present paper.
As for cost spreading, there are two assumptions for cost spreading to be advantageous as explained by Cohen and Klepper (1996). First, rapid growth of sales by innovation is not expected, and a firm regards its current production level as the base for spreading its R&D cost. Second, licensing is costly and firms appropriate the research outcome through its own
3
For more complete literature surveys, see Baldwin and Scott (1987), Cohen and Levin (1989) and Cohen (1995). For the literature of pharmaceutical R&D, see Henderson and Cockburn (1996).
production. If these two assumptions are satisfied, larger firms may be advantageous in research. These assumptions, however, are not likely to be satisfied in drug discovery research. As for the first assumption, a successful innovative drug may contribute to sales by more than 100 billion yen per year. The second assumption is also not likely to be satisfied in pharmaceutical industry since licensing contracts of NCEs are pervasive. For example, more than half of NCEs introduced into Japanese market are licensed-in drugs from abroad (Tenomic, 2003). Hence, we
think that cost spreading does not make large firms advantageous in drug discovery research4.
Concerning the third hypothesis, Aghion and Tirole (1994) analyze R&D management in a framework of incomplete contract theory. They examine a variety of aspects of research activities, such as allocation of property rights, researchers’ employment contracts, co-financing arrangements in research. They convincingly argue that these aspects have considerable impact
on frequency and size of innovations5. The empirical literature suggests that firm fixed-effect
has a considerable impact on research productivity estimates (Henderson and Cockburn, 1996). Why the productivity differences among firms tend to persist? Little is known about the determinants of this persistency (Cohen and Malerba, 2001). The present study adopts the similar empirical strategy to the literature using a fixed effect specification to control time-invariant differences among firms.
As for the last hypothesis, qualitative studies suggest that the organization of R&D is likely to have significant economies of scale (Chandler, 1990). Most research in pharmaceutical R&D, however, has found decreasing returns to scale. Comanor (1965), Vernon and Gusen (1974), Jensen (1987), Odagiri and Murakami (1992), Graves and Langowitz (1993) and Henderson and Cockburn (1996) found decreasing returns to scale in pharmaceutical research at
the firm level6.
By using ten western pharmaceutical firms’ internal data for 1961-1988, Henderson and Cockburn (1996) show that returns to scope in drug research exist but disappear with more than 8 to 10 research programs. In a recent study, Danzon et al (2003) estimate the effect on phase–specific biotech and pharmaceutical R&D success rates of a firm’s overall experience and suggest that a drug is more likely to complete phase II if developed by firms with considerable therapeutic category-specific experience and by firms whose experience is focused rather than broad (diseconomies of scope). Henderson and Cockburn examine drug discovery stage whereas
4
Another explanation for the advantage of large pharmaceutical firms is given by Pisano (1996) and Rothaermel (2001). They argue that complementary assets such as production technology and related process innovation are also important to obtain cost advantage over rivals in pharmaceutical industry.
5
Various types of research partnership among industry-university-government are also very important as the determinants of pharmaceutical research performance, although this is beyond the scope of the present study. See, for example, Hagedoorn, et al. (2000), Owen-smith et al. (2002) and Nicholson et al. (2002).
6
Schwartzman (1976) found that there were significant increasing returns to scale in pharmaceutical research, but there were very few similar findings in the literature as far as we know.
Danzon et al. explore drug development stage. These findings suggest that the determinant of research productivity in drug discovery would be very different from that in drug development stage, and that scope of both research and development programs strongly affects their
respective productivities even if they have distinct impact on them7.
3. Hypotheses Formulation
We examine whether the main findings in Henderson and Cockburn (1996) also hold in Japanese pharmaceutical research, and we hypothesize the determinants of research productivity, following Henderson and Cockburn, in terms of economies of scale, economies of scope and knowledge spillovers among firms as explained below.
Economies of Scale
There are various types of commonly used fixed assets in pharmaceutical research such as libraries, database, experimental facilities, animals and computers. Thus there may be economies of scale at the level of entire research effort. As pointed out by Henderson and Cockburn (1996, p.35), however, “conventional wisdom in the industry suggests that beyond a minimum threshold, under most circumstances there is little to gain from increasing the size of an individual research size.” Thus our first hypothesis is,
H1. There are no returns to scale in drug discovery research at the individual therapeutic level.
Economies of Scope
Economies of scope are present when conducting two or more research projects jointly is more efficient by a single firm than carrying out by multiple firms. There are two types of common assets in drug discovery research. First, there are considerable commonly used physical assets. Second, common pool of knowledge can also be regarded as common asset. Transfer of tacit knowledge within and between firms may be costly and we should not regard tacit knowledge as public goods a priori. The transfer cost of knowledge would be very different among firms as well as among research projects within a firm. Drug discovery research, however, is an intrinsically scientific activity, and various disciplines and research skill such as pharmacology, chemical synthesis, molecular biology and computer engineering can be regarded as commonly usable knowledge base.
7 Cockburn and Henderson (2001-b) also suggest that returns to scale are likely to exist at drug
Our field interviews with several pharmaceutical researchers suggest that internal spillovers within a firm would play an important role in explaining research productivity
differences among firms8. Thus we hypothesize that,
H2. There are returns to scope in research at the firm level. H3. There are returns to scope in research at the therapeutic level.
Unfortunately we cannot use disaggregated research expenditure data. Instead, we assume that research expenditure level at the therapeutic class is closely related to the number of patent application at this therapeutic category. We will examine the relevant measurement issues in later sections.
Knowledge Spillovers
There are three types of spillover effects examined in the literature. First, technological distance between firms or between research divisions within a firm would determine the extent of spillovers. Firms or industries with similar research portfolio would be likely to be able to enhance research productivity by spillovers (Jaffe, 1986). Second, geographic proximity or
agglomeration may affect the flow of knowledge among firms (Jaffe et al., 1993; Saxenien,
1994; Audretsch and Feldman, 1996; Zucker et al., 1998; Zucker and Darby, 2001). Since almost all drug research laboratories have located in Tokyo, Osaka and Tsukuba, the agglomeration effect would also exist in Japan. Third, national boundaries would be important as the determinants of spillovers (Coe and Helpman, 1995; Bernstein and Mohnen, 1998; Jaffe and Trajtenberg, 1998; Branstetter, 2001).
According to our field interviews to pharmaceutical researchers, national boundary
would be very important. First, communication costs are relatively high due to language
difficulties. Second, the enforcement mechanism of the Japanese patent system seems to be
different from other advanced countries at least until quite recently. Ordover (1991) discussed the institutional features of the Japanese patent system including the first-to-file rule, pre-grant disclosure, deferred examination, pre-grant opposition, and indicated that these rules might induce innovators to disclose technological information sooner than under the US patent
system9.
We mainly examine technological distance and national boundary as the determinants
8 Conceptually, a clear distinction could be drawn between economies of scope and internal spillovers.
Henderson and Cockburn (1996, p.35) explained this point as follows: “Economies of scope relate to research expenditures, whereas internal knowledge spillovers affect output irrespective of expenditure”.
9
Previous literature found positive R&D spillovers among Japanese firms in manufacturing industries (Goto and Suzuki, 1989; Suzuki, 1993; Branstetter, 2001) as well as in Japanese pharmaceutical industry (Odagiri and Murakami, 1992).
of knowledge spillovers both among Japanese pharmaceutical firms and between Japanese and large western pharmaceutical firms. We expect that knowledge spillovers may play some role in drug discovery research as suggested by the literature, although we also think that patent appropriation effect would be also important in pharmaceutical industry (Mansfield et al., 1981; Mansfield, 1986; Scherer, 1986; Goto and Nagata, 1997; Cohen et al., 2002 among others).
The main source of common stock of knowledge, except for public research institutes,
universities and other industries, would be rival pharmaceutical firms’ knowledge stock10. The
accumulation of industrial knowledge stock enhances research productivity of each firm. In this case, firms’ research expenditures are complements with one another. On the other hand, if appropriation mechanism by patent system is very effective, various research activities within industry become substitutes. Which effect dominates research productivity estimates is not known a priori. It is an empirical issue to be explored (Griliches 1992; David et al. 2000).
Many researchers on the Japanese innovation system suggested that intra-national knowledge spillovers improved productivity (Goto and Suzuki, 1989; Odagiri and Goto, 1996; Branstetter, 2001 among others). Knowledge base in pharmaceutical industries would contribute not only to a particular research project but also to other research projects within a firm as well as across firms. Hence, our fourth hypothesis is
H4. Research productivity is positively associated with knowledge spillovers among Japanese firms.
A series of survey studies emphasizes that patent is exceptionally important in pharmaceutical industry (Levin et al., 1987; Klevorick et al., 1995; Goto and Nagata, 1997; Cohen et al., 2002): appropriation mechanism by patent is essential to secure profit in pharmaceuticals. However, patent enforcement mechanism in Japan was historically lenient than those of western counterparts’ (Ordover, 1991; Okada and Asaba, 1997; Okada, 1998). Thus we suppose that patent appropriation mechanism is more effective between western and the Japanese pharmaceutical firms than among the Japanese pharmaceutical firms.
Furthermore, although the impact of drastic innovation in life science toward drug discovery research is especially remarkable in western large pharmaceutical firms, almost all Japanese pharmaceutical firms have been relatively slow to adopt these new technologies (Henderson et al., 1999).Over the course of the past twenty years, the process of drug discovery
10
The role of the public sector and universities are of course important, especially in the field of bio-technologies research as the source of knowledge spillovers, although it is beyond the scope of the present study. For literature survey, see David et al. (2000) and Toole (2000). However, the private sector accounted for a large portion of the national total R&D expenditure in pharmaceutical research in Japan, at least until quite recently. Thus our omission of public sector research is not necessarily critical. The US government R&D, however, accounted for a substantial portion of total expenditures and much of this R&D effort has been allocated to life science (Cockburn and Henderson 2001-a).
research in Japan has changed slowly but steadily by rapid advance in life science. In 1960s and 70s, most therapeutic areas were unexplored and there were abundant technological opportunities though medicinal actions were not fully understood. Under the circumstances, dominant strategy of drug discovery research has been random drug discovery from a huge library of natural compounds. This screening process depends heavily on organizational capability and individual researcher’s tacit skill which becomes high entry barriers to latecomers. Hence, internal and external spillovers would have been relatively small in the random screening process (Henderson et al., 1999).
In 1980s, however, with the development of molecular biology, most drug companies abroad adopted so-called guided drug discovery that has profound impact on returns to scope in research. The so-called biotechnologies are the innovative research tools that change pharmaceutical research process drastically, such as search for new compounds, synthesis of lead compounds and scrutiny of drug candidates. As shown by Henderson et al. (1999) and Drew (2000), these technologies are applicable to broad therapeutic areas, and spillovers of relevant scientific knowledge would become more effective.
The impact of biotechnology on research process is especially remarkable in western large pharmaceutical firms, although almost all Japanese pharmaceutical firms have been relatively slow to adopt these new technologies (Henderson et al., 1999). For example, high
throughput screening (HTS) and combinatorial chemistry (CC), which are regarded as key
technologies to shorten the length of drug discovery process, have been diffused in Japan from the middle of 1990s, whereas they were adopted by western large pharmaceutical firms since
the late 1980s11. Thus, we hypothesize that
H5. Spillovers between western and Japanese pharmaceutical firms are not effective due to national boundary, weak incentive of the Japanese pharmaceutical firms to absorb cutting-edge scientific knowledge, the different patent enforcement level etc.
4. Data
Our dataset consists of patent counts filed for the years 1981-1994 by the ten largest pharmaceutical firms in Japan: Takeda, Sankyo, Yamanouchi, Eisai, Fujisawa, Daiichi, Shionogi, Tanabe, Chugai and Taisho. Even though they are the largest pharmaceutical firms in Japan, they are relatively small as well as large, and we believe that our sample is not unrepresentative of the industry in terms of brand-new drug discovery research. Research input at the therapeutic
11
We knew this information from our interviewees of the Japanese pharmaceutical researchers and R&D managers.
level is proxied by the annual number of patent application which is extracted from the DWPI database. Patent application counts are put in order by worldwide priority year by using the definition of patent family (equivalent patents) by the DWPI.
Research output is measured by citation-weighted patent counts. There are various types of weighted patent count used in the literature, such as forward citation, backward citation, patent claims (Tong and Frame, 1990; Lerner, 1994), and patent family (the number of countries
to which equivalent patent is filed)12 13. Lanjouw and Schankerman (1999) suggest that forward
citation is particularly important as a value measure. Forward citations (and patent claims too)
are the least noisy indicators with as much as 30% of the variation being related to quality14. As
many researchers have pointed out, a patent value distribution is highly skewed (Trajtenberg, 1989; Hall et al., 2001 among others). We collected the aggregated number of citations for the
Japanese firms as is shown in Figure 115. Pharmaceutical patents have extremely a skewed
distribution of citation counts.
We collected the number of successful patent which was cited by subsequent patents 10 times or more from world priority date to the end of Dec. 2000. The minimum duration of citation process was 7 years for the latest patent in our dataset. Unfortunately, citation count was not available for each patent at the therapeutic level, because it proved to be prohibitively expensive. Thus we were forced to utilize the number of patent with no less than some threshold number of citation. According to our exploratory work, the product patents which included NCEs as patent claims and were finally introduced into the Japanese market obtained 19.8
forward citations on average16. Thus, we assume that important drug patents would be cited by
subsequent patents no less than 10 times since world priority date through Dec.2000. In our regression analysis, we use citation-weighted patent counts with no less than both 10 and 20
12
There is some increasing trend in patent family. While the average number of patent family in the 80s is far less than 10, it has risen to almost 20 in the 90s in our dataset. This upward trend may be partly due to the increase in PCT (Patent Cooperation Treaty) route patent filings (Okada and Kawara, 2002).
13
Patent renewal data can be another alternative. See Pakes (1986), Schankerman and Pakes (1986), and Lanjouw et al. (1998). Unfortunately we could not collect the renewal data on pharmaceutical patents in Japan.
14 Citation-weighted patent counts have various desirable features as a value measure (Trajtenberg, 1989).
First, patent citations delimit the scope of property rights awarded by the patent. The applicant has a legal duty to disclose any knowledge of the prior art. Patent examiners also add important prior arts as cited documents. Citation count which is collected in this manner is referred to as backward citations. Second, citations received (forward citations) represent the importance of the cited patent (Trajtenberg, 1989; Lanjouw and Schankerman, 1999; Hall et al., 2001).
15
We cannot collect the individual firm’s patent citation counts at the therapeutic level due to our research budget constraint. However, we can afford the aggregated number of citations at the firm level.
16
In our exploratory work, we checked the citation counts of the Japanese 289 pharmaceutical patents which included new chemical entities in their patent claims and finally reached the Japanese market. We found that 46.2% of the total patent citations had occurred within ten years since priority year, and the average citation counts is 19.8, standard deviation is 26.8 and the median is 12 (Okada and Kawara, 2000).
citation in order to check the robustness of our estimation.
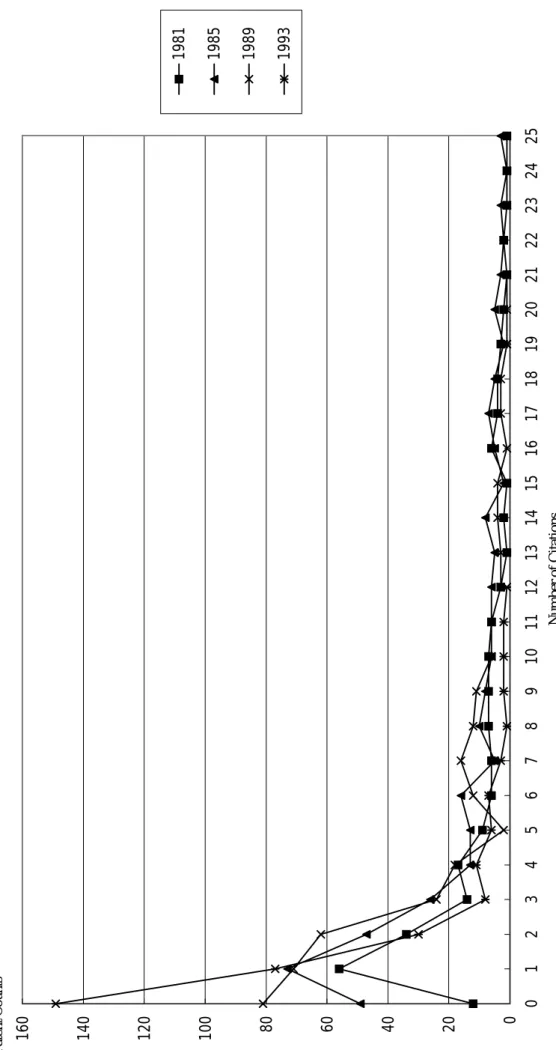
Figure 2 shows citation frequency distribution for selected priority years (’81, ’85, ’89, and ‘93) of the top ten Japanese pharmaceutical firms. The number of citation is counted from worldwide priority date through Dec. 2000. As shown in Figure 2, very few patents have many citations and the distribution of citation frequency is substantially skewed. Within the range of relatively few citation counts, the newer the patent priority year, the less citations occurs due to possible cohort (or age) effect of patent citation process. On the other hand, within relatively high range of citation counts, the differences of citation counts seem to be very little. Even if we use the patent counts with no less than 10 citations, there seems to be very little cohort effect
among patent groups with different priority years17.
Figure 3 shows the annual number of highly cited patents of the top ten Japanese pharmaceutical firms. Substantial part of drug discovery research by Japanese firms started from the early 70s. This is reflected by the upward trend of the number of highly cited patents. More interestingly, Figure 3 indicates that there is an upward trend until the early 80s and then a downward trend from the middle of the 80s onwards. This inverted-U shape is partly due to patent cohort effect. But the most important reason is that the reform of Japanese Patent Law on pharmaceutical patents was enacted in 1975. This enabled the patent filing of chemical compounds as patent claims for the first time which possibly stimulated product innovation of pharmaceuticals in Japan.
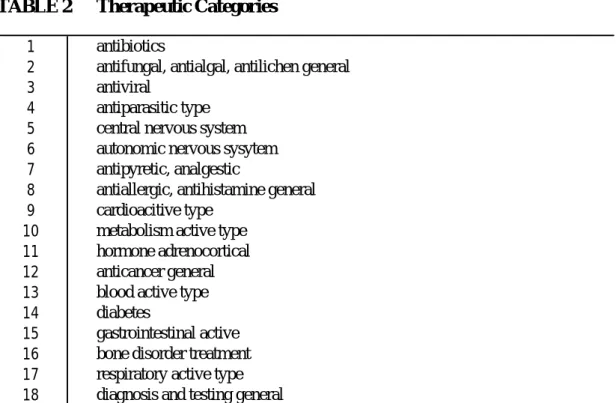
We classify patent data by therapeutic classes which are coded by Derwent Manual Code (FARMDOC B12). This classification consists of 13 major therapeutic areas (central nervous system-active type, cardioactive type etc.), and they are further broken down to 106 therapeutic areas (central depressant, hypertensive, etc.). Whether the Derwent Manual Code is consistent with the actual research programs is not very certain. Therefore we interviewed several pharmaceutical researchers in order to reclassify the Derwent Manual Code into distinct
research projects as much as possible18. After the several field interviews, we regrouped, for
example, antiviral, allergic general, diabetes and bone disorder treatment as an independent research program (see Appendix in more detail).
According to our interviews, there are about four or five major research programs and
about ten research projects if classified in more detail19. Then, with the collaboration of several
pharmaceutical researchers, we classify the Derwent Manual Codes into 18 research projects as
17
Hall et al. (2001) suggested that many citations to the Japanese patents occurred relatively early during 5 to 10 years since worldwide priority dates.
18
We interviewed the following companies several times for each firm: Takeda, Sankyo, Yamanouchi and Shionogi.
19
Unfortunately we cannot show the internal research configuration by the request of the firms giving us the information.
shown in Table 220. At least with these 18 therapeutic areas, we believe that almost all major research programs in the Japanese top ten pharmaceutical firms are safely covered.
Our dataset is a balanced panel indexed by firm, therapeutic area, and year. With the rectangular panel, we have 2520 observations, with 10 firms, 18 research areas, and 14 years. R&D expenditure data at the firm level is also obtained from NIKKEI NEEDS and Annual Reports of various foreign pharmaceutical firms to construct spillover variables.
5. Econometric Specification
Our econometric specification is based on the patent production function (Griliches ed., 1984; Hausman et al., 1984; Hall et al., 1986; Griliches, 1998). Since the number of patent is count (nonnegative integers) data, it is desirable to specify the Poisson or negative binomial distribution model. In order to allow the firm specific effect in our regression, we use the conditional fixed-effect model which was developed by Hausman et al. (1984). Thus our basic econometric specification is,
] exp[
]
[Yikt ikt Xikt k t i ikt
E =λ = β +θ +γ +µ +ε
where
i
indexes the firm,t
indexes the year, k indexes the therapeutic class,θ
k istherapeutic dummies,
γ
t is year dummies,µ
i is a firm specific effect, andε
ikt is aremaining disturbance factor.
Y
ikt is an indicator of patent output. The column vectorX
iktconsists of several explanatory variables which are explained in the next section.
We control the possible effects of technological opportunity at the therapeutic level by
using therapeutic dummies
θ
k. We include year dummiesγ
t to control yearly fluctuation ofhighly cited patents due to time series variation in patenting process, cohort effect of patent citation, ease of obtaining citations from improved patent database, the modifications of the patent examination guideline concerning pharmaceutical products by JPO etc. We assume that
the remaining disturbance
ε
ikt is normal and independent.We hypothesize that many other factors affecting research productivity distribution
from firm
i
in therapeutic class k in yeart
are invariant across firms within a therapeuticcategory and year. To check this assumption, we employ regressions with the cross terms
between therapeutic dummies and year dummies (
γ
t×
θ
k) instead ofγ
t andθ
k separately.For example, if propensity to patent is not invariant across firms within a therapeutic class and
year, then its effect on
Y
ikt is expected to be controlled byγ
t×
θ
k.If we assume random effects specification, the unconditional and conditional density
i
µ
givenX
ikt should be identical. This can be dropped when a conditional maximumlikelihood approach is used with a fixed effects specification. This considers the negative
binomial likelihood conditional on the sum of highly cited patents
∑
tYit, this sum being a
sufficient statistics for µi in the negative binomial model (see Hausman et al., 1984). The firm
specific effect represents unobserved permanent differences across firms which would reflect their organizational capability to acquire highly cited patents.
In our dataset, the variance of the number of highly cited patents is larger than the mean (over-dispersion), so that we prefer a negative binomial model. We also attempt to run alternative empirical specifications, such as random effects negative binomial model,
fixed-effects and/or random-effects Poisson model21.
From the estimated parameters, we can calculate the elasticity by the following formula: . ) / )( / 1
( λikt dλikt dXikt =β
Thus, if an explanatory variable is entered in log, we impose a constant elasticity that parameter can be interpreted as elasticity straightforwardly. On the other hand, if an explanatory variable is
introduced in level, the estimated elasticity isX which varies with the magnitudes of each β
variable.
6. Variable Construction Research Output
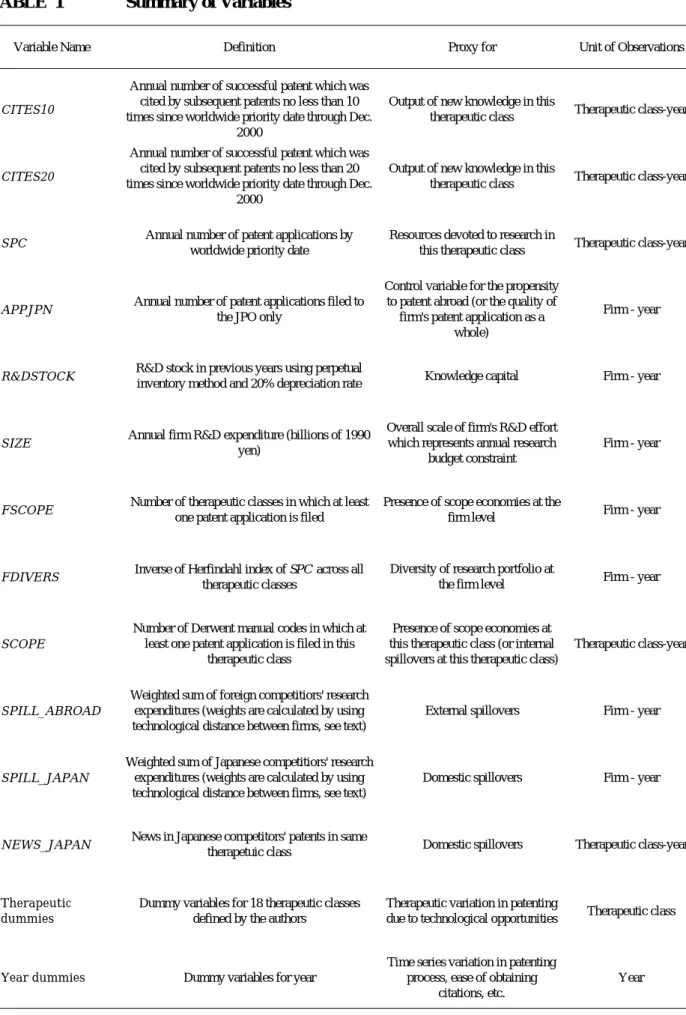
Table 1 gives a summary of variables and definitions. Dependent variables are Cites10 or
Cites20, defined as the annual number of successful patent which was cited by subsequent
patents no less than 10 or 20 times since world priority date through the end of Dec. 2000. In unreported exploratory regressions, we included an additional independent variable which was the number of years since worldwide priority year through 2000 in order to control an age effect. Actually this variable was not statistically significant in various specifications. Year dummies may control possible cohort effect of patent citation effectively.
Research Size
Our primary explanatory variable of research size is the annual number of patent applications (SPC) as a proxy for resources devoted to research at the therapeutic level. The number of
21
All the estimates in the article were obtained using the maximum likelihood procedure in STATA7. See
patent application at the therapeutic level would reflect some portion of research expenditure. If the number of patent application increases, it would be caused, at least partly, by the increase in resources devoted to the same research project, ceteris paribus. Because we cannot use data on research spending at the therapeutic class, the estimated coefficient of SPC may be overestimated due to omitted variable bias. Thus if the estimated coefficient of SPC is lower
than unity, we can safely guess that returns to scale at the therapeutic level would not exist22.
This definition of research size would be also affected by technological opportunities. Because research outcome at the therapeutic class is likely to reflect the technological opportunity, the number of patent application may correlate with the error terms. We control the therapeutic variation of technological opportunities by using therapeutic dummies.
In Japan, the granting success rate (the ratio of the number of patent-granted to that of
patent-application) is very low23. The possible reasons would be as follows:24 (i) defensive
motives from patent litigation was relatively strong in Japan, (ii) patent application fee was much cheaper than patent examination fee as well as patent renewal fee at least until quite
recently, (iii) single patent claim system was maintained until 198725, and (iv) the restriction to
post-grant modification of patent document was lenient at least until 1993, which motivated Japanese applicants to file as early as possible. Most applicants of pharmaceutical patent deferred patent examinations by utilizing seven-year grace period (referred to as the deferred
examination system) which further reinforced the motivation to file patent as early as possible26. Thus, the patent application which was filed solely to JPO does not seem to be important in terms of technological performance, and it is very unlikely that the firm with many patent application filed to JPO only would have high research productivity. We treat this
lion-at-home-and-mouse-abroad effect by using the control variable, APPJPN, which represents
the annual number of patent applications filed to the JPO only.
Next we define firm size variable (SIZE) by annual R&D expenditure at the firm level. R&D expenditure is deflated by using Research and Development Deflator (Science and Technology Agency). It is desirable to exclude drug development cost from annual R&D
22
The body of evidence indicates that simple patent count is closely related to the input side of innovative process, primarily with contemporaneous R&D expenditures in the cross sectional dimension. See Bound et al. (1984), Griliches ed. (1984), Hall et al. (1986), and Griliches (1990, 1998).
23
The grant-application ratio was 20.5% for the years 1971-1990 on average in Japan. The same ratio was 63.8% in the U.S (Okada 1998).
24
See Ordover (1991), Okada and Asaba (1997), and Okada (1998) in more detail.
25
Until 1987, JPO did not allow multiple claims in single patent filing. This rule is referred to as single
patent claim system. See Ordover (1991) and Okada (1997, 1998). The effect of the transition from single
claim to multiple claim system on patenting activity is examined by Sakakibara and Branstetter (2001).They find no evidence of an increase in either R&D spending or innovative output that could plausibly be attributed to the patent reform.
26
expenditure in order to reflect the size of drug discovery research, but we cannot obtain such a disaggregated data. Therefore we regard SIZE as the proxy for overall scale of firm’s R&D effort. We suppose that this variable may reflect the increase in development cost due to strengthened regulation of clinical practice and higher clinical trail costs. We expect negative sign of the parameter because drug discovery research budget is financially constrained by higher development cost. Indeed, patent-R&D ratio has continuously declined in all pharmaceutical firms in our dataset in accordance with the previous literature. As Henderson and Cockburn (1996, p.44) suggested, this may be due to the transition to rational drug discovery research which caused a change in patenting strategies and an increase in the significance of each patent. Another possibility is that the industry is approaching technological exhaustion (Grabowski and Vernon, 1990).
We also define R&D stock variable (R&DSTOCK) as the proxy for cumulative R&D experience which is constructed by the standard perpetual inventory method. We assume a
depreciation rate for R&D stock equal to 20% as is used by other studies27. We attempted to use
different depreciation rates, such as 10% and 15%, but regression results were virtually unchanged. R&D stock variable may be less biased than current R&D expenditure, although this may not be enough to control firm level scale effect. We introduce several other control variables at the firm level such as APPJPN and other research scope variables as explained below, as well as the fixed effect specification to control potential heterogeneities among firms.
Economies of Scope
Next, we introduce the variable FSCOPE which is defined by the number of Derwent Manual Code in which at least one patent application is filed. There would be some therapeutic areas in which no patent application is filed but a firm spends some research expenditure at that therapeutic class. Therefore we may underestimate the scope of research and our estimates may contain some bias. The direction of bias, however, is not very certain, because there may or may not be some concomitant accumulation of knowledge at that research project.
To explore a different dimension of diversification effect, we examine the diversity of research portfolio by using the variable FDIVERS which is defined by the inverse of Herfindahl index of simple patent application counts (SPC) across all therapeutic classes. As Henderson and Cockburn (1996) explained, larger firms run more programs and thus tend to have higher values of FSCOPE and higher value of FDIVERS, nonetheless, some of the smaller firms have very diverse research portfolios; some small pharmaceutical firms would spread research expenditure uniformly through wide therapeutic areas, whereas other large firms may concentrate their research focus on some therapeutic areas. These two measures, FSCOPE and
27
FDIVERS, may have different impact upon research productivity.
To examine internal spillover effect, we define the variable SCOPE by the number of Derwent Manual Code within a therapeutic class. For example, “central nervous system” consists of “antiparkinsonian drug (B12-C04)”, “central depressant (B12-C05)”, and “central stimulant (B12-C06)” etc. (Derwent Manual Codes are in parentheses, see Appendix and Table A in detail). This would reflect the presence of scope economies at the therapeutic class. The coefficient of SCOPE is expected to have a positive sign, since the medicinal actions of the same therapeutic category would be similar and thereby knowledge spillovers within a therapeutic class are very probable.
Knowledge Spillovers
Following Jaffe (1986), the level of research expenditure and the technological distance constitute the basis for our construction of spillover pool measures. We define the spillovers variable as the weighted sum of competitors’ research expenditures and the weights are
calculated by using technological distance between firms. The spillovers firm
i
receives aredefined as
∑
≠ = i j j ij i P R SPILLwhere P is the technological distance, that is, the fraction of knowledge firm ij
i
is able toreceive from firm j and R is firmj
j
’s research expenditure.Various suggestions on how to calculate the spillover weights P can be found in the ij
literature. Most of the approaches to proxy P are based on firms’ technological distance ij
(Scherer, 1984; Jaffe, 1986). Their main assumption is that knowledge flows between firm
i
and firm
j
are proportional to the share of patents of firmj
in the area of firmi
. Jaffe(1986) defines
K
-dimensional patent distribution vectorsF
, whose elements are the fractionof firm
i
’s research efforts devoted to itsK
most important fields of patent activity. That is,). ... ...
(F1 Fk FK
F=
We define
K
by the patent application counts of the 18 therapeutic categories as defined inTable 2. The measure of technological distance between firm
i
and firmj
is the cosinebetween Fi and F . That is, j
. )] )( [( ' ' 1/2 ' j j i i j i ij F F F F F F P =
If firm
i
’s and firmj
’s patent portfolio perfectly coincide, P takes on the value 1. If they do ijnot overlap at all, it takes on the value 0. Kaiser (2002) shows that this uncentered correlation of firm characteristics which is related to the type of technology space is best among the several approaches he examined.
By using this formula, we construct the variable of intra-national spillovers (SPILL_JAPAN) by using the top ten Japanese pharmaceutical firms’ patent and R&D data. To construct the variable of international spillovers (SPILL_ABROAD), we collect the data on patents at the therapeutic class from the DWPI and the R&D expenditures data from the Annual Reports of the following western large pharmaceutical firms; Merck, Pfizer, Glaxo, Wellcome, Smithkline, Beecham, Bristol Myers Squibb, Hoffman-La-Roche and Eli Lilly. We selected these firms since their business domain were relatively concentrated on pharmaceuticals. We combined the related patent and R&D data if they were merged by other firms, such as Beecham and Smithkline in 1988, Bristol Myers and Squibb in 1989, and Glaxo and Wellcome in 1995. We deflated the foreign firms’ R&D expenditure by Biomedical Research and Development Index issued by National Institute of Health, and converted to dollars by using Purchasing Power Parity, if necessary. The base year is 1990.
The correlation between SPILL_JAPAN and SPILL_ABROAD is quite high (0.92). Thus there could be some multicollineality in our regressions: international spillovers and intra-national spillovers would pick up the same underling factor. Therefore, to examine domestic spillovers from a different angle, we use alternative domestic spillover variable (NEWS_JAPAN) by using the news formulation which was used in Henderson and Cockburn
(1996). That is, news in
X
is defined byN
t=
X
t−
δ
K
t−1, whereK
is the stock ofX
and
δ
is the depreciation rate. This is equivalent to using a binary measure of technologicaldistance. This construction may reduce potential measurement errors. We construct the variable as news in the Japanese competitors’ patent applications in the same therapeutic class. We
calculate the patent stock
K
by using the standard perpetual inventory method with 20%discount rate. The correlation between NEWS_JAPAN and SPILL_ABROAD is substantially decreased to 0.07. By using these two different measures of spillovers, we check the extent of localization of knowledge spillovers.
As is explained by Branstetter (2001, pp.72-3), we do not actually observe the pure effects of knowledge spillovers by this formulation. We instead observe the effects of spillovers on the behavior of patent filing. If R&D competition with other firms is intense enough, then firms may find themselves competing in a limited range of the therapeutic space for a limited pool of available pharmaceutical patents. Thus positive knowledge spillovers are potentially confounded with a negative effect of research rivalry in patent race. Jaffe (1986) and Branstetter (2001) have clearly made this point. Thus the implication of the estimates should be carefully
examined.
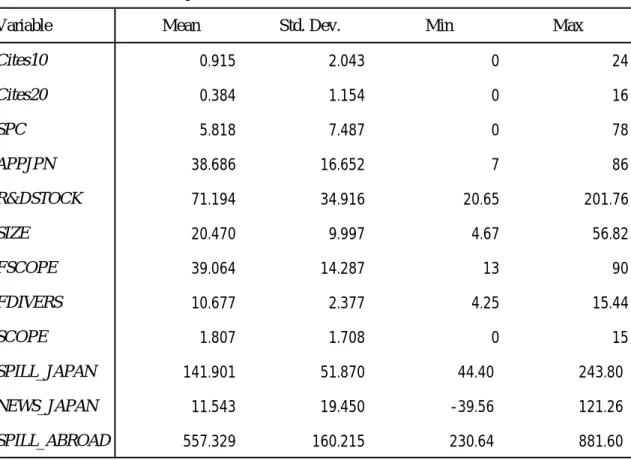
Table 3 shows descriptive statistics. Annually averaging across the top ten Japanese firms, they spent 20.4 billion yen (base year is 1990). They file 62.3 patents per firm and 5.82 patents per therapeutic class on annual average. They spent 0.33 billion yen annually per patent application and obtained 0.92 (0.38) patent with no less than 10 (20, respectively) citations. Almost all of the key variables have substantial time-series variations. For example, mean R&D expenditures per firm increased from 11.6 billion yen in 1981 to 29.8 billion yen in 1994. Research expenditure per patent application virtually doubled from 0.21 billion yen in 1981 to 0.44 billion yen in 1994.
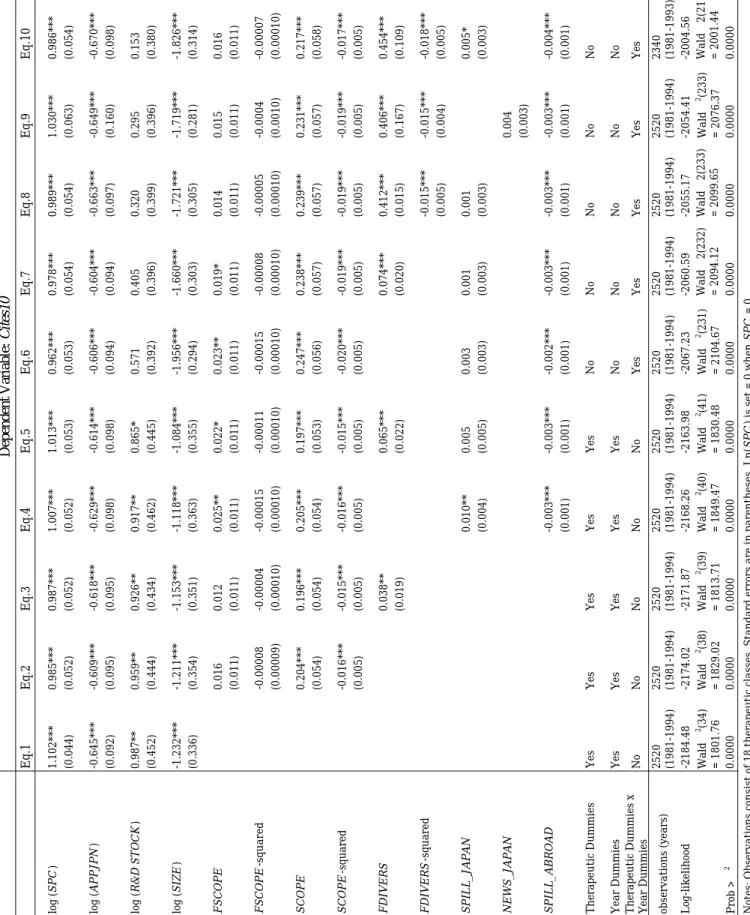
7. Empirical Results
Table 4 presents a series of estimations of our basic model using maximum likelihood methods and the negative binomial distribution. The dependent variable is the annual number of successful patent which was cited by subsequent patents no less than 10 times (Cites10). To save space we do not report the coefficients of 17 therapeutic class-dummies, 13 year-dummies, and their 221 (= 17 x 13) cross terms. Eq.1 through Eq.5 includes therapeutic dummies and year dummies separately. From Eq.6 to Eq.10, these dummies are replaced with their cross terms. In Eq.10, we dropped the year 1994 from our observations to check the robustness of our
estimations28.
In Table 4, the estimated coefficients of SPC (proxy for resources devoted to drug discovery research at the therapeutic level) are less than unity in most cases which imply nearly constant returns to scale in drug discovery research. We cannot reject the null that the coefficient of SPC equals one in various specifications. This suggests that the marginal returns to scale with respect to SPC are not increasing. As mentioned before, the estimated coefficients of SPC would have some upward bias. Even with some upward bias, the estimated coefficients are not significantly larger than unity in all regressions. That is, there is no evidence of
increasing returns in our patent production function29.
From Eq.2 through Eq.10, we introduce the explanatory variables designed to capture
28
This is because the classification of Derwent Manual Code drastically changed since 1994 onward. Therefore we omitted the year 1994 in Eq.10 to check some possible bias due to different therapeutic classifications. See Appendix in detail.
29
The estimated elasticity of patenting with respect to SPC is somewhat higher than the estimates previously obtained using data for the whole manufacturing sector in the 1970s and 80s. For example, Hausman et al (1984) obtained an R&D elasticity of 0.87 using the Poisson distribution and an elasticity of 0.75 using the negative binomial distribution for 128 large firms. Hall et al. (1986) obtained somewhat lower elasticity of 0.52 for a larger sample for 642 firms. Henderson and Cockburn (1986) obtained the sharp decreasing marginal returns to increasing investment in any single research program using ten pharmaceutical firms and the estimated elasticity is around 0.02 to 0.03.
the effects of scope economies. Scope economies at the therapeutic level (SCOPE) have a significant non-linear impact on research productivity. This suggests that internal spillovers at the therapeutic level strongly enhance the research productivity. At the mean, the elasticity of patent output with respect to SCOPE is 0.39 by using the parameter estimates of, for instance, Eq.9. This means that the Japanese firm obtains approximately 38% more highly cited patents on average due to internal spillovers at the therapeutic level.
Scope economies at the firm level (FSCOPE) are not statistically significant except for the results from Eq.4 to Eq.6. While the SCOPE effects are essentially unchanged in various specifications, the coefficients of FSCOPE slightly fall when we add the FDIVERS term. The coefficients of FDIVERS show significant impact upon patent productivity. Actually there is a positive correlation (0.53) between FSCOPE and FDIVERS: FSCOPE can be statistically significant if FDIVERS is excluded from regressions, but if they are introduced in regressions simultaneously, FSCOPE becomes less or not statistically significant. It may reflect some specification problem. At least either one of the two variables, however, is expected to pick up the significant impact of scope economies at the firm level although there is some upward bias in our estimates. From our parameter estimates in Eq.7, the elasticity of the number of highly cited patents to FSCOPE at the mean is around 0.74. This means that the number of highly cited patents increase on average by approximately 110%. FDIVERS is also statistically significant in Eq.7 and its coefficient is 0.074. The calculated elasticity is 0.79. This means that highly cited patents increase by approximately 120% at the mean. That is, returns to scope at the firm level enhance patent propensity nearly twofold.
Concerning domestic spillover effect (SPILL_JAPAN), Eqs.4 and 10 detect marginally significant positive correlation between the number of highly cited patents and competitors’ research spending, but this is no longer statistically significant in other specifications. As for international spillovers (SPILL_ABROAD), there is a negative and statistically significant effect on patenting in all specifications and the parameter estimates are very stable (-0.003). This effect is quite large: at the mean, the elasticity of international spillovers is -0.43. A one standard deviation increase in the international spillover variable decreases the expected number of highly cited patents per year by 38.2%.
There may be some specification problems concerning domestic spillover variables; this may be due to a strong correlation between SPILL_JAPAN and SPILL_ABROAD (0.92). Therefore we replace SPILL_JAPAN with NEWS_JAPAN - news in Japanese competitors’
patents in the same therapeutic class - to check the sensitivity of the domestic spillover variable
in Eq.9. The correlation between the two variables is 0.07. The parameter is still positive but it is not statistically significant. In unreported regressions, I employed several regressions with
statistically significant in most cases.
When we introduce FDIVERS, the coefficient of SPILL_JAPAN falls sharply, but the
SPILL_ABROAD effect is virtually unchanged. It may also reflect some other specification
problems: the FDIVERS may be proxying for a variety of unobserved correlated effects, such as the quality of absorptive capacity, or there may be a problem with the endogeneity of the
FDIVERS with respect to external spillover effects.
In Eqs.1 to 5, the elasticity to R&D stock at the firm level would be around 0.8 to 0.9. If we could regard R&DSTOCK as research size, there would be no returns to scale at the firm level. If we use cross terms of therapeutic and year dummy variables from Eq.6 through Eq.10, however, the coefficients of R&D stock decrease sharply and are not statistically significant. Conditioning past R&D experiences by the cross terms may simply be purging this coefficient that is endogenous response to past experiences. It may still be arguable, however, that there is
no evidence of increasing returns at the firm level30.
The coefficients of SIZE (total R&D spending) are negative and statistically significant. We interpret this finding as cash-flow constraint for drug discovery research due to higher clinical trail costs, the adoption of expensive new technologies etc. Of course there is another possibility such as strategic response to competitors’ patenting or technological exhaustion as mentioned before. Anyway, the declining trend in patenting rates with respect to firm size is significantly steep. The estimated elasticity is less than -1, and decreases more if we run regressions with the cross terms between therapeutic and year dummies.
The coefficient of APPJPN is negative and significant as expected. The elasticity is slightly less than -0.6. Thus, the patent application which was filed solely to JPO does not seem to be important in terms of technological performance, and it is very unlikely that the firm with many patent application filed to JPO only would have high research productivity.
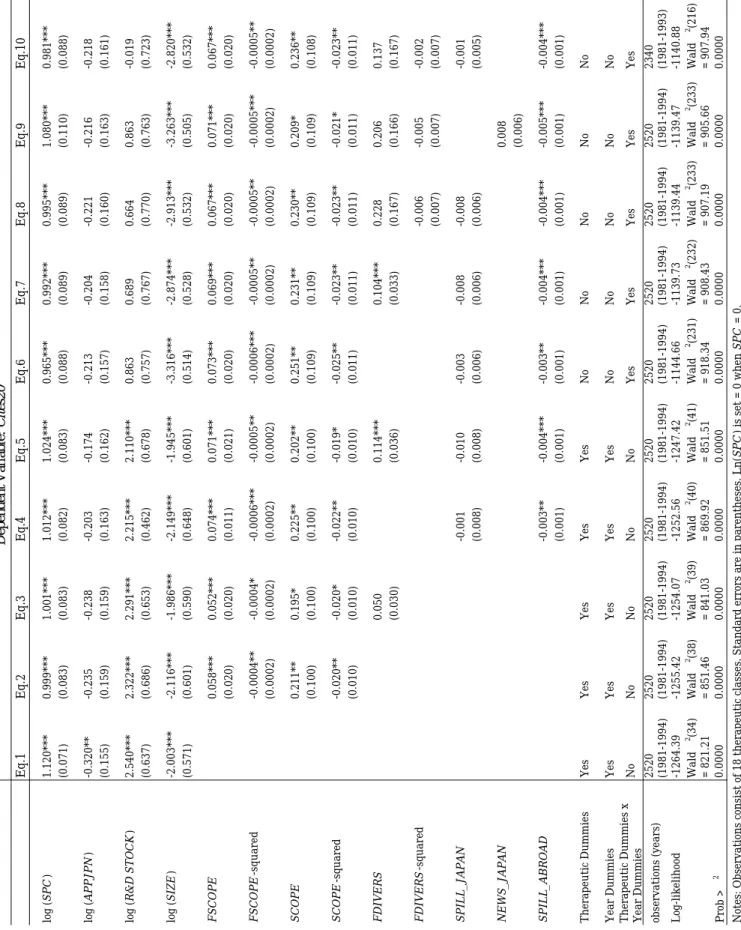
In Table 5, we use the number of more highly cited patents (Cites20) as the dependent variable in order to check the robustness of our regressions. We obtain by and large similar estimation results to those of Table 4. The estimated coefficients of SPC are slightly higher, but
they remain virtually unchanged from the previous results31. We cannot reject the null that the
30
We attempted to estimate firm level scale economies by using conditional fixed effect negative binomial specification with firm level data constructed from our same dataset as follows: Number of citations in DPCI = -5.663 (0.749) + 0.960 (0.120) log (Number of patent applications) + 1.397 (0.189) log (Number of years from award date to Dec.2000) + dummies (Standard errors are in parentheses).
Number of observation = 140 (14 years x 10 firms), log likelihood = -673.319, Waldχ2-statistics =
236.60, p-value = 0.000. The coefficient of the number of patent applications is highly significant. Thus there seems to be no returns to scale at the firm level data. But the estimated elasticity (0.960) is higher than the stylized outcome of the literature in the pharmaceutical industry. See, for example, Odagiri and Murakami (1992) and Henderson and Cockburn (1996).
31
There may be some zero-inflated bias because there are a lot of zero observations in Cites20. The number of zero observations is 2053 (total sample is 2520). In unreported supplemental regressions, we
coefficients take on the value 1 in all equations. Thus it can be still safely said that there are no increasing returns to scale at the therapeutic level. The SCOPE effect is still statistically significant and the estimated coefficient is not so different from the previous results. The salient features in the estimated results in Table 5 appear to be as follows: (1) The APPJPN effect is negative as expected but no longer statistically significant. Propensity to patent abroad may be irrelevant to domestic propensity to patent in very highly cited patents (i.e. very promising patent at birth); (2) FSCOPE becomes statistically significant but FDIVERS is no longer significant. This is just the reverse of the previous results in Table 4. It may still reflect some specification problems. We suspect that the FDIVERS may be proxying for a variety of unobserved correlated effects and it is suffered from endogeneity bias.
In Table 6, we estimate the patent production function by using different specifications. Because of all the potential specification problems, the results in Table 6 are offered in the spirit of a reality check for our basic patent production function model. Concerning the random and fixed effect specifications with negative binomial distribution, we obtain very similar parameter estimates between Eq.1 and Eq.2 (Eq.1 is duplicated from Eq.8 in Table 4 for easy comparison). Log likelihood test statistics vs. pooled data is 67.94, which means the panel estimator is significantly different from the pooled estimator.
Random effect specification leads to higher and statistically significant coefficients of
R&DSTOCK than those in fixed effect specification. Unlike the fixed effect model, however, the
estimates for the random effect model may not be consistent if the individual intercepts are correlated with the other independent variables. A Hausman test for the systematic differences of the coefficients between random and fixed effect negative binomial models rejects the null
hypothesis (Hausman statistics = 10.83,
p
=
0.029) in favor of a fixed effect specification inEq.1. In addition, the Hausman statistics for the Poisson specifications is 13.25 and
p
=
0.010in favor of fixed effect specification in Eq.3. Thus we should be cautious about the interpretation of R&DSTOCK.
The negative binomial model estimates would be inconsistent if the true distribution were not negative binomial, even asymptotically. The estimates are robust only to certain forms of heteroskedasticity, and the omission of relevant variables, even those not correlated with the included variable, could lead to biased results. On the other hand, the Poisson model generally
remains consistent even under heteroskedasticity32. Using Poisson distribution, however, rarely
changes our estimation results. As shown in Eqs.1 and 3, there are surprisingly no differences in
examine zero-inflated negative binomial model by using pooled data (see Greene, 2000, pp.889-892). We add firm dummies to control firm fixed-effect. The estimation results are almost similar to our basic model
32
For a formal development of Poisson / negative binomial model with a fixed / random effect, see Hausman et al. (1984).
the estimated coefficients in fixed effect specifications between negative binomial model and Poisson model. In random effect specifications, we obtain almost the same estimation results between negative binomial model and Poisson model (see Eq.2 and Eq.4). Finally, these results and implications of our estimations are virtually maintained if we use the dependent variable of
Cites20 as shown in Eq.5 through Eq.8.
Taken together, the estimation results strongly support our hypotheses on returns to scope (H2 and H3). Concerning scale effects, we detect almost nearly constant returns to scale at the therapeutic level. Thus there are no returns to scale in drug discovery research at the individual therapeutic level (H1). Moreover, we detect significant substituting effect between Japanese and western pharmaceutical firms’ drug discovery research (H5). This suggests that appropriation effect by patent predominates over probable knowledge spillovers from abroad. In other words, western pharmaceutical firms may be well engaged in a fierce patent race, in which the Japanese firms’ patenting may be blocked effectively. We cannot detect positive significant spillovers among Japanese pharmaceutical firms as suggested by the literature (H4). This non-significance may also, at least partly, due to patent appropriation effect in drug discovery research. If the Japanese pharmaceutical firms learn a great deal from domestic competitors as suggested by the literature, then the negative effect due to patent race would be outweighed by the positive effect of knowledge spillovers which leads to positive signs of the parameters even though they are not statistically significant.
8. Concluding Remarks
Our results suggest that the large firms appear to have advantage in the conduct of drug discovery research mainly due to economies of scope. Research activity done by larger firms benefits more from the economies of scope at the firm level as well as from the ability to internalize knowledge spillovers within a firm at the research project level. We are not able to detect enough econometric evidence of domestic spillovers. As for the global spillovers between western and Japanese pharmaceutical firms, we detect statistically significant negative correlation between research expenditures of large western pharmaceutical firms and the Japanese firms’ patenting. This may be due to the strong appropriation effect of patent.
The present study opens up a number of questions for further research. First, one of our interesting results is that the great variety of the number and weight among research project really matters in drug research productivity. The firm’s advantage of drug discovery research may be independent of firm’s overall size of innovative resources per se but depend upon the absorptive capacity of internal economies of scope. This suggests that organizational capability affects the performance of research productivity strongly. The issues on research management
are not scrutinized in detail at the present study. In order to explore this line of research, we should examine the determinants of internal and external spillovers in much more detail. Recent trend of R&D outsourcing and alliances between firms seems to be one of the important clues to consider these points (Nicholson et al., 2002; Danzon et al., 2003). Although we cannot collect enough data upon cooperative research and R&D outsourcing at present, we would like to try
this line of research in near future33.
Second, we cannot examine returns to scale at drug development stage34. The
capability to advance drug development seems to be very important, such as clinical research, development of drug formulation technologies, and specialized knowledge about regulatory approval process, even if R&D process would be gradually disintegrated among pharmaceutical firms, bio-ventures, universities, contract research organizations (CRO) etc. The specialized knowledge on drug development stage can be one of the main advantageous complementary assets of incumbent pharmaceutical firms in lengthy and disaggregated drug development
process35.
Finally, we do not explore the role of public sector in drug discovery research at the present study. There is a large body of empirical evidence of the complementary relationship between public and private research. Many researchers suggest that science-based industries, such as bio-pharmaceutical industry, depend strongly on knowledge spillovers among firms and other institutions such as universities and public research institutes (Dasgupta and David, 1994; David et al., 1999; Toole, 2000; Zucker and Darby, 2001 among others). Unfortunately there are very few studies on policy evaluations of publicly supported R&D in Japanese pharmaceutical
industry mainly due to the lack of sufficient data on the government activities36. This is a
promising and important line of future research.
33
Recent attempts on these issues are Cockburn et al. (1999), Henderson et al. (1999), Odagiri (2003), and Rothaermel (2001).
34
See, for example, Henderson and Cockburn (2001-b) and Danzon et al. (2003).
35
See Rothaermel (2001). Most Japanese researchers in pharmaceutical firms suggested to us in our field interviews that downstream production technologies such as drug delivery system (DDS) may be one of the advantageous technological fields in Japanese pharmaceutical research in near future.
36
Recent interesting study on this point in the US pharmaceutical industry is Toole (2000). An excellent survey article on this issue is David et al. (2000). The innovation policy in Japanese manufacturing industries has been evaluated by several researchers. See, for example, Odagiri and Goto (1996), Goto and Odagiri (1997) and Branstetter and Sakakibara (1998).