Alloy-composition-dependent oxygen reduction
reaction activity and electrochemical
stability of Pt-based bimetallic systems: a
model electrocatalyst study of Pt/PtxNi100−
x(111)
著者
Naoto Todoroki, Ryutaro Kawamura, Masato
Asano, Ren Sasakawa, Shuntaro Takahashi,
Toshimasa Wadayama
journal or
publication title
Physical Chemistry Chemical Physics
volume
20
page range
11994-12004
year
2018-04-03
URL
http://hdl.handle.net/10097/00126978
1
Alloy-Composition-Dependent Oxygen Reduction Reaction Activity and Electrochemical Stability of Pt-based Bimetallic Systems: A Model Electrocatalyst Study of Pt/PtxNi100-x(111)
Naoto Todoroki*, Ryutaro Kawamura, Masato Asano, Ren Sasakawa, Shuntaro Takahashi and Toshimasa Wadayama
Graduate School of Environmental Studies, Tohoku University, Sendai 980-8579, JAPAN
TEL: +81-22-795-7320
Email: [email protected]
Abstract
The oxygen reduction reaction (ORR) activity and electrochemical stability of well-defined n monolayer (ML)-Pt/PtxNi100-x(111) (n = 2 and 4; x = 75, 50, and 25)
model electrocatalyst surfaces was investigated in this study. The initial activity of the as-prepared two-monolayered Pt-covered PtxNi100-x(111) substrates
2
(2ML-Pt/PtxNi100-x(111)) increased with the increasing Ni composition in the
PtxNi100-x(111) substrate. In particular, 2ML-Pt/Pt25Ni75(111) exhibited an initial
activity that was 25 times higher than that of clean Pt(111) although the higher Ni composition resulted in the destabilization of the catalyst upon potential cycles (PCs) application. As for the 4ML-Pt/PtxNi100-x(111), the activity enhancements were
insensitive to the alloy composition and the thicker Pt shell layers stabilized the catalyst against PCs applications. In particular, the activities of 4ML-Pt/Pt50Ni50(111)
and 4ML-Pt/Pt25Ni75(111) gradually increased during 1000 PCs probably because of
the PCs-induced mono-atomic heights and nanometer-sized islands that had (110) and (100) steps introduced onto the topmost (111) terraces. Thus, the simultaneous tuning of core–alloy composition and Pt shell thickness is vital for developing practical, highly efficient Pt-based alloy ORR electrocatalysts.
Keywords: oxygen reduction reaction; polymer electrolyte membrane fuel cell; platinum; nickel; bimetallic alloy; molecular beam epitaxy
3
Introduction
Improving the slow reaction rate of the oxygen reduction reaction (ORR) that occurs at the cathode of polymer electrolyte fuel cells (PEFCs) is an important subject for developing highly efficient PEFCs. Practically, Pt nanoparticle (NP)-supported carbon black (Pt/C) is used for cathode catalysts to accelerate ORRs.1 To develop
inexpensive, highly active, and durable ORR catalysts, reduced Pt loadings and an enhanced catalytic performance (activity and durability) to a level that is superior to Pt/C is required. Pt–M (M = Ni, Co, Fe, Cu, and many more) alloy NPs are one alternative of Pt NPs because of their high activity.2-12 To practically use Pt–M NP
catalysts, chemical or electrochemical activation processes are generally pre-conducted to form a few atomic layers of Pt (shell) on Pt–M alloy NP (core) nanostructures (Pt/Pt–M core–shell) via the selective dissolution of less-noble M atoms.6, 12, 13
The ORR activity enhancements of Pt/Pt–M core–shell catalysts can be explained via electronic (ligand) and/or geometrical (strain) effects.3, 14-17 The ligand
effect is based on direct electronic charge transfers between neighboring Pt and M atoms.18, 19 The geometrical strain effect originates from a lattice mismatch between
4
the Pt shell.20 The alloy composition and crystal structure of the Pt-M core are known
to be crucial not only for a pristine state but also for the practical operating conditions of PEFCs.21-23 To date, the influence of Pt–M alloy composition on the enhancement
of the ORR activity have been studied for practical Pt–M NPs2, 24-28 and Pt–M
single-crystal model catalysts.29, 30 Roque et al. investigated the adsorption properties
of oxygen-related species (O, OH, H2O) on a Pt shell/Pt–Co(111) model bimetallic
surface using density functional theory (DFT) calculations and showed that the ORR activity increased with increasing Co atomic ratio in Pt–Co(111) alloys.31 Another
important factor for determining the activity and durability of the ORR catalyst is an effective Pt shell layer thickness. Indeed, we demonstrated that the activity and stability of Pt/Ni/Pt(111) surfaces significantly depend on the Pt shell layer thickness: two monolayers (MLs) of the Pt shell showed the highest initial activity; however, more than three MLs were required to stabilize the Pt shell surface.32 Independently,
Moseley et al. theoretically showed that the precise control of Pt shell thickness is essential for achieving a maximum ORR activity for PtCu@Pt catalysts.14
To improve the initial ORR activity and electrochemical stability of Pt/Pt–M catalysts, the atomic-level control of the topmost surface and interface nanostructures is indispensable throughout pre-conducted chemical or electrochemical treatments,
5
e.g., the de-alloying of Pt–M NPs and under practical PEFC operating conditions. However, not only the precise control of alloy composition and crystal structure but also the shell thickness of Pt–M core–shell catalysts is extremely difficult to achieve because activation treatments (de-alloying) and potential fluctuations during the operation of the PEFC lead to inevitable changes in the surface and interface structures of Pt shell/Pt–M core catalysts.6 Therefore, atomic-level experimental
investigations are crucial for the discussion of the activity and durability of Pt/Pt–M core–shell catalysts.
In this study, the ORR activity and electrochemical stability of Pt/Pt–Ni single-crystal model catalysts (nML-thick Pt shells epitaxially grown on PtxNi100-x(111) (n = 2 and 4; x = 75, 50, and 25)) were investigated. Molecular beam
epitaxy (MBE) under ultra-high vacuum (UHV; ~10−8 Pa) conditions was used to
fabricate the different thicknesses of Pt shells on the PtxNi100-x(111) substrates. The
topmost surface structures of the Pt shell and the surface Pt/Ni atomic ratios were analyzed via scanning tunneling microscopy (STM) and X-ray photoelectron spectroscopy (XPS) under UHV conditions. After the structural evaluations, the model catalysts were transferred from UHV to electrochemical (EC) setups, and the ORR activity of the nML-Pt/PtxNi100-x(111) model catalyst surfaces were investigated in
6
0.1-M HClO4. The EC stability of the surfaces are discussed based on surface
structural evaluations that were conducted before and after potential cycles (PCs) between 0.6 and 1.0 V compared with when a reversible hydrogen electrode (RHE) was used.
7
Experimental
Details of the sample fabrication, characterization under UHV, and the EC measurements are described elsewhere.33-35 The base pressure of the UHV-MBE
system was approximately 2 × 10⁻⁸ Pa. Pt
75Ni25(111) ( = 6 mm, t = 1 mm);
Pt50Ni50(111) ( = 8 mm, t = 1 mm); and Pt25Ni75(111) ( = 8 mm, t = 1 mm)
single-crystal substrates with miscut angles of lower than 0.1° (purchased from Mateck) were cleaned via repeated Ar+ sputtering and annealing at 1173 K in UHV.
Then, two and four ML-thick Pt layers were deposited on the cleaned surfaces of the substrates at room temperature, followed by annealing at 673 K for 5 min to extend the surface epitaxial Pt(111) layers. The Pt layer thickness was monitored using a flux monitor of an e-beam evaporation source and calibrated using a quartz microbalance. All STM images were collected at room temperature in the constant current mode in UHV: typical tunnel currents and tunnel voltages were 0.1–0.5 nA and 500–2000 mV, respectively (applied at the tip). The Pt/Ni atomic ratios of the single-crystal catalysts were estimated using an XPS system (SPECS PHOIBOS100 and XR50) that is attached to the above-mentioned UHV-MBE system. The surface compositions of the nML-Pt/PtxNi100-x(111) systems were estimated from the XPS results using the
8
𝑋 = 𝐼 ⁄𝑆
𝐼 ⁄𝑆 + 𝐼 ⁄𝑆 , (1)
where Ii is the area intensity of the Pt 4f and Ni 2p bands, and Si is the relative
sensitivity factor of Pt and Ni shown in the Casa XPS software. The XPS spectrometer was operated in fixed analyzer transition mode with a pass energy of 20 eV, and all spectra were recorded using unmonochromatized Mg Kα radiation. The integrated band intensities were estimated using the Shirley-type background correction.36
For the EC measurements, a RHE was used as the reference electrode, and all potentials in this paper are presented with respect to the RHE. Cyclic voltammetry (CV) curves of the model catalysts were recorded in N2-purged 0.1-M HClO4
(Ultrapure, Kanto Chemical) without sample disk rotation. Subsequently, linear sweep voltammetry (LSV) measurements were performed in O2-saturated 0.1-M HClO4 to
evaluate the ORR activities. The ORR activities described in this study are based on kinetic-controlled current densities (jk) at 0.9 V that were estimated from current
values using the Koutecky–Levich equation37 and from the geometrical surface areas
(GSA) of the single-crystal electrodes. The degradation of the model catalysts is discussed based on the changes in the jk values upon applying the PCs of a
square-wave signal for 3 s each at 0.6 and 1.0 V (ADT protocol defined by the Fuel Cell Commercialization Conference of Japan38) in an O
9
model catalysts were retransferred to the UHV-MBE system to observe the 1000 PC-induced topmost surface structural changes (via STM) and the Pt/Ni surface atomic ratio (via XPS) changes.
10
Results
Surface structures of nML-Pt/PtxNi100-x(111)
Figure 1 (a−i) summarizes the UHV-STM images of clean PtxNi100-x(111)
(before Pt epitaxial growth) and the nML-Pt/PtxNi100-x(111) model catalyst surfaces.
All the substrate surfaces have flat terraces with a 100-nm width; in the images of the nML-Pt/Pt50Ni50(111) and nML-Pt/Pt25Ni75(111) model catalyst surfaces, atomic scale
corrugations, called Moiré patterns, appeared. These periodic geometrical patterns stem from a lattice mismatch between the surface metal layers and the dissimilar metal or alloy substrate.39, 40 The Moiré patterns, shown in Figure 1, suggest that
uniform lateral strain with a long-range order (several tenth of nm) occurs on the topmost surface Pt(111) layer of nML-Pt/Pt50Ni50(111) and nML-Pt/Pt25Ni75(111).
Furthermore, the period of the Moiré patterns40 in the 2ML-Pt/Pt
xNi100-x(111)
decreases with the decreasing substrate Pt/Ni atomic ratios. This decrease in the period of the Moiré patterns corresponds to an increase in the surface compressive strain of the Pt(111) shell.40 Therefore, the surface compressive strains of the Pt shells
11
EC properties of the 2ML-Pt model catalysts
Figure 2 (a) shows the CVs for a series of 2ML-Pt/PtxNi100-x(111) model
catalyst surfaces. The voltammetric features of the hydrogen adsorption and desorption region (0.06−0.4 V) clearly show a decrease in the adsorption charges (QHupd) and negative shifts of the onset potentials of the adsorption reactions
compared with that of clean Pt(111) (dotted line). Such features are common for Pt3Ni(hkl),41 Pt–Co single-crystal alloys,42 and for our previously reported
Pt/Ni/Pt(111) sandwich-like alloy surfaces.32-34 With regard to the OH-related regions
(above 0.6 V), 2ML-Pt/Pt75Ni25(111) (red) has a symmetrically shaped CV with peaks
located at 0.85 V; this CV is potentially higher than that for clean Pt(111) (~ 0.8 V). In contrast, the redox features became asymmetrical for both 2ML-Pt/Pt50Ni50(111)
(blue) and 2ML-Pt/Pt25Ni75(111) (green). Furthermore, the onset potential for the OH
adsorption reactions significantly shifted to higher potentials compared with that of 2ML-Pt/Pt75Ni25(111), suggesting that the adsorption properties of oxygen-related
species of the 2ML-Pt model catalyst surfaces also depend on the substrate Pt/Ni atomic ratios.
Figure 2 (b) shows the LSV measurements for the ORR at 1600 rpm for the corresponding 2ML-Pt model catalyst surfaces. As a reference, the measurements for
12
UHV-cleaned Pt(111) are shown as a dotted line. The half wave potentials of 2ML-Pt/PtxNi100-x(111) largely shifted to higher potentials with decreasing substrate
Pt/Ni atomic ratios. The initial jk values for the pristine 2ML-Pt/Pt75Ni25(111),
2ML-Pt/Pt50Ni50(111), and 2ML-Pt/Pt25Ni75(111) surfaces were 9-, 15-, and 25-fold
larger than for Pt(111), respectively. Especially, the initial jk value (17.5 mA/cm2at 0.9
V) of the 2ML-Pt/Pt25Ni75(111) surface is comparable with the reported highest value
of 18 mA/cm2 at 0.9 V for Pt
3Ni(111)41. The EC stability of the 2ML-Pt/PtxNi100-x(111)
surfaces upon applying the PCs is summarized in Figure 2 (c). 2ML-Pt/Pt75Ni25(111)
retained 85% of the initial jk even after 1000 PCs. In contrast, jk values for both
2ML-Pt/Pt50Ni50(111) and 2ML-Pt/Pt25Ni75(111) surfaces decreased to approximately
half of their initial values after 500 PCs. 2ML-Pt/Pt50Ni50(111) exhibited further
activity deterioration from 500 to 1000 PCs, whereas a sharp increase in the jk value
was observed at 1000 PCs for 2ML-Pt/Pt25Ni75(111).
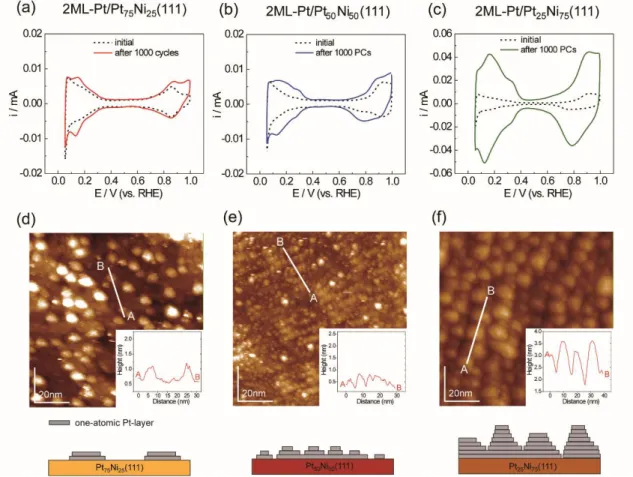
Figure 3 (a–c) shows the CV curves of the 2ML-Pt/PtxNi100-x(111) surface after
1000 PCs. The CV curves after 1000 PCs significantly enlarged relative to the corresponding initial curves, and the trend becomes clear with increasing substrate Pt/Ni ratio. In particular, the QHads for 2ML-Pt/Pt25Ni75(111) (Figure 3 (c)) significantly
13
for the other two surfaces. The UHV-STM images and corresponding line profiles of 2ML-Pt/PtxNi100-x(111) collected after 1000 PCs are summarized in Figure 3 (d–f). The
height modulations of the 2ML-Pt/Pt75Ni25(111) (d) and 2ML-Pt/Pt50Ni50(111) (e)
surfaces are less than 0.5 nm after applying 1000 PCs. In particular, as shown in (d), 2ML-Pt/Pt75Ni25(111) retained partially flat (111) terraces. In contrast, the
2ML-Pt/Pt25Ni75(111) surface (f) indicates that nanometer-sized mound-like structures
were present with more than 1-nm-high modulation. XPS spectra and the estimated Pt/Ni surface atomic ratios are summarized in Figure 4 and Table 1, respectively. The XPS results show that the Pt/Ni atomic ratios of 2ML-Pt/Pt50Ni50(111) and
2ML-Pt/Pt25Ni75(111) increased after 1000 PCs, indicating the dissolution of subsurface
Ni atoms during the PC process and resulting in the enrichment of Pt. In contrast, the surface Pt/Ni ratio of 2ML-Pt/Pt75Ni25(111) remained nearly the same.
EC properties of the 4ML-Pt model catalysts
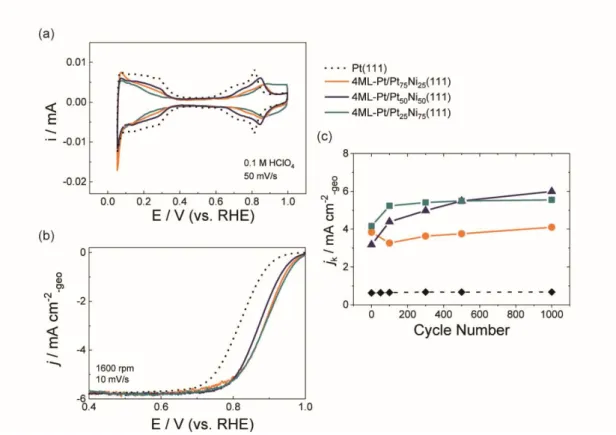
Figure 5 shows the CV (a), LSV (b), and changes in the jk values as a function
of the PCs applied (c) for the 4ML-Pt surfaces. The CV curves for the as-prepared surfaces revealed symmetrical redox shapes for both H-related (0.06−0.4 V) and OH-related (above 0.6 V) regions likely to clean Pt(111) although the order of the
14
onset potentials for OH adsorption changed compared with that for the 2ML-Pt catalysts (Figure 2(a)). The onset potentials for the OH adsorption of 4ML-Pt/Pt50Ni50(111) (violet) were most negative among the 4ML-Pt catalysts.
Similar to the onset potential trend (a), the half wave potential shifts (b), and initial jk
values vs. Pt(111) (c) are well corresponded: the initial activity enhancement factors for the 4ML-Pt/Pt75Ni25(111), 4ML-Pt/Pt50Ni50(111), and 4ML-Pt/Pt25Ni75(111)
surfaces were estimated to be five-, four-, and six-fold compared with that for clean Pt(111).Thecorrelations between the enhancement factors and substrate atomic ratios are different from those of the 2ML-Pt catalysts. For the EC surface stability shown in (c), all the 4ML-Pt/PtxNi100-x(111) surfaces showed relatively high EC stabilities
compared with the corresponding 2ML-Pt surfaces. In particular, the jk values of the
4ML-Pt/Pt50Ni50(111) and 4ML-Pt/Pt25Ni75(111) surfaces gradually increased with
increasing PCs.
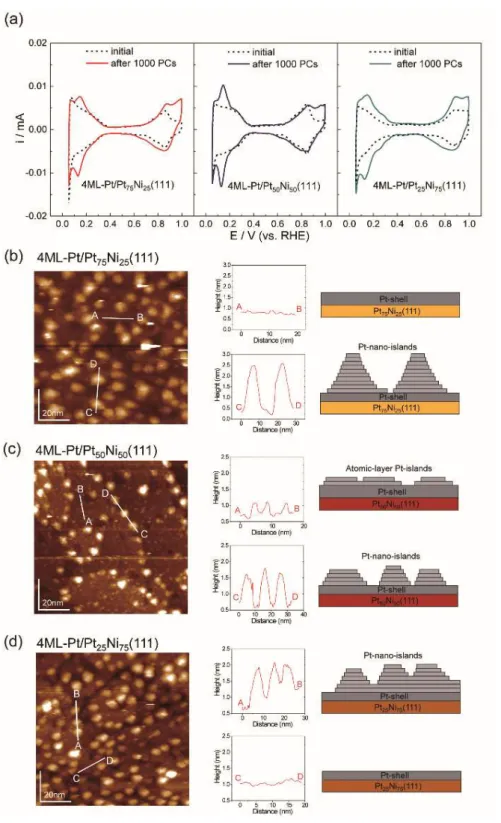
Figure 6 presents the CV curves (a) and corresponding STM images (b–d) for 4ML-Pt/PtxNi100-x(111) after 1000 PCs. Although all the 4ML-Pt surfaces showed
increases in current both for the hydrogen and hydroxyl regions, the increment trend is not significantly distinct from the 2ML-Pt catalysts. Based on the STM images, all the 4ML-Pt surfaces partially maintained (111) terraces even after 1000 PCs, accompanied
15
by the emergence of Pt islands that were approximately 10 nm in size and 1 nm in height. The PC-induced islands that resulted from migration of the surface Pt atoms segregated along the steps. Furthermore, the surface density of the islands that were less than 0.5 nm in height and less than 5 nm in size (line profile of A-B) was higher for the 1000 PC-applied 4ML-Pt/Pt50Ni50(111) surface (c) compared with the
4ML-Pt/Pt75Ni25(111) (b) and 4ML-Pt/Pt25Ni75(111) (d) surfaces. The surface
compositions of all the 4ML-Pt samples were altered according to the structural changes of the Pt layers shown in the STM images. As clearly shown in the XPS results (Figure 7 and Table 2), the surface Pt/Ni atomic ratios of all the 4ML-Pt decreased after 1000 PCs, particularly for the 4ML-Pt/Pt75Ni25(111). Figure 6 (b-c) indicate lots of Pt islands
were generated on the Pt(111)-shell terrace, suggesting that effective thickness of Pt(111)-shell terraces probably become thinner than the initials. Accordingly, the Pt/Ni atomic ratios evaluated by XPS might decrease in compared with the corresponding initials.
Activity trends of the 2ML- and 4ML-Pt model catalysts under PCs
The above-mentioned PC-induced activity trends for both the 2ML-Pt and 4ML-Pt catalysts should correlate with the surface compositional and morphological
16
changes. For the 2ML-Pt catalysts, the Pt/Ni ratios (Table 1) significantly increased after 1000 PCs, except for 2ML-Pt/Pt75Ni25(111). The results suggest that the Ni
atoms located very near to the topmost surfaces dissolved into the electrolyte during the PC application. Accordingly, the jk values (calculated for the EC current at 0.9 V
(ik)/GSA) significantly decreased for both the 2ML-Pt/Pt50Ni50(111) and
2ML-Pt/Pt25Ni75(111) surfaces. However, as shown in Table. 2, the PC-induced
decreases in the Pt/Ni atomic ratios near the surface regions are 50% for 4ML-Pt/Pt75Ni25(111), 18% for 4ML-Pt/Pt50Ni50(111), and 15% for
4ML-Pt/Pt25Ni75(111), respectively (Table 1). The results indicate that the Ni
concentration near surface regions increased because of the PCs. The reduction in Ni can be explained by the partial decrease in the Pt shell thickness and/or the segregation of substrate Ni atoms to the subsurface regions caused by the PC application.43 The CV and STM results shown in Figure 3 and 6 indicate that the
effective surface area for the ORR increased after 1000 PCs regardless of the Pt layer thickness. In general, changes in the effective surface area for Pt and Pt-based alloy electrocatalysts are discussed based on the electrochemical surface area (ECSA) estimated from QHupd and the standard charges for Pt(111) (240 μC/cm2).44 In this
17
alloys is generally low compared with that for pure Pt; this trend is significant for single-crystal Pt-based alloy surfaces.45 Therefore, we attempted to consider the
roughness factors (Rf) of the surfaces estimated from the corresponding STM images
(Figures 3 and 6). The estimated ECSA and Rf factors are summarized in Tables 1 and
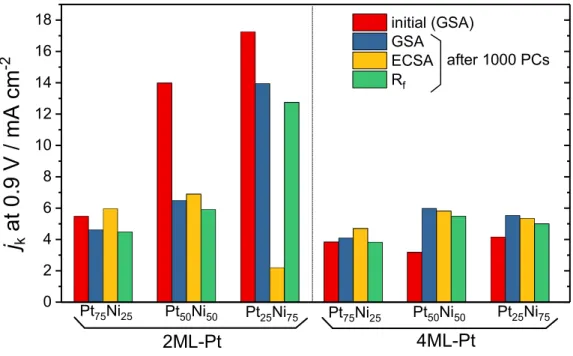
2, and the ECSA-, Rf-, and GSA-corrected jk values are compared in Figure 8. For
example, the estimated ECSA of 1000-PCs-2ML-Pt/Pt25Ni75(111) increased
approximately six times larger than that of the pristine surface area. In contrast, the increment for Rf is rather small (approximately larger by 1.1), i.e., the increase in Rf
induced by 1000 PCs is much lower than that estimated by the ECSA. The results showed that the real surface area of 2ML-Pt/Pt25Ni75(111) for ORR after 1000 PCs
significantly increased according to the ECSA. The poor atomic-level resolution of the STM image of the PCs-applied surface seems to result in an under-estimation of the real surface area. Nevertheless, the ECSA-corrected jk value is lower than one
sixth of the GSA-corrected jk value, revealing that the area-specific ORR activity of
2ML-Pt/Pt25Ni75(111) significantly decreased by applying 1000 PCs. For
2ML-Pt/Pt75Ni25(111) and 2ML-Pt/Pt50Ni50(111), because the increase in the ECSA is
moderate relative to 2ML-Pt/Pt25Ni75(111), the GSA-corrected jk and ECSA-corrected
18
GSA-corrected jk values after 1000 PCs regardless of using either the GSA or ECSA.
Therefore, the results indicate that either almost identical (4ML-Pt/Pt75Ni25(111)) or
slight activity increments (4ML-Pt/Pt50Ni50(111) and 4ML-Pt/Pt25Ni75(111)) (Figure
8) mainly originated from PCs-induced surface structural and/or chemical changes (the atomic arrangements of Pt and Pt/Ni atomic ratios).
The difference in the EC current in the region of hydrogen adsorption (0.08−0.45 V) between the initial and 1000 PC-applied 4ML-Pt/PtxNi100-x(111) surfaces
are summarized in Figure 9. For both 4ML-Pt/Pt75Ni25(111) and 4ML-Pt/Pt50Ni50(111),
the current peak at 0.13 V becomes prominent by applying 1000 PCs. In particular, this peak dominates a different CV curve for 4ML-Pt/Pt50Ni50(111); the intensity is 1.5
times higher than that of 4ML-Pt/Pt75Ni25(111). In contrast, 4ML-Pt/Pt25Ni75(111)
shows an increase in the EC current at approximately 0.25 V in addition to the peak at 0.13 V. The former broad (0.25 V) and latter sharp peaks (0.13 V) can be assigned to hydrogen adsorption on Pt(110) and Pt(100) sites, respectively.46 Therefore, considering
the different CV features shown in Figure 9, the PC-induced nm-sized islands on 4ML-Pt/Pt25Ni75(111) (Figure 6(d)) are mainly comprised of small (111) facets with
high step densities for the (110) and (100) sites. Although 4ML-Pt/Pt75Ni25(111) and
19
4ML-Pt/Pt75Ni25(111) is weaker than that for 4ML-Pt/Pt50Ni50(111). The intensity
difference for the peak at 0.13 V may be because of the difference in size distribution of the islands. The flat (of a few atomic layers in height) islands of 4ML-Pt/Pt50Ni50(111)
(white line of A-B in Figure 6(c) and right-hand side schematic model) should correlate with the peak intensity difference. We previously showed that electrochemically surface-roughened 1ML-Pt/Au(111) exhibited a higher ORR activity than the atomically flat pristine surface35 in which the topmost surface consists of Pt mounds with an
approximately 5-nm width and Pt(331)- or (332)-like surface atomic arrangements. Kuzume et al. reported a Pt(331) surface that exhibited the highest ORR activity among high-indexed Pt single-crystal surface systems.47 Independently, Hoshi and coworkers
studied the ORR activity of high-indexed Pt single-crystal surfaces and reported that the surface (110) steps for n(111)-(111) and the (100) steps for n(100)-(111) are active sites for ORR.48 Considering these published results, PC-derived Pt surface defects, such as
(110) and (100) steps, should primarily contribute to the activity increments of 4ML-Pt/PtxNi100-x(111) surfaces upon the application of PCs (Fig. 5). Liu et al.
investigated the activity trend for Pt–Pd alloy catalysts upon the application of PCs and showed a slight increase in the activity during the initial PC stage.49 These PC-induced
20
changes in the alloy catalyst surface morphologies observed in this study. Regardless, the results obtained in this study confirm the influences of the Pt/M atomic ratios of the core materials on the activity and the electrochemical stability of the surface Pt shell.
21
Discussion
The electrochemical stability of nML-Pt/PtxNi100-x(111) surfaces were
investigated in this study, and they depend on the Pt/Ni atomic ratios near the surface regions. For the 2ML-Pt catalysts, because the annealed Pt75Ni25(111) substrate surface
has a Pt-enriched atomic layer (Pt-skin) before post Pt-deposition41, the effective
thickness of the Pt shells should be thicker than the deposition thickness of 2 ML. Therefore, the topmost surface exhibits a higher electrochemical stability. As shown in Table 1, the surface Pt/Ni ratio of pristine 2ML-Pt/Pt75Ni25(111) was several times
higher than that of other 2ML-Pt samples. The UHV-STM image (Figure 3 (d)) indicates that the (111) terrace regions were retained even after 1000 PCs. Furthermore, the ECSA and Rf values are much smaller than for the other 2ML-Pt catalysts (Table 1).
The results support the thicker effective thickness of Pt in pristine 2ML-Pt/Pt75Ni25(111).
In contrast, the 1000 PCs caused over a 50% decrease in ECSA-corrected jk values for
2ML-Pt/Pt50Ni50(111) and 2ML-Pt/Pt25Ni75(111), accompanied by relatively high
islands densities (Figure 3 (e, f)) that were generated by underlying Ni atom dissolution during the PCs. The results suggest that the Pt–Ni alloy located just below the Pt shell layers in 2ML-Pt/PtxNi100-x(111) are easily exposed to the strong acid solution (0.1-M
22
deterioration process (PC-induced surface Pt atom migration and less-noble metal (M) dissolution) has been reported for Pt/Pd(111) and Pt/Ir(111) model catalysts with 2ML-Pt shells.51, 52 Thus, a Pt shell thickness of 2 MLs is insufficient from the view
point of durability for core–shell-type catalysts.
In contrast, all the 4ML-Pt/PtxNi100-x(111) surfaces exhibited a high durability
upon the PCs, suggesting that the 4ML-thick Pt shell is thick enough to prevent the dissolution of the Ni atom below the shell, and thereby, is suitable as a practical shell layer thickness. As shown in the STM images and CVs (Figure 6), although all the 4ML-Pt surfaces partially retained the (111) terraces after 1000 PCs, the islands exhibited different surface densities. This difference in the resultant surface structures may be owing to the difference in oxidation properties of the Pt shell surfaces. As-prepared 4ML-Pt/Pt50Ni50(111) (Figures 5(a) violet) exhibited butterfly-like curves
that peaked at 0.847 V in the CV. Corresponding redox peaks (Figures 5(a) orange and light blue) for 4ML-Pt/Pt75Ni25(111) and 4ML-Pt/Pt25Ni75(111) are weak and located at
slightly higher potentials (0.868 V and 0.887 V, respectively). The adsorption charges for oxygen-related species in the potential regions of the onset potential and at 1.0 V for the as-prepared 4ML-Pt/Pt50Ni50(111) are larger by approximately 15% and 8%
23
Consequently, the surface oxidation of the topmost Pt atoms on the 4ML-Pt/Pt75Ni25(111) and 4ML-Pt/Pt25Ni75(111) surfaces could be more suppressed
under the same PC conditions (0.6 V to 1.0 V). Furthermore, the surface symmetries of the underlying Pt–Ni alloy substrates may correlate with the differences in the PC-induced surface structures. As shown in the ideal models of the substrate surfaces under the Pt shells (top in Figure 1 (d–f)), the surface symmetries of the ideal surfaces of Pt75Ni25(111) and Pt25Ni75(111) are six-fold, honeycomb structures. In contrast, the
symmetry of Pt50Ni50(111) is a two-fold, striped structure. Because the topmost Pt(111)
epitaxial surface has a six-fold surface symmetry, the difference in the surface symmetries between the epitaxial Pt(111) and underlying PtxNi100-x(111) lattices should
influence the PC-induced topmost surface structural changes shown in Figure 6. Therefore, the underlying Pt/Ni atomic ratios and the surface symmetries of the Pt and Ni atomic arrangements modify the adsorption properties of the oxygen-related species (OHads, Oads), thereby determining the electrochemical stability (durability) of core–
24
Conclusions
We investigated the ORR activities and electrochemical stabilities of nML-Pt/PtxNi100-x(111) (n = 2 and 4; x = 75, 50, and 25) model electrocatalysts. The
initial ORR activities for the as-prepared 2ML-Pt/PtxNi100-x(111) surfaces were
enhanced upon decreasing the substrate Pt/Ni atomic ratios. In particular, 2ML-Pt/Pt50Ni50(111) and 2ML-Pt/Pt25Ni75(111) exhibit 20 and 25 times higher initial
ORR activity, respectively, compared with that for clean Pt(111). In contrast, the activity enhancement factors for the 4ML-Pt catalysts were approximately 4−6 fold; the enhancement factors became insensitive against the substrate Pt/Ni atomic ratios.
The electrochemical stabilities of the 2ML-Pt surfaces worsened with decreasing underlying Pt/Ni atomic ratios. However, for the 4ML-Pt catalysts, the initial activity slightly increased during PCs, suggesting that the 4ML-Pt is large enough to stabilize the core–shell structure, i.e., the suppression of the dissolution of M atoms, although the microscopic structural behaviors of the topmost Pt atoms were significantly modified by the Pt/Ni atomic ratios and surface symmetries of the substrates. This work demonstrates that the fine tuning of compositions and lattice structures of core–alloy and Pt shell thicknesses are crucial for developing Pt-based alloy catalysts with high ORR performances.
25
Acknowledgements
This study was supported by the New Energy and Industrial Technology Development Organization (NEDO) of Japan.
References
1 J. K. Nørskov, J. Rossmeisl, A. Logadottir, L. Lindqvist, J. R. Kitchin, T. Bligaard and H. Jónsson, J. Phys. Chem. B, 2004, 108, 17886-17892.
2 T. Toda, H. Igarashi, H. Uchida and M. Watanabe, J. Electrochem. Soc., 1999, 146, 3750-3756. 3 P. Strasser, S. Koh, T. Anniyev, J. Greeley, K. More, C. Yu, Z. Liu, S. Kaya, D. Nordlund, H.
Ogasawara, M. F. Toney and A. Nilsson, Nat. Chem., 2010, 2, 454-460.
4 J. Greeley, I. E. L. Stephens, A. S. Bondarenko, T. P. Johansson, H. A. Hansen, T. F. Jaramillo, J. Rossmeisl, I. Chorkendorff and J. K. Nørskov, Nat. Chem., 2009, 1, 552-556.
5 V. R. Stamenkovic, B. S. Mun, M. Arenz, K. J. J. Mayrhofer, C. A. Lucas, G. Wang, P. N. Ross and N. M. Markovic, Nat. Mater., 2007, 6, 241-247.
6 S. Koh and P. Strasser, J. Am. Chem. Soc., 2007, 129, 12624-12625.
7 P. Malacrida, M. Escudero-Escribano, A. Verdaguer-Casadevall, I. E. L. Stephens and I. Chorkendorff, J. Mater. Chem. A, 2014, 2, 4234-4243.
8 D. Wang, Y. Yu, J. Zhu, S. Liu, D. A. Muller and H. D. Abruña, Nano Lett., 2015, 15, 1343-1348.
9 C. Chen, Y. Kang, Z. Huo, Z. Zhu, W. Huang, H. L. Xin, J. D. Snyder, D. Li, J. A. Herron, M. Mavrikakis, M. Chi, K. L. More, Y. Li, N. M. Markovic, G. A. Somorjai, P. Yang and V. R. Stamenkovic, Science, 2014, 343, 1339-1343.
10 X. Huang, Z. Zhao, L. Cao, Y. Chen, E. Zhu, Z. Lin, M. Li, A. Yan, A. Zettl, Y. M. Wang, X. Duan, T. Mueller and Y. Huang, Science, 2015, 348, 1230-1234.
26
11 L. Gan, S. Rudi, C. Cui, M. Heggen and P. Strasser, Small, 2016, 12, 3189-3196.
12 B. Han, C. E. Carlton, A. Kongkanand, R. S. Kukreja, B. R. Theobald, L. Gan, R. O'Malley, P. Strasser, F. T. Wagner and Y. Shao-Horn, Energ. Environ. Sci., 2015, 8, 258-266.
13 D. Wang, Y. Yu, J. Zhu, S. Liu, D. A. Muller and H. D. Abruña, Nano Lett., 2015. 14 P. Moseley and W. A. Curtin, Nano Lett., 2015, 15, 4089-4095.
15 Y.-J. Deng, V. Tripkovic, J. Rossmeisl and M. Arenz, ACS Catalysis, 2016, 6, 671-676. 16 A. Schlapka, M. Lischka, A. Groß, U. Käsberger and P. Jakob, Phys. Rev. Lett, 2003, 91,
016101.
17 M. Mavrikakis, B. Hammer and J. K. Nørskov, Phys. Rev. Lett, 1998, 81, 2819-2822. 18 T. Bligaard and J. K. Nørskov, Electrochim. Acta, 2007, 52, 5512-5516.
19 P. Liu and J. K. Norskov, Phys. Chem. Chem. Phys., 2001, 3, 3814-3818. 20 B. Hammer and J. K. Nørskov, Advances in Catalysis, 2000, 45, 71-129.
21 Q. Li, L. Wu, G. Wu, D. Su, H. Lv, S. Zhang, W. Zhu, A. Casimir, H. Zhu, A. Mendoza-Garcia and S. Sun, Nano Lett., 2015.
22 Q. Jia, K. Caldwell, D. E. Ramaker, J. M. Ziegelbauer, Z. Liu, Z. Yu, M. Trahan and S. Mukerjee, J. Phys. Chem. C, 2014, 118, 20496-20503.
23 D. Wang, H. L. Xin, R. Hovden, H. Wang, Y. Yu, D. A. Muller, F. J. DiSalvo and H. D. Abruña, Nat. Mater., 2013, 12, 81-87.
24 C. Cui, L. Gan, M. Neumann, M. Heggen, B. Roldan Cuenya and P. Strasser, J. Am. Chem. Soc., 2014, 136, 4813-4816.
25 M. Oezaslan, F. Hasché and P. Strasser, J. Electrochem. Soc., 2012, 159, B394-B405.
26 C. Wang, M. Chi, G. Wang, D. van der Vliet, D. Li, K. More, H.-H. Wang, J. A. Schlueter, N. M. Markovic and V. R. Stamenkovic, Advanced Functional Materials, 2011, 21, 147-152. 27 Y.-J. Wang, N. Zhao, B. Fang, H. Li, X. T. Bi and H. Wang, Chemical Reviews, 2015, 115,
3433-3467.
28 Y. Liu, C. M. Hangarter, U. Bertocci and T. P. Moffat, J. Phys. Chem. C, 2012, 116, 7848-7862.
27
29 S. Axnanda, K. D. Cummins, T. He, D. W. Goodman and M. P. Soriaga, ChemPhysChem, 2010, 11, 1468-1475.
30 S. Kobayashi, M. Wakisaka, D. A. Tryk, A. Iiyama and H. Uchida, J. Phys. Chem. C, 2017, 121, 11234-11240.
31 J. Roques and A. B. Anderson, Surf. Sci., 2005, 581, 105-117.
32 N. Todoroki, Y. Asakimori and T. Wadayama, Phys. Chem. Chem. Phys., 2013, 15, 17771-17774.
33 T. Wadayama, N. Todoroki, Y. Yamada, T. Sugawara, K. Miyamoto and Y. Iijama, Electrochem. Commun., 2010, 12, 1112-1115.
34 N. Todoroki, Y. Iijima, R. Takahashi, Y. Asakimori and T. Wadayama, J. Electrochem. Soc., 2013, 160, F591-F596.
35 Y. Iijima, Y. Takahashi, K. Matsumoto, T. Hayashi, N. Todoroki and T. Wadayama, J. Electroanal. Chem., 2012, 685, 79-85.
36 D. A. Shirley, Physical Review B, 1972, 5, 4709-4714.
37 N. M. Marković, R. R. Adžić, B. D. Cahan and E. B. Yeager, J. Electroanal. Chem., 1994, 377, 249-259.
38 A. Ohma, K. Shinohara, A. Iiyama, T. Yoshida and A. Daimaru, ECS Trans., 2011, 41, 775-784.
39 J. Wintterlin and M. L. Bocquet, Surf. Sci., 2009, 603, 1841-1852.
40 M. Asano, R. Kawamura, R. Sasakawa, N. Todoroki and T. Wadayama, ACS Catalysis, 2016, 6, 5285-5289.
41 V. R. Stamenkovic, B. Fowler, B. S. Mun, G. Wang, P. N. Ross, C. A. Lucas and N. M. Markovic, Science, 2007, 315, 493-497.
42 M. Wakisaka, S. Morishima, Y. Hyuga, H. Uchida and M. Watanabe, Electrochem. Commun., 2012, 18, 55-57.
43 J. A. Herron and M. Mavrikakis, Catalysis Communications, 2014, 52, 65-71.
28
45 D. F. van der Vliet, C. Wang, D. Li, A. P. Paulikas, J. Greeley, R. B. Rankin, D. Strmcnik, D. Tripkovic, N. M. Markovic and V. R. Stamenkovic, Angewandte Chemie, 2012, 124, 3193-3196.
46 A. M. a. Gomez-Marin, R. Rizo and J. M. Feliu, Catalysis Science & Technology, 2014, 4, 1685-1698.
47 A. Kuzume, E. Herrero and J. M. Feliu, J. Electroanal. Chem., 2007, 599, 333-343. 48 A. Hitotsuyanagi, M. Nakamura and N. Hoshi, Electrochim. Acta, 2012, 82, 512-516.
49 W. Liu, P. Rodriguez, L. Borchardt, A. Foelske, J. Yuan, A. K. Herrmann, D. Geiger, Z. Zheng, S. Kaskel, N. Gaponik, R. Kotz, T. J. Schmidt and A. Eychmuller, Angew. Chem. Int. Ed., 2013, 52, 9849-9852.
50 B. E. Conway, Progress in Surface Science, 1995, 49, 331-452.
51 N. Todoroki, Y. Bando, H. Watanabe, Y. Tani and T. Wadayama, Electrochim. Acta, 2016, 212, 822-827.
52 N. Todoroki, H. Watanabe, T. Kondo, S. Kaneko and T. Wadayama, Electrochim. Acta, 2016, 222, 1616-1621.
29
Figure 1. UHV-STM images of clean PtxNi100-x(111) (x = 75, 50, and 25) (a–c) and the
30
Figure 2. Cyclic voltammograms recorded in N2-purged 0.1-M HClO4 (a), linear
sweep voltammograms for ORR recorded at 1600 rpm in O2-saturated 0.1-M HClO4
(b), and ORR activity changes upon applying PCs between 0.6 and 1.0 V in a 0.1-M HClO4 solution (c) for the 2ML-Pt/PtxNi100-x(111) surfaces
31
Figure 3. CV curves (a–c), UHV-STM images, and the corresponding line profiles and surface models (d–f) of 2ML-Pt/PtxNi100-x(111) after 1000 PCs
32
33
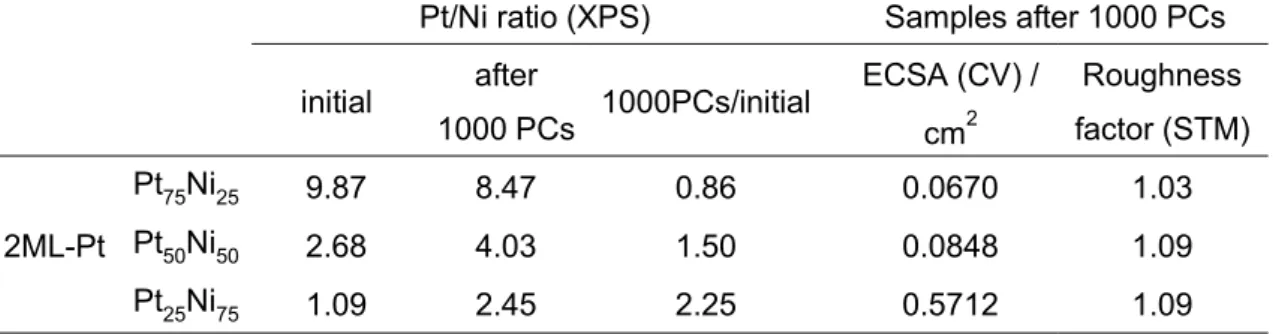
Table 1. ECSAs and roughness factors for the 2ML-Pt/PtxNi100-x(111) catalysts and
Pt/Ni surface atomic ratios estimated from the XPS results
Pt/Ni ratio (XPS) Samples after 1000 PCs
initial after 1000 PCs 1000PCs/initial
ECSA (CV) / cm2 Roughness factor (STM) 2ML-Pt Pt75Ni25 9.87 8.47 0.86 0.0670 1.03 Pt50Ni50 2.68 4.03 1.50 0.0848 1.09 Pt25Ni75 1.09 2.45 2.25 0.5712 1.09
34
Figure 5. Cyclic voltammograms (a), linear sweep voltammograms for ORR (b), and the ORR activity changes (c) for the 4ML-Pt/PtxNi100-x(111) surfaces
35
Figure 6. CV curves (a), UHV-STM images, and the corresponding line profiles and the surface models (b–d) of 4ML-Pt/PtxNi100-x(111) after 1000 PCs
36
37
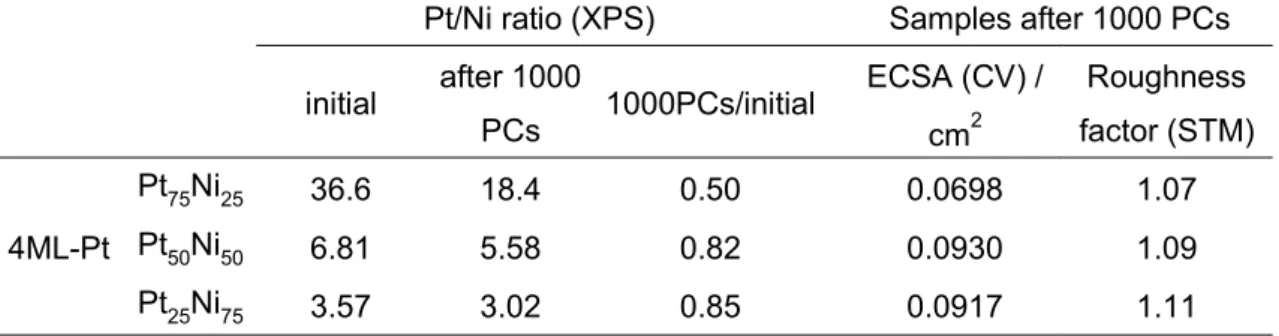
Table 2. ECSAs and roughness factors of the 4ML-Pt/PtxNi100-x(111) catalysts and
Pt/Ni surface atomic ratio estimated from the XPS results
Pt/Ni ratio (XPS) Samples after 1000 PCs
initial after 1000 PCs 1000PCs/initial
ECSA (CV) / cm2 Roughness factor (STM) 4ML-Pt Pt75Ni25 36.6 18.4 0.50 0.0698 1.07 Pt50Ni50 6.81 5.58 0.82 0.0930 1.09 Pt25Ni75 3.57 3.02 0.85 0.0917 1.11
38
Figure 8. GSA-, ECSA-, and Rf-corrected jk values at 0.9 V for the ORR
0 2 4 6 8 10 12 14 16 18 Pt75Ni25 Pt75Ni25 Pt25Ni75 Pt50Ni50 Pt25Ni75
j
ka
t
0
.9
V
/
m
A
c
m
-2 initial (GSA) GSA ECSA Rf after 1000 PCs Pt50Ni50 2ML-Pt 4ML-Pt39
Figure 9. Voltammetric current differences between the initial and 1000 PC surfaces in the hydrogen adsorption region for 4ML-PtxNi100-x(111)