Estimation of long-term external nutrient loading from watersheds to Lake
Biwa by a combined rainfall-runoff model and loading-discharge curve
approach
Huu Le Tien
1,2, Kenji Okubo
1, Phuong Ho Thi
3and Mitsuyo Saito
11Graduate School of Environmental and Life Science, Okayama University, Japan 2Faculty of Fisheries, University of Agriculture and Forestry, Hue University, Vietnam 3School of Chemical, Biological and Environmental Technologies, Vinh University, Vietnam
Abstract:
External nutrient loadings to Lake Biwa were estimated using a combined tank model and loading-discharge curve approach. The model was applied to collective drainage basins of the lake’s Imazu (northwest), Hikone (northeast), and Otsu (south) areas. The hourly model was conducted using particular discharges from Kita (Ado) river, Takatoki (Ane) river, and Yasu River to obtain loading curves for phosphate (PO4) and silica (SiO2) by assimilating measured
concentrations (2002–2003). The tank model was updated by adding an evapotranspiration routine and direct paths of groundwater discharges to the lake floor. The daily model was calibrated through analysis of water budget among the basin, inflow, lake and outflow, and then validated. The model was established and combined into a loading-discharge curve to determine the long-term external nutri‐ ent loadings entering the lake (1980–2017). Seasonal varia‐ tion in nutrient loadings increased during spring and summer and decreased during winter. Annual phosphate-phosphorus (PO4-P) loading ranged from 217 to 296 tons
yr–1 in the North Basin and 45 to 76 tons yr–1 in the South
Basin, while SiO2 loading fluctuated from 16,027 to 32,655
tons yr–1 and 2,518 to 5,490 tons yr–1 in the North and South
Basins, respectively.
KEYWORDS Lake Biwa; long-term external loading; rainfall-runoff model; loading-discharge curve
INTRODUCTION
Lake Biwa is the largest freshwater lake in Japan, pro‐ viding water resources to more than 14 million people in Western Japan (Kumagai, 2008). It is a body of water known worldwide for its massive sink of SiO2 (Goto et al.,
2007) and has been classified a phosphorus (P)-limited lake (Tezuka, 1986). The magnitude of the SiO2 sink is related
to the loading of P from the watershed of the lake (Goto et al., 2007). The external nutrient loading rate is one of the biogeochemical processes that affects nutrient-limited pri‐ mary production (Howarth, 1988), and this may lead to an
Correspondence to: Huu Le Tien, Graduate School of Environmental and Life Science, Okayama University, 3-1-1 Tsushima-Naka, Kita-ku, Okayama 700-8530, Japan. E-mail: [email protected]
expansion in SiO2 and P retention causing subsequent alter‐
ation of the aquatic ecosystem. According to a previous study, the ratio of groundwater leakage rate from the groundwater system into Lake Biwa to the loading from rivers is estimated to be more than 0.1 (Taniguchi and Fukuo, 1996). Therefore, to understand the nutrient cycle in the lake and the impact on algal biomass and phytoplankton community composition, evaluation of the long-term varia‐ tion in external nutrient loading to the lake needs to con‐ sider loading not only from rivers but also from ground‐ water (Ding et al., 2019; Longley et al., 2019). Previous work has reviewed the role of external loading to water quality or eutrophication status in Lake Biwa (Hsieh et al., 2011), analyzed the water quality of several rivers that flow into the lake (Kunimatsu and Kitamura, 1981; Taniguchi and Tase, 1999), and discussed the relationship between inflowing river water quality and the geological environ‐ ment of upstream areas (Morii et al., 1993). However, data on nutrient levels in rivers and groundwater flowing into the lake are sparse and assessments still lack a quantitative assessment of the long-term variation in external loadings. Furthermore, estimating nutrient loading from all rivers surrounding Lake Biwa requires a huge amount of spatial information and understanding of complicated processes. A loading-discharge curve simply provides the correlation between nutrient load (L) and water discharge (Q), which has been widely used for the estimation of nutrient trans‐ port (Galat, 1990; Alexander et al., 2002; Salvia-Castellví et al., 2005; Amano and Kazama, 2012). A rainfall-runoff model, that is a hydrological tank model, is commonly used for long-term runoff analysis and can represent flow distri‐ butions over a given time for each layer of the watershed area (Arifjaya et al., 2011). However, simultaneous applica‐ tion of combined rainfall data and loading curves for esti‐ mating long-term external nutrient loading including groundwater discharge has rarely been mentioned in previ‐ ous hydrological studies (Nakayama et al., 2011; Iwata et al., 2013). Therefore, this paper focuses on and discusses the applicability of a combination method, which includes the rainfall-runoff model and the L-Q curve approach to evaluate the long-term external nutrient loadings via sur‐ face and groundwater discharge into the Lake Biwa.
Received 2 June, 2020 Accepted 8 August, 2020 Published online 13 November, 2020
© The Author(s) 2020. This article is distributed under the terms of the Creative Commons Attribution 4.0 International License (http://creativecommons.org/ licenses/by/4.0/), which permits unrestricted use, distribution, and reproduction in any medium, provided you give appropriate credit to the original author(s) and the source, provide a link to the Creative Commons license, and indicate if changes were made.
METHODS
Lake Biwa consists of a monomictic North Basin (area: 616 km2, average depth: 45.5 m), and a warm polymictic
South Basin (area: 58 km2, average depth: 3.5 m) (Tezuka,
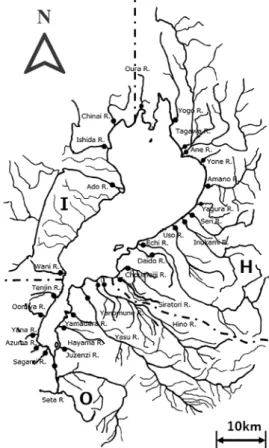
1992) that are surrounded by about 115 Class-A rivers of various sizes that flow into the lake (see Figure 1). Only the Seta River and the Kyoto Canal provide outflows from the lake. The collective basins were divided into three parts in this study, namely Otsu, Hikone and Imazu sub-basin. Dis‐ charges increase during snowmelt (March–April), the East‐ ern Asian summer monsoon (June–July), and the typhoon season (September–October).
Tank model
Hydrological tank models (Sugawara, 1979) were used to trace the local water cycle in and around Lake Biwa. The model includes four serial storage tanks, which is a simple and efficient method to convert rain into discharge and flux paths for nutrients. Each basin has been given different rainfall and evapotranspiration rates using meteorological data on precipitation and air temperature provided by the Ministry of Land, Infrastructure, Transport and Tourism (MLIT, 2020) at Otsu, Imazu, and Hikone, respectively. Because rainfall was considered uniform in each sub-basin,
Figure 1. The river systems of three catchments in Lake Biwa. Sampling rivers were divided into three catchments, Imazu (I), Hikone (H) in North Basin, Otsu (O) in South Basin. The filled circles indicate the class-A sampling rivers.
the local rain was given according to the areal fraction to the partial sum of sampling rivers in each sub-basin. The discharge from each tank is described as in Figure 2. Parameters of the models are presented in Table SI, SII. The fourth tank was diverted to connect to a certain depth of the lake floor. Evapotranspiration is incorporated via subtraction from the top tank. Runoff from the side outlets of a storage tank is proportional to water head over the out‐ let, and infiltration is proportional to the water depth. Water balance and its component can be described as:
△Q = Qin− Qout= dV /dt = SdH /dt (1) dℎ1/dt = P − E − q11− q12− p1 (2) q11= α11ℎ1− z11 (3) q12= α12ℎ1− z12; p1= β1ℎ1 (4) dℎ2/dt = p1− q2− p2 (5) q2= α2 ℎ2− z2; p2= β2ℎ2 (6) dℎ3/dt = p2− q3− p3 (7) q3= α3ℎ3− z3 ; p3= β3ℎ3 (8) dℎ4/dt = p3− q4 (9) q4= α4ℎ4 (10) Q = Qr+ Qg (11) Qr=
∑
1 3 qiA/Δt,Qg= q4A/Δt (12)where Q: discharge; Qr: river discharge; Qg: groundwater
discharge (m3 s–1). V: lake volume (m3); A, S: drainage and
lake surface areas (km2); H: water level of the lake (m); Δt:
Figure 2. Structure of the tank model. The surface dis‐ charge (q11 + q12), intermediate discharge (q2), sub-base dis‐
charge (q3), and base discharge (q4), p is infiltration to the
lower reservoir, α and β are the coefficients, h is the water level, z is the outlet height
time interval (hr and d); pi, qi: infiltration and discharge
(mm Δt–1); P, E: precipitation and evapotranspiration (mm
Δt–1); h
i: water depth of the tank; zi: the height of outlet
above the base of a tank; αi, βi: the runoff and infiltration
coefficient.
Following Dalton’s model (Korzukhin et al., 2011), evapotranspiration rate has been established as:
E = ρCEU es− ea / p (13)
where E: evapotranspiration rate (mm s–1); ρ: air density
(1.2 kg m–3); C
E: bulk coefficient; U: average wind speed
(m s–1); e
s, ea: saturated and actual water vapor pressure of
the air (hPa); p: air pressure (hPa), respectively. Because of difficulty in including wind speed, the factor CEU/p was
considered as a constant, which was adjusted to obtain the proper ratio of total evapotranspiration to total precipitation (rE) in equation (14).
Basic parameters are defined as:
rE= ΣE/ΣP; rG= ΣQg/ΣQr;RL= VLake/ΣQ/86400/365
(14) to check budgets in the fraction of river water, groundwater (rE, rG) and residence time of water (RL) in a year.
L-Q curve
In this study, we built the L-Q curve based on consistent hourly nutrient and discharge data. The relationship among instantaneous nutrient load L (g s–1), weight concentration
C (g m–3) and instantaneous discharge Q (m3 s–1) was
explored following the suggestion of Amano and Kazama (2012) as:
C = kQm (15)
Multiplying discharge with the above, the nutrient load is Ln= kQ
m + 1
= kQp (16)
where k, m, and p are the parameters for normalized dis‐ charge.
Q = Qr+ γQg /Q1 (17)
Equation (17) represents the dimensional intercept of the regime curve at Q = Q1, the unit discharge where Q1 is
taken to be 1 m3 s–1 so dimensionless discharge retains
dimensional value of one. In equation (16), the exponent p is close to unity and it is possible to separate the loading by groundwater discharge as:
Lg= kγQg (18)
The gamma (γ) is used to express extra loads due to groundwater discharge at the floor of the lake. There are three particular cases:
γ = 0: No extra loading other than rivers
γ = 1: No difference in concentrations with river water γ > 1: Higher concentrations in groundwater
Tsurumaki and Kobayashi (1989) reported that the PO4-P
concentration in groundwater at the three sites in Lake Biwa was more than 0.1 mg L–1. In this study, we assumed
that γ = 3 for PO4-P estimation and γ = 1 for SiO2 estima‐
tion.
Only 54 among the 115 rivers were selected as sampling sites during the 2002–2003 field surveys (Table SIII). A partial drainage area of sampled rivers in sub-basins was
summed up to 2,002 km2, which represents around 63% of
the total drainage area of 3,601 km2. PO
4 and SiO2 were
determined using a colorimeter for the three sub-basins bimonthly: July (preliminary), September (50 points), and November (53 points) of 2002; January (50 points), March (54 points), May (53 points), and July (55 points) of 2003 during a project run by the Ministry of Environment (Harashima et al., 2006). Discharge corresponding with sampling time in the rivers was calculated as Qi = (Ai/AN)/
QN using an hourly scale tank model where Qi, Ai, AN and
QN are calculated discharge, sampling area, sub-basin area
and initial discharge, respectively. Instead of 155 basin-wise models given individual river discharges, we consid‐ ered a virtual river of the sub-basin that was calculated for the partial discharge of the individual sampling river in which nutrient concentrations were measured.
The tank model (on a daily-basis) was set up to evaluate long-term inflow discharge (1980–2017) and temporal changes in water level. The difference between outflow or runoff in Equation (1) from the North Basin to the South Basin and runoff of Otsu sub-basin can be compared to the measured water level of the lake to determine water bal‐ ance and the reliability of the model. Measured water level data were collected from 1991 to 2015 at Mihogasaki sta‐ tion (South part).
Evaluation criteria
Statistical parameters were used to quantify model per‐ formance: the Nash–Sutcliffe efficiency coefficient (NSE), the percentage of bias (PBIAS), and root mean squared error- observations standard deviation ratio (RSR) (Gupta et al., 2009; Moriasi et al., 2007). The respective equations were set as follows:
NSE = 1 − ∑ Qobs− Qcal
2 ∑ Qobs− Qobs 2 (19) RSR = ∑1n Qobs− Qcal 2 ∑1n Qobs− Qobs 2 (20) PBIAS = ∑1 n Q obs− Qcal ∑1nQobs × 100 (21)
where Qobs is the observed discharge, Qcal is the calculated
discharge, Qobs is the mean observed discharge, and n is the
total number of observations.
RESULTS AND DISCUSSION
The hourly model calculation was established using hourly streamflow data across 2 years, 2002 and 2003 (Figure 3). The calibration period was from July 11 of 2002 until December 31 of 2002 and the validation period from January 1 until July 31 of 2003. Due to the limited avail‐ ability of discharge data in the catchment surrounding Lake Biwa, observation data obtained from MLIT focused on the Yasu river for the Otsu sub-basin, Kita river of the Ado river for the Imazu sub-basin, and Takatoki river of the Ane river for the Hikone sub-basin. Precipitation at Otsu, Imazu, and Hikone were used in the model based on the standard precipitation R and is expected to represent the
average of local precipitation ri and Σ(ri/rmi) = R/Rm. Statis‐
tical analyses revealed acceptable performance of the tank models during the calibration period at the Otsu station (NSE = 0.7, RSR = 0.29, PBIAS = 9.7%), Imazu station (NSE = 0.98, RSR = 0.01, PBIAS = 14.9%) and Hikone station (NSE = 0.9, RSR = 0.09, PBIAS = 13%). The NSE, RSR, and PBIAS values during the validation period for the North basin at Imazu station were 0.98, 0.01 and 9.4%, respectively. The corresponding values for Hikone were 0.91, 0.08 and –5.0%, respectively. Meanwhile, the valida‐ tion values at Otsu were 0.78, 0.22, and –3.6%, respec‐ tively. Early peaks in floods were generally only evident in the calculated hydrograph.
The second approach focused on estimating the dis‐ charge from 2002 to 2003 using an hourly model to investi‐ gate the L-Q curve. The concentration of PO4 and SiO2
were plotted against instantaneous discharge. The external loading to Lake Biwa was assessed using the L-Q curve equation in Figure 4, which exemplifies a basic component Figure 3. The hourly tank model application as a hydro‐ graph for each catchment: (a) Otsu, (b) Imazu, (c) Hikone from July of 2002 until July of 2003
of PO4 and SiO2 that was identified in the three rivers’ sys‐
tems around Lake Biwa. The relationship between the hourly river discharge and nutrient loading is shown in Figure 4. From this regression, the mean L was calculated from the mean Q. Furthermore, the result showed that the incline of the SiO2 line was greater than that of PO4. These
results reveal the equation for calculating loading based on discharge as: Otsu sub-basin: L1= 0.0789Q1 0.9893 (R2= 0.95) (22) L2= 11.709Q10.9602 (R2= 0.98) (23) Imazu sub-basin: L1= 0.0509Q20.9804 (R2= 0.98) (24) L2= 10.787Q20.9735 (R 2= 0.99) (25) Hikone sub-basin: L1= 0.0719Q3 0.9833 (R2= 0.98) (26) L2= 10.364Q30.9794 (R2= 0.99) (27)
Total three sub-basins:
L1= 0.0656Q0.9842 (R2= 0.97) (28)
L2= 10.674Q0.9692 (R2= 0.99) (29)
where L1 is PO4 load, L2 is SiO2 load, and Q, Q1, Q2, Q3 are
the total discharge, partial discharges at Otsu, Imazu, and Hikone, respectively.
After establishing the loading L-Q curve as equations (28) and (29) for a total of 3 sub-basins, the riverine nutri‐ ent loadings were estimated. The nutrient discharge from Imazu and Hikone sub-basins were used to integrate the external nutrient inflows into the North basin of Lake Biwa. Meanwhile, the nutrient loadings into the South basin were based on the calculation from the Otsu station. Ferguson (1986) mentioned that a loading method that uses a log-log Figure 4. The loading curve for PO4 and SiO2 which were
regarded as unified for these nutrients. The correlation coeffecients between L and Q were R2 = 0.99 (SiO
2) and
R2 = 0.97 (PO 4)
loading curve can underestimate a river’s loads from a sta‐ tistical point of view. However, the log-log equation was found to minimize the deviation from the logarithmic data set, although a negligible scattering exists about the regres‐ sion equation in the low region for PO4 and SiO2 as illus‐
trated in Figure 4. Each straight line, which indicates a regression equation, fits the distribution well. The load-flow relationship for SiO2 was higher than PO4 indicating
the sensitivity of PO4 to water discharge.
The runoff rates (mm d–1) into the North and South
basins were estimated and compared with the water level in Lake Biwa. The performance of the daily scale model with respect to the simulated water level was further examined using statistical criteria applied to the calibration and vali‐ dation periods. Model calibration and validation statistics, which compared observed and simulated water levels for the daily time intervals, are displayed in Table SIV. Daily water level data across 13 years (1991 to 2003) were used to calibrate the remaining data from 2004 to 2015 and to validate the model performance (Figure S1). The calibra‐ tion and validation periods indicated that the simulated water level matched well with observations. A statistical comparison revealed NSE, RSR and PBIAS indices for the calibration (0.98, 0.15, and –0.01%) and validation (0.94, 0.25, and 0.25%) periods. The performance is in a ‘good’ category for both cases according to Moriasi et al. (2007).
The L-Q curve and the daily tank model were used to estimate external nutrients into Lake Biwa and establish the water budget. The annual river budget was 3.1 km3 yr–1,
while the annual groundwater budget was 0.8 km3 yr–1
(Table I). Fujino (1980) estimated the river and ground‐ water inflows to be 3.02 km3 yr–1 and between 1 and
1.5 km3 yr–1, respectively. Figure 5a shows that the esti‐
mated annual PO4-P (converted from PO4) loading
increased from 1980, dropping in 1994 due to the drought in the region, and then fluctuated after 2000. Meanwhile, SiO2 loading fluctuated from 1980, decreased in 1994 and
1998, and then increased afterwards. PO4-P loading into the
North basin of Lake Biwa ranged from 217 to 296 tons yr–1
while loading in the south part averaged around 63 tons
yr–1, ranging from 45 to 76 tons yr–1. PO
4-P loading in the
North basin is also considered as a source of nutrients for the South basin. According to Nagare et al. (2001), P mass measured from 1995 to 2000 was around 190 to 340 tons, and the output of P occupied 15% of the total budget (North and South Basin). In this study, the total PO4-P load‐
ing from the river in the North basin accounted for 81% of the total PO4-P loading. In addition, Goto et al. (2007)
reported that the inflow discharge of silica was calculated to be 25,000 tons yr–1, while the output was approximately
Figure 5. Long-term annual variation (a) and seasonal vari‐ ation (b) of nutrient loading into Lake Biwa
Table I. PO4-P and SiO2 loading from rivers and groundwater and the water budget in Lake
Biwa
Unit Otsu Imazu Hikone Lake Biwa
Drainage area km2 613 673 1,915 674
Precipitation mm yr–1 1,604 1,907 1,628 1,640
Evapotranspiration mm yr–1 563 610 501 771
PO4-P loading tons yr–1 63 61 211
SiO2 loading tons yr–1 5,490 7,290 17,464
River water km3 yr–1 0.5 0.8 1.8 Groundwater km3 yr–1 0.1 0.2 0.5 Annual yields km3 yr–1 0.6 1.0 2.3 rE = ΣE/ΣP 0.35 0.32 0.31 rG = ΣQg/ΣQr 0.20 0.25 0.28 RL yr 5.8
5,000 tons yr–1. These findings are lower than our estima‐
tion of 30,244 tons yr–1 of average SiO
2 inflow, with 82%
of the annual SiO2 input to the watershed from loading of
the North part where it ranged from 16,000 to 33,000 tons yr–1. SiO
2 loading from the South ranged from 2,500 to
8,000 tons yr–1. The estimation for the SiO
2 sink repre‐
sented by Goto et al. (2013) showed that 20,000 ton SiO2
yr–1 was retained in Lake Biwa, which accounts for 80% of
the annual inflow.
Figure 5b shows the estimated seasonal change in nutri‐ ent loading from rivers and groundwater. Loadings increased from March to June and reached a maximum in July, then decreased in winter. Agricultural practices such as the application of fertilizers and tillage might be one of the most important reasons for increasing nutrient loadings in rivers and groundwater during the spring and summer seasons. The rainy period from the beginning of June to late July, and also the typhoon periods in September and October contributed to the increased nutrient loading into Lake Biwa. We hypothesized that the PO4-P and SiO2 dis‐
charges into Lake Biwa by rivers and groundwater flowing into the western area of the lake were smaller than those in the eastern areas and southeast areas. The difference in geo‐ logical environments, land use, population density, and agricultural activities were the key criteria for our classifi‐ cation into 3 separate sub-basins. Nutrient loading in Hikone (western side) was the highest, while PO4-P loading
in Imazu (eastern side) was lowest and SiO2 loading was
lowest in Otsu (southern side). We suggest that the urban‐ ized and farmland areas give rise to higher loads of nutri‐ ents than forested area. Detailed analysis of interrelation‐ ships between the long-term variations in external nutrient loadings and nutrient cycling in the lake are tasks for the future.
CONCLUSIONS
In the present study, the long-term external nutrient load‐ ing into Lake Biwa was described by the combination of a hydrological tank model and L-Q curve in three steps. The hourly tank model was calibrated on a discharge basis by replacing central rain data with local rain. The local dis‐ charges of individual rivers were used to establish loading curves which were then used for estimating the total dis‐ charge of each sub-basin. The exponents of loading curves were close to unity, which suggests the load is proportional to the discharge (step 1). The daily tank model was cali‐ brated on a water-level basis and the stage-discharge rating curve for the outflow (1991–1995) showed that it was highly controlled and less varied. The second model was validated using water level data (1991–2015) under natural outflow conditions. Evapotranspiration and groundwater discharge were also considered (step 2). The daily-basis tank model was extended (1980–2017) and established to determine the long-term external nutrient loadings into the lake and were also used to analyze water budgets among the catchments. The results revealed that nutrient loadings increased during spring and summer and decreased during winter. Annual PO4-P loading ranged from 217 to 296 tons
yr–1 in the North Basin and 45 to 76 tons yr–1 in the South
Basin, while SiO2 loading fluctuated from 16,027 to 32,655
tons yr–1 and 2,518 to 5,490 tons yr–1 in the North and South
Basins, respectively.
ACKNOWLEDGMENTS
This work was supported by the Grant for Encourage‐ ment of Students, Okayama University (No. 7772). We thank Okayama University graduate students for sample collection and M. Murakami for data compilation during the research process.
SUPPLEMENTS
Figure S1. Daily water level from 1991 to 2015 showing the calibration period (1991–2003) and validation period (2004–2015)
Table SI. Parameters of the tank model (hourly scale) Table SII. Parameters of the tank model (daily scale) Table SIII. Dimensions of the divided sub-basins
Table SIV. Daily calibration and validation results of water level
REFERENCES
Alexander R, Elliott AH, Shankar U, McBride GB. 2002. Estimat‐ ing the sources and transport of nutrients in the Waikato River Basin, New Zealand. Water Resources Research 38: 4-1–4-23. DOI: 10.1029/2001wr000878.
Amano A, Kazama S. 2012. Relationship between Discharge and Nutrient Concentration in Inundation Areas in Cambodia. Journal of Water and Environment Technology 10: 165–175. DOI: 10.2965/jwet.2012.165.
Arifjaya NM, Kusmana C, Abdulah K, Prasetyo LB, Setiawan BI. 2011. Application of Tank Model for Predicting Water Bal‐ ance and Flow Discharge Components of Cisadane Upper Catchment. Jurnal Manajemen Hutan Tropika 17: 63–70. DOI: 10.7226/jmht.17.2.63-70.
Ding Y, Xu H, Deng J, Qin B, He Y. 2019. Impact of nutrient loading on phytoplankton: a mesocosm experiment in the eutrophic Lake Taihu, China. Hydrobiologia 829: 167–187. DOI: 10.1007/s10750-018-3830-6.
Ferguson RI. 1986. River Loads Underestimated by Rating Curves. Water Resources Research 22: 74–76. DOI: 10.1029/WR022i001p00074.
Fujino Y. 1980. Water budget. In An introduction to Limnology of Lake Biwa, Mori S (ed). Kyoto, Japan; 19–26 (in Japanese). Galat DL. 1990. Seasonal and long-term trends in truckee river
nutrient concentrations and loadings to pyramid lake, Nevada: a terminal saline lake. Water Research 24: 1031– 1040. DOI: 10.1016/0043-1354(90)90126-Q.
Goto N, Iwata T, Akatsuka T, Ishikawa M, Kihira M, Azumi H, Anbutsu K, Mitamura O. 2007. Environmental factors which influence the sink of silica in the limnetic system of the large monomictic Lake Biwa and its watershed in Japan. Biogeo‐ chemistry 84: 285–295. DOI: 10.1007/s10533-007-9115-1. Goto N, Azumi H, Akatsuka T, Kihira M, Ishikawa M, Anbutsu
K, Mitamura O. 2013. Highly efficient silica sink in monomictic Lake Biwa in Japan. Annales de Limnologie 49: 139–147. DOI: 10.1051/limn/2013045.
Gupta HV, Kling H, Yilmaz KK, Martinez GF. 2009. Decomposi‐ tion of the mean squared error and NSE performance crite‐ ria: Implications for improving hydrological modelling. Journal of Hydrology 377: 80–91. DOI: 10.1016/j.jhydrol. 2009.08.003.
Harashima A, Kimoto T, Wakabayashi T, Toshiyasu T. 2006. Verification of the silica deficiency hypothesis based on bio‐ geochemical trends in the aquatic continuum of Lake Biwa-Yodo River-Seto Inland Sea, Japan. Ambio 35: 36–42. DOI: 10.1579/0044-7447-35.1.36.
Howarth RW. 1988. Nutrient limitation of net primary production in marine ecosystems. Annual Review of Ecology and Sys‐ tematics 19: 89–110. DOI: 10.1146/annurev.es.19.110188. 000513.
Hsieh CH, Sakai Y, Ban S, Ishikawa K, Ishikawa T, Ichise S, Yamamura N, Kumagai M. 2011. Eutrophication and warm‐ ing effects on long-term variation of zooplankton in Lake Biwa. Biogeosciences 8: 1383–1399. DOI: 10.5194/ bg-8-1383-2011.
Iwata S, Endo T, Inoue T, Yokota K, Okubo Y. 2013. Runoff characteristics of nutrient loads from small rivers − Case of the Hamada river, Aichi Prefecture. Journal of Japan Society on Water Environment 36: 39–47. DOI: 10.2965/ jswe.36.39.
Korzukhin MD, Kolosov PA, Semenov SM. 2011. Applying Dalton’s law of potential evaporation rate over the territory of Russia and neighboring countries using long-term obser‐ vation data. Russian Meteorology and Hydrology 36: 786– 793. DOI: 10.3103/S1068373911120028.
Kumagai M. 2008. Lake Biwa in the context of world lake prob‐ lems. SIL Proceedings, 1922–2010 30: 1–15. DOI: 10.1080/03680770.2008.11902076.
Kunimatsu T, Kitamura G. 1981. Phosphorus balance of Lake Biwa. SIL Proceedings, 1922–2010 21: 539–544. DOI: 10.1080/03680770.1980.11897038.
Longley KR, Huang W, Clark C, Johnson E. 2019. Effects of nutrient load from St. Jones River on water quality and eutrophication in Lake George, Florida. Limnologica 77: 125687. DOI: 10.1016/j.limno.2019.125687.
Moriasi DN, Arnold JG, Van Liew MW, Bingner RL, Harmel RD, Veith TL. 2007. Model evaluation guidelines for systematic quantification of accuracy in watershed simulations. American Society of Agricultural and Biological Engineers
50: 855–900. DOI: 10.13031/2013.23153.
Morii F, Matsumura-Inoue T, Tanaka Y. 1993. Relationship between the Water Quality of River Waters Flowing into Lake Biwa and the Geological Environment of the River‐ heads. Japanese Journal of Limnology (Rikusuigaku Zasshi) 54: 3–10. DOI: 10.3739/rikusui.54.3.
Nagare H, Somiya I, Fujii S, Morita M. 2001. Phosphorus mass-quantity change in Lake Biwa. Water Science and Technol‐ ogy: Water Supply 1: 49–56. DOI: 10.2166/ws.2001.0020. Nakayama K, Abuliz A, Nakaegawa T, Maruya Y. 2011. Evalua‐
tion of nutrient flux from Shiretoko into the ocean using MRI-GCM. Hydrological Research Letter 5: 47–51. DOI: 10.3178/HRL.5.47.
Salvia-Castellví M, Iffly JF, Borght PV, Hoffmann L. 2005. Dis‐ solved and particulate nutrient export from rural catchments: A case study from Luxembourg. Science of the Total Envi‐ ronment 344: 51–65. DOI: 10.1016/j.scitotenv.2005.02.005. Sugawara M. 1979. Automatic calibration of the tank model.
Hydrological Sciences Bulletin 24: 375–388. DOI: 10.1080/02626667909491876.
Taniguchi M, Fukuo Y. 1996. An effect of seiche on groundwater seepage rate into Lake Biwa, Japan. Water Resources Research 32: 333–338. DOI: 10.1029/95WR03245.
Taniguchi M, Tase N. 1999. Nutrient discharge by groundwater and rivers into Lake Biwa, Japan. Proceedings of IUGG 99 Symposium HS3, July 1999, Birmingham, UK; 67–73. Tezuka Y. 1986. Does the seston of Lake Biwa release dissolved
inorganic nitrogen and phosphorus during aerobic decompo‐ sition? Its implication for eutrophication. Ecological Research 1: 293–302. DOI: 10.1007/BF02348686.
Tezuka Y. 1992. Recent Trend in the Eutrophication of the North Basin of Lake Biwa. Japanese Journal of Limnology (Rikusuigaku Zasshi) 53: 139–144. DOI: 10.3739/rikusui. 53.139.
The Ministry of Land, Infrastructure, Transport and Tourism. 2020. Water information system- Observatory search from map. http://www1.river.go.jp/cgi-bin/SelectMapSite.exe. Last access May 28, 2020.
Tsurumaki M, Kobayashi M. 1989. Interaction of Lake and groundwater – Case study of Lake Biwa. Journal of Geography (Chigaku Zasshi) 98: 139–163. DOI: 10.5026/ jgeography.98.2_139.