Decline of the Footwear Industry in Japan and
the United States as a Result of the Global
Shift in Production
著者
YAMAMOTO Shun-ichiro
雑誌名
The science reports of the Tohoku University.
7th series, Geography
巻
53
号
1/2
ページ
57-74
発行年
2004-03
URL
http://hdl.handle.net/10097/45264
57
Decline of the Footwear Industry in Japan and the United
States as a Result of the Global Shift in Production
Shun-ichiro YAMAMOTO
Abstract Since the 1970s, the primary production bases of footwear in the
world have been shifted from the developed countries to the developing
coun-tries, particularly China and the Southeast Asian countries. In Japan and the
United States, the severe decline in footwear production has been caused by the
inflow of imports from China. This global production shift has been prompted
by the locational behavior of multinational corporations. Major footwear
companies in the US have allocated their production bases to East and
South-east Asia, particularly China and Indonesia. Although Japanese companies
continue production through domestic subsidiaries in the country, major
com-panies have simultaneously made subcontracts with factories in China,
In-donesia and Hong Kong. The acquisition of the competitive advantage in the
high value-added production is the only way to oppose the cheap and abundant
labor in the developing countries and ensure the survival of footwear industry
in the developed countries. However, as they have not succeeded, the footwear
production in the two countries is still continuing with a tendency toward
severe decline.
Key words : footwear industry, high value-added production, industrial
tion policy, Japan, the United States
1. Introduction
Since the 1970s, the world economy has entered into a stage referred to as the age
of globalization. The industrial structure of the world has greatly changed with an
intensification of international competition. The production system has changed from
mass production to diverse types and small-scale production along with the
diversification of consumer orientation in the market in developed countries. With
regard to production, increased thoroughness in terms of efficiency has become a
requisite for survival in the global competition, and most industries in the developed
countries have been oriented toward high value-added production. On the other hand,
* Research Student, Institute of Geography, Graduate School of Science, Tohoku University,
Sendai 980-8578, Japan
Science Reports of Tohoku University, 7th Series (Geography) Vol. 53, Nos. 1/2, March, 2004, 57-74
as globalization of the economy progresses, the mass production system, particularly that of daily consumer goods, has increasingly shifted to East and Southeast Asia due to abundant cheap labor. Furthermore, even the flexible manufacturing system has been steadily shifting its bases from the developed countries to the developing coun-tries. The rapid growth of the footwear industry in the ASEAN countries and China, following the newly industrializing economies (NIEs), has become a serious threat to the manufacturing industry in the developed countries. The development of a new and competitive flexible manufacturing system is required in order for the developed countries to sustain their manufacturing.
This paper examines the process of the decline of footwear industry in Japan and the United States as a case of the decline of the daily consumer goods industry in the advanced countries. The paper is divided into five sections including the section of introduction. The second section presents an overview of the footwear production in the world followed by the structural changes in the footwear industries in the two countries. The third section presents the characteristics of footwear imports in the two countries and the differences in the locations of manufacturing subsidiaries between the Japanese multinational corporations and ones of the US. The fourth section examines the effects of industrial activation policy executed in the US in the latter half of 1970s, particularly with regard to the influence of the policy on a domestic industry. The concluding section presents the progress of the footwear industry in the developed countries.
The sources of data in this paper are mainly industrial statistics and material of the related industrial unions in the two countries. Moreover, the annual reports and financial statements of each US and Japanese enterprise are used as the data respec-tively. The footwear referred to in this paper includes three types, leather, rubber and plastic.
2. Changes in the Footwear Industry in Japan and the United States due to the global shift in footwear production
2.1. Drastic change in the spatial distribution of the global footwear production
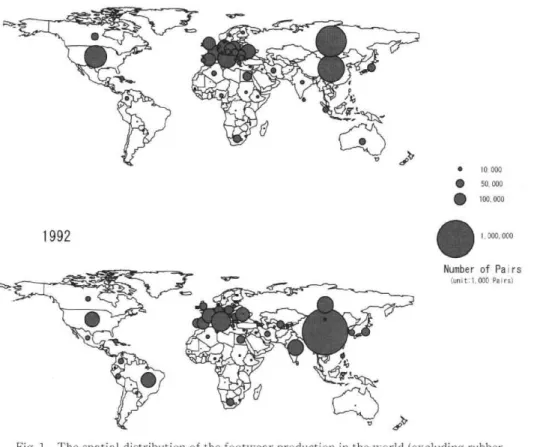
Figure 1 shows the global distribution of the footwear production, excluding rubber footwear". In 1980, the Soviet Union was the largest footwear-producing country. It accounted for 19.0% of the global footwear production. Following the Soviet Union, China, the US and Italy accounted for 14.4%, 9.6% and 7.8% of the global production, respectively. However, in 1992, the production in China increased rapidly and it became the largest producer, accounting for 38.4% of the global production. As a result, the footwear production in the developed countries suddenly decreased. For example, the proportion of the US production dropped to 3.9%. To sum up, the
Decline of the Footwear Industry in Japan and the United States as a Result of the Global Shift in Production 59 1981 Fig.
lir Aii--
AiL14 .4 ...".... ' -• AAL•41,„Loltift.
4-, , •
ir-Aii,w•Zw141111.-
401.74Tple
Ilanegiatilri • 1.1.1')
.t9i1=, v
AI
f404Pu.
_
141* tempi
Stir
`'. eirl
p..
/4b
,t..., v jp • 10.000 • 50. 000 • 100.000 1992 1. 000. 000 Number of Pairs -....lit. ... 7:7 .! --(unit 1 ,000 Pairs)iscook.
.PA604+eralattill 11.1704
'1
411APIR"P
-`17.-
*11%., 14,44136111tti
V "V
Aso
;01;1 qafll er
,
Olt
Ille
,0
‘,...,,
r3
,. v1 The spatial distribution of the footwear production in the world (excluding rubber footwear)
Source : Industrial Commodity Statistics Yearbook, Production Statistics, United
Nations.
footwear industries in the world have shifted their bases to China due to the preference
for a low labor cost.
Table 1 presents the international comparison in terms of wage per hour in the
leather footwear industry. The wage disparities between the developed and the
developing countries are surprisingly large. The wage level in the US was seven-fold
that in Mexico in 1990. The wage level in Southeast Asian countries is lower than
that in Mexico. Although the data for China could not be obtained, the wage level in
that country is assumed to be lower than that in Southeast Asia. With the
intensification of international competition, these wage level disparities resulted in the
shifting of the footwear production bases to China and Southeast Asia.
Table 1 The international comparison in terms of wage per hour in leather footwear industry
Country or Area Belgium Denmark United States France United Kingdom Italy Korea Taiwan Hong Kong Mexico Brazil Thailand Indonesia 1985 $7.39 6.97 7.27 6.15 5.12 5.59 0.95 1.20 2.00 1.12 0.65 0.35 0.20 1990 $14.92 15.30 8.75 12.29 10.74 13.43 2.62 * 3.20 1.34 * *
Note : The sign * means unknown.
Source : The Bureau of Labor Statistics, US ment of Labor.
Depart-Footwear production in Italy has maintained a high ratio of 7.8% in 1980 and 7.0% in 1992. This implies that original fashions in Italy make a high value-added production possible. Moreover, the proportion of the footwear production in Western Europe such as in France, the UK and Spain has also remained high. The market shares in 1980 and 1992 were 5.1% and 3.8% in France, 3.23% and 1.02% in UK, and 3.48% and 2.55% in Spain, respectively.
2.2. Structural changes in the footwear industry in Japan and the US
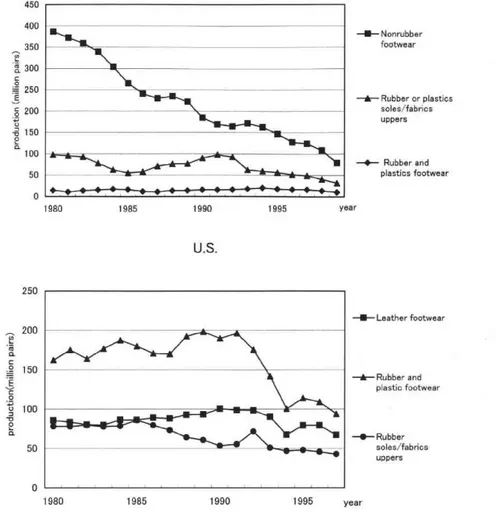
As shown in Fig. 2, the production of leather footwear rapidly decreased in the US after 1980. The overall production of rubber/plastic footwear also tended to be on the decrease. In Japan, the production of rubber/plastic footwear has rapidly decreased since 1993. Although the leather footwear production had shown a tendency to increase during the 1980s, it drastically decreased after 1991.
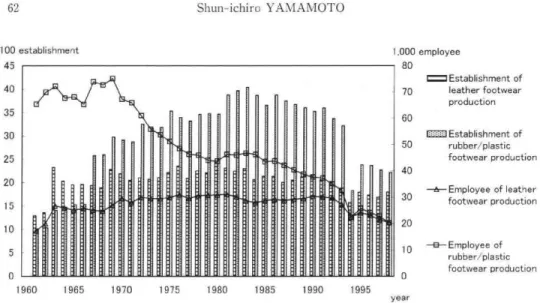
Figure 3 shows the number of establishments and employees in the footwear industry in Japan during the period 1961 to 1998. The number of employees in the rubber/plastic shoes industry suddenly decreased from the latter half of the 1960s to
Decline of the Footwear Industry in Japan and the United States as a Result of the Global Shift in Production 61 450 400 350 300 E 250 g 200 -2, 150 Fc2, 100 50 0 —A-- Nonrubber footwear
—A— Rubber or plastics soles/fabrics uppers —0— Rubber and plastics footwear 1980 1985 1990 1995 year U.S. 0 .49 0 O a 250 200 150 100 50 0 —M— Leather footwear
—&— Rubber and plastic footwear —0— Rubber soles/fabrics uppers 1980 1985 1990 1995 year Fig. 2 The transision of footwear production in Japan and the United States
Sources : Census of Manufactures, Industrial Statistics Office, Research and Statistics Department, Ministry of Economic, Trade and Industry in Japan.
Current Industrial Reports, the Census Bureau, US Department of Commerce.
the latter half of the 1970s. This trend implies that the rubber/plastic footwear industry in Japan had increasingly shifted to other Asian countries. On the other hand, the number of employees in the leather footwear industry did not decrease until the early 1990s. In comparison with the rubber/plastic footwear industry, the leather footwear industry requires high-grade technologies and expensive materials. There-fore, it was relatively difficult to transfer the production of leather footwear industries to the developing countries.
On the other hand, the number of establishments did not show a considerable decrease. A large portion of the establishments are considered to be small-scale
100 establishment 45 40 35 30 25 20 15 10 5 0 1960 1965 1970 1975 1980 1985 1990 1995 1,000 employee 80 =Establishment of 70 60 50 40 30 20 1' 0 year leather footwear production =Establishment of rubber/plastic footwear production —A—Employee of leather footwear production 10—8—Employee of rubber/plastic footwear production
Fig. 3 The number of establishment and employee in the footwear industry in Source : Census of Manufactures, Industrial Statistics Office, Research and
Department, Ministry of Economic, Trade and Industry in Japan.
Japan Statistics
Table 2 The production capacity of leather footwear in Japan and the United States in 1997
Number of Number of establishment employee Employee Value of per shipments establishment (S1,000) Value added by manufacture (S1,000) Value added per employee ($1,000) Japan 1,689 21.392 13 2,910,877 1,077,081 50.3 IJnited States 349 29,492 85 3,157,955 1,597,749 54.2
Note : The Japanese value is caluculated in the exchange rate, 1$ =Y120.99 in 1997. The numerical value in the U.S. does not include any kid's footwear and athletics footwear.
Source : Census of manufactures 1997, Industrial Statistics Office, Economic and Industrial Policy Bureau, Ministry of Economy, Trade and Industry in Japan.
Footwear Production-1997, Current Industrial Reports, the Census Bureau, US Department of Commerce.
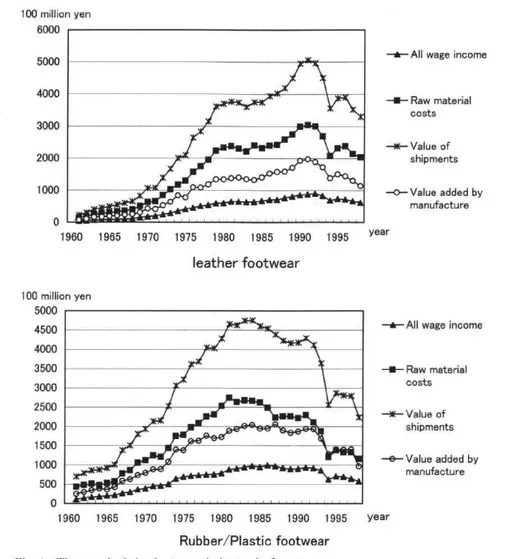
subcontractors. However, the number of leather footwear establishments suddenly decreased after the burst of the bubble economy in 1991. Figure 4 indicates the total amount of wages, raw materials, manufacturing goods shipment, and the value-added in the leather and the rubber/plastic footwear industry. The amount of the manufac-turing goods shipment in the leather footwear industry had reached a peak in the year
1991, and that in the rubber/plastic footwear had reached a peak in the year 1980. Furthermore, the amount of the value-added had also been decreasing since the year 1991. This suggests that it was difficult to maintain a steady high value-added production in the developed countries.
Decline of the Footwear Industry in Japan and the United States as a Result of the Global Shift in Production 63 100 million yen 6000 5000 4000 3000 2000 1000 0
—A—All wage income
—s— Raw material costs --NC— Value of shipments —0—Value added by manufacture 1960 1965 1970 1975 1980 1985 1990 1995 leather footwear year 100 million yen 5000 4500 4000 3500 3000 2500 2000 1500 1000 500 0
—a—All wage income
—s— Raw material costs —w— Value of shipments —e—Value added by manufacture 1960 1965 1970 1975 1980 1985 1990 1995 year Rubber/Plastic footwear
Fig. 4 The trend of the footwear industry in Japan
Source : Census of Manufactures, Industrial Statistics Office, Research and Statistics Department, Ministry of Economic, Trade and Industry in Japan.
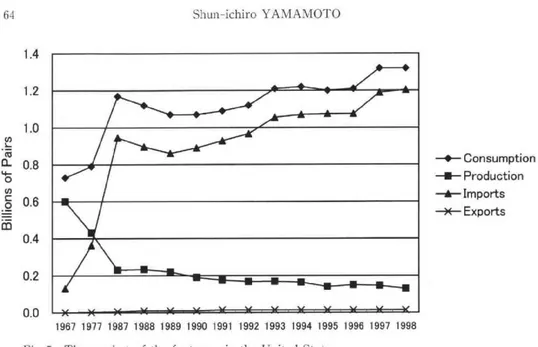
five-hold that in the US. The number of employees per establishment in Japan and the US were 13 and 85, on an average, respectively. However, the amount of the value-added per employee was $50,000 in Japan and $54,000 in the US. The difference in the value-added per employee between the two countries was small despite the large disparity in the average number of employees per establishment. It can be pointed out that the productivity of the US in the footwear industry is lower than that of Japan2). On the other hand, the total amount footwear consumption tends to gradually increase in the US (Fig. 5) . The amount of footwear imports has remarkably increased since
1.4 1.2 1 .0 0.8 0.6 0.4 0.2 0.0 Fig U, L " cIf CL 4— 0 cr) c 0 = 1:1-5 —40— Consumption —s— Production —A— Imports —x— Exports 1967 1977 1987 1988 1989 1990 1991 1992 1993 1994 1995 1996 1997 1998 5 The market of the footwear in the United States
Source : Current Highlights of the Nonrubber Footwear Industry, Footwear tries of America.
the late 1960s. The dependence rate of the imports to the consumption reached approximately 80% in the late 1980s.
3. The characteristics of footwear imports in Japan and the United States
Table 3 lists export countries classified by the amount of footwear imports and the average price of the footwear imported in Japan and the United States in 1999. Chinese products occupied a large part of the imports in the two countries. In terms of average price of the product, the imports from the East and Southeast Asian countries such as China and Indonesia were low-priced (Chinese and Indonesian
products priced at $6.2 and $9.3, respectively, in the US), while imports from the advanced countries such as Italy and Britain were generally high-quality goods (Italian and British products priced at $24.5 and $34.1, respectively, in the US). Japan also shows a similar tendency. The price difference between the low-grade and the high-quality products is approximately ten-fold. In addition, footwear in the US is primarily imported from China followed by countries from the American continent such as Brazil, Mexico, the Dominican Republic and Canada. Japan primarily imports from China followed by Southeast and East Asian countries.
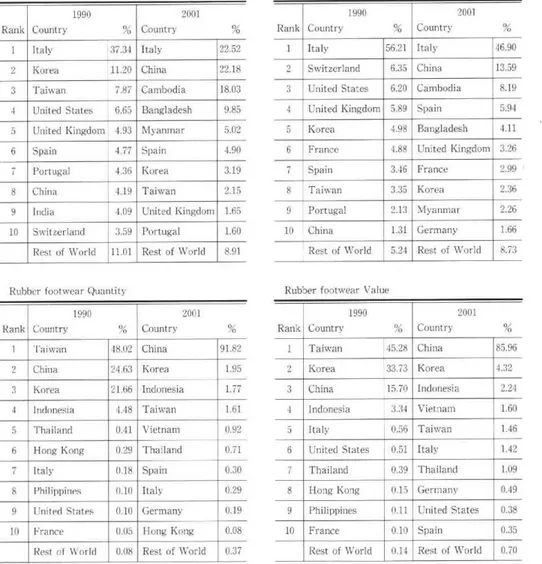
Furthermore, Table 4 indicates the change in the main export countries to Japan (the ten best) from 1990 to 2001. In the case of leather footwear, the share of the developed countries in terms of import quantity was higher in 1990. Italy, in particu-lar, occupied approximately 37% of the total amount of imports in quantity and 56%
Decline of the Footwear Industry in Japan and the United States as a Result of the Global Shift in Production 65
Table 3 The list of main export countries classified by the amount of footwear imports in Japan and the United States in 1999 (the ten best)
United States Rank 1 2 3 4 5 6 7 8 9 10 country China Brazil Indonesia Italy Thailand Spain Taiwan Mexico Hong Kong United Kingdom Rest of World Total
The amount of footwear Th
e share (%) imports (1 ,000 pairs) 984,847 83,777 63,340 46,484 18,759 17,895 12,562 12,309 7,165 6,930 75.5 6.4 4.9 3.6 1.4 1.4 1.0 0.9 0.5 0.5 51,195 1,305,262 3.9 100.0 Average price per pairs (dollar)
6.9 11.2 9.3 24.5 12.7 17.6 6.2 17.0 7.0 34.1 18.1 8.8 Japan Rank 1 2 3 4 5 6 7 8 9 10 country China Indonesia Korea, South Taiwan Italy USA Vietnam Thailand Philippines Spain Rest of World Total
The amount of footwear Th
e share (%) imports (1 ,000 pairs) 339,415 22,481 11,322 10,559 4,790 3,864 3,808 3,326 2,789 1,872 82.3 5.5 2.8 2.6 1.2 0.9 0.9 0.8 0.7 0.5 8,124 412,354 2.0 100.0 Average price per pairs (dollar)
5.1 3.2 18.5 5.2 56.0 27.1 11.1 9.9 5.3 21.3 24.9 6.7 Note : The Japanese average value is caluculated in the exchange rate, 1$ = Y113.9 in 1999.
Source : Statistical Reporter, American apparel and footwear association in the US. Trade Statistics, the Customs and Tariff Bureau, Ministry of Finance in Japan.
in value. However, in 2001, as the ratio of the Chinese imports rapidly increased, Italy's share decreased to 23% in quantity. Moreover, Asian countries other than China, Cambodia, Bangladesh and Myanmar also increased their shares in the quantity of imports. However, in terms of value, the ratio of Italy remained high in 2001. The
Table 4 The change Leather footwear Quantity
in the main export countries to Japan from 1990 to
Leather footwear Value
2001
Country
(the ten best)
Rank 1 2 3 4 5 6 7 8 9 10 1990 °X 1 Italy Korea Taiwan United States United Kingdom Spain Portugal China India Switzerland Rest of World 37.34 11.20 7.87 6.65 4.93 4.77 4.36 4.10 4.09 3.59 11.01 Country 2001 Rank Italy China Cambodia Bangladesh Myanmar Spain Korea Taiwan United Kingdom Portugal Rest of World 22.52 1 22.18 2 18.03 9.85 4 5.02 5 4.90 6 3.19 7 2.15 8 1.65 9 1.60 10 8.91 Country 1990 Italy Switzerland United States United Kingdom Korea France Spain Taiwan Portugal China Rest of World 56.21 6.35 6.20 5.89 4.98 4.88 3.46 3.35 2.13 1.31 5.24 Country 2001 Italy China Cambodia Spain Bangladesh United Kingdom France Korea Myanmar Germany Rest of World 46.90 13.59 8.19 5.94 4.11 3.26 2.99 2.36 2.26 1.66 8.73
Rubber footwear Quantity Rubber
2001 footwear Value Rank 1 2 4 5 6 7 8 9 to Country 1990 Taiwan China Korea Indonesia Thailand Hong Kong Italy Philippines United States France Rest of World 48.02 24.63 21.66 4.48 0.41 0.29 0.18 0.10 0.16 0.05 0.08 Country Rank China Korea Indonesia Taiwan Vietnam Thailand Spain Italy Germany Hong Kong Rest of World 91.82 1 1.95 2 1.77 3 1.61 4 0 92 5 0 71 6 0.30 7 0.29 8 0.19 0.08 10 0.37 Country 1990 Taiwan Korea China Indonesia Italy United States Thailand Hong Kong Philippines France Rest of World 45.28 33.73 15.70 3.34 0.56 0.51 0.39 0.15 0.11 0.10 0.74 Source : Finance Country 2001 China Korea Indonesia Vietnam Taiwan Italy Thailand Germany United States Spain Rest of World 85.96 4.32 2.24 1.60 1.46 1.42 1.09 0.49 0.38 0.35 0.70
The Customs Clearance Statistics, The Customs and Tariff Bureau, Ministry of in Japan.
ratios of Italy and China were 47% and 14% respectively. On the developed countries, Italy is only one that has succeeded in being the main exporter by achieving high value-added production. Thus, Italy maintained the primary position in terms of the value of imports although its share in the quantity of imports had decreased consider-ably. Among the developed countries, Italy produces the most fashionable products.
On the other hand, in the case of rubber/plastic footwear, Taiwan and Korea, in
Decline of the Footwear Industry in Japan and the United States as a Result of the Global Shift in Production 67
addition to China, were the primary exporting countries to Japan in 1990. However, Chinese products overwhelmed the market in terms of both quantity (91.8%) and value (86.0%) in 2001. That is, Chinese products hold an unchallenged position with regard to imports. In the case of the high-quality products, Western European products, particularly those from Italy, still occupy the majority of the market. In other words, the polarization of production into high-quality goods and low-priced goods is accelerating in the import market of the developed countries. It is assumed that the footwear industries in the Western European countries are challenging the difficult self-transformation in order to accomplish the high value-added production through conversion of the sales strategy, shortening of lead time, and so on. They are focusing on a high-quality product market in the developed countries in order to avoid direct competition with developing countries such as China.
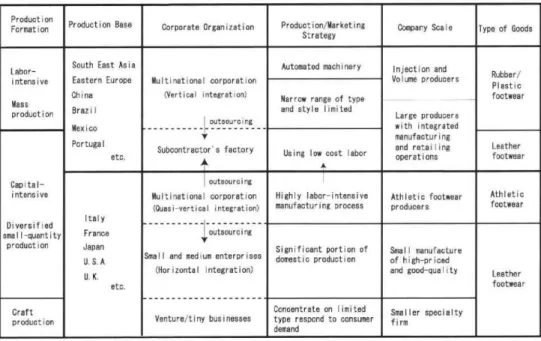
With regard to the shift of the footwear industry from the developed countries to the developing countries, Fig. 6 indicates a concept chart concerning the international division of labor in the footwear industry on a worldwide scale. Incidentally, the classification of the footwear industry in this table is based on the US International Trade Commission. The production bases of the labor-intensive segment have pri-marily shifted to China and Southeast Asia. Most of their products are manufactured by the factories exploited under the corporate control of a vertical integrated
organiza-Production Formation Labor-intensive Mass Production Capital- intensive Diversified small-quantity production Craft production Production Base
South East Asia Eastern Europe China Brazil Mexico Portugal etc. Italy France Japan U. S.A U.K. etc. Corporate Organization Multinational corporation (Vertical integration)
„froutsourcing
Subcontractor's factory outsourcing Multinational corporation (Quasi-vertical integration) outsourcingSmall and medium enterprises (Horizontal integration)
Venture/tiny businesses
Production/Marketing Strategy
Automated machinery
Narrow range of type and style limited
Using low cost labor
Highly labor-intensive manufacturing process
Significant portion of domestic production
Concentrate on limited type respond to consumer demand Company Scale Injection and Volume producers Large producers with integrated manufacturing and retailing operations Athletic footwear producers Small manufacture of high-priced and good-quality Smaller specialty firm Type of Goods Rubber/ Plastic footwear Leather footwear Athletic footwear Leather footwear
tion centered on a multinational corporation. The design of and materials for the production are usually limited and these characteristics lead to mass production. Their features are suitable for the production of rubber/plastic footwear. Recently, a quasi-vertical integrated product system for the arrangement of the subcontract factories in Southeast Asia is being promoted by a multinational corporation in the field of athletics footwear.
On the other hand, the high value-added products (fashionable leather footwear) continue to be manufactured in the developed countries, primarily in Italy. Most small and medium-sized establishments in the developed countries are also continuing to discover the optimum method of achieving sustainable high value-addition. In addition, production by artisans such as customized and handmade goods exist in niche markets. However, despite the endeavors of footwear industries in the developed countries, high value-added production is gradually shifting to China and Southeast Asia. Small and medium-sized businesses in the developed countries find it difficult to compete with their counterparts in the developing countries, despite improvements such as a system of social division of labor and diversified small-quantity production.
With regard to the global shift of footwear production, the direct investments of multinational corporations in the developing countries are a decisive factor. In other words, the multinational corporations in the developed countries exploit the abundant and cheap manpower in the developing countries. The production in China and Southeast Asia is based chiefly on OEM (Original Equipment Manufacturer). There-fore, it is necessary to investigate the actual production organizations of the multi-national corporations, particularly in the field of athletic footwear. Table 5 shows the locations of the manufacturing subsidiaries of major Japanese and US footwear companies.
Five Japanese enterprises continue to hold domestic manufacturing subsidiaries ; three have traded with the subcontractor factories in China, Indonesia, and Hong Kong. On the other hand, all enterprises in the US are relocating their production bases to the East and Southeast Asia, particularly to China and Indonesia. These enter-prises depend on abundant cheap manpower of the East and Southeast Asia.
4. Limitations of the Industrial Support Policies in the US Footwear Industry
In order to promote the high value-added production in the footwear industry, the
US government had implemented various industrial support policies in the 1980s.
However, these policies had not been successful in arresting the trend of the decline of
the domestic footwear industry. This chapter examines the limitations of these
policies. The government policies are roughly divided into two. One is a trade
Decline of the Footwear Industry in Japan and the United States as a Result of the Global Shift in Production 69
Table 5 The location of the manufacturing subsidiaries of major Japanese• and US
footwear companies Japanese enterprise Mizuno Asics Achilles Okamoto Sekaicho Ruhher Sales (million yen) 155926 1 26449 108428 70671 24417
The component ratio of the sales golf 29.72% sportswear 22.14% sports shoes 7.48%, others 23.62%, sports shoes 54.3% sportswear 27.2% others 20.6% plastics 32.72% shoes 30.82% industrial materials 32.81% others 3.65% building/industrial materials 26.98% tire 22.75% footwear 20.04% medical/household goods 14.34% plastics/film 11.27% others 4.63% footwear 78.6% chemicals 21.4% Domestic manufacturing subsidiary Mizuno Runbird (Yamasaki, Hyogo Pref.)
Sanin Asics industry (Sakaiminato, Tottori Pref.) Barco Achilles Shimane (Yokota, Shimane Pref.) Okamoto Sewing (Ono, Fukushima Pref.) Tokuyama Sekaicho (Nanyo, Yamaguchi) The overseas manufacturing subsidiary Jiang Su Ai Shi Ke Si enterprise (China)
Guang Zhou Chong footwear enterprise (China) P.T. Surya Achilles donesia De In-Okamoto enterprise (Hong Kong) Year on the data 20)11 2001 2000 1995 1996 US enterprise Nike Reebok Tim berland Genesco Converse Sales (million dollar) 9489 2993 1092 747 209
The component ratio of the sales
footwear 62.12% apparel 30.53%
equipment and other 7.35% footwear 69.54% apparel 30.46%
footwear 77.5% apparel and accessories 22.5% footwear 100% footwear 61.39% apparel 38.61% Domestic manufacturing bases Nashville, Tennessee (Close down in 2003) Close down in 2001 The overseas manufacturing bases China, Indonesia, Vietnam, Thailand, others China, Indonesia, Thailand, Hong Kong, Taiwan, South Korea China Taiwan, Europe, Mexico, South and Central America
China, Italy, Mexico Brazil, Indonesia Taiwan, U.K.
China, Taiwan, Macau Vitnam, Indonesia Year on the data 2001 2001 2000 2002 2000 Source : Security
Asset Securities Reports in and Exchange Commission,
Japanese Companies. Form 10-K in the US.
stimulate a domestic industry. This section discusses the latter policy, evaluating its influence on the domestic footwear industry.
"Footwear Industry Revitalization Program 1980" is one of the i
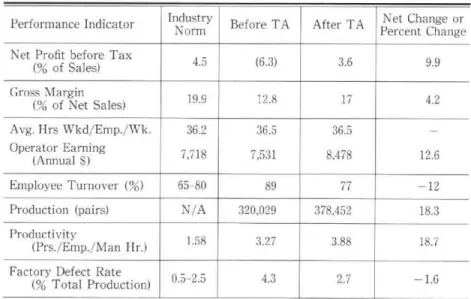
ndustrial policies on the footwear industry, passed in July 1979. This program had been advanced by three organizations : Economic Development Administration, Office of Productivity, Technology and Innovation, and International Trade Administration. They were affiliated to the US Department of Commerce. In the beginning, from 1978 to 1980, these organizations had invited applicants for support. The number of establishments that applied for this program was 126. Finally, 100 establishments were selected by the management consultation of the Department of Commerce and were supported by a grant-in-aid of 58 million dollars. In addition, a footwear expert team was orga-nized with the aim of achieving an improvement in the productive efficiency in a certified establishment. As a result of their assistance, the productive efficiency, which included a pure margin increase, the reduction of manufacturing cost, the improvement in productivity and the decrease in defective goods, increased greatly. Table 6 shows the change in the productive efficiency in a certified establishment before and after technological assistance in 1980. Almost all the factors of productive efficiency were improved, although the amount of output per hour remained unchanged. Furthermore, the expert team executed the export promotion program in order to increase exports.
Table 6 The change in the productive efficiency in a certified establishment before and after technological assistance in 1980
Performance Indicator
Net Profit before Tax (% of Sales) Gross Margin (% of Net Sales) Avg. Hrs Wkd/Emp./Wk. Operator Earning (Annual $) Employee Turnover (%) Production (pairs) Productivity (Prs./Emp./Man Hr.)
Factory Defect Rate (% Total Production) Industry Norm 4.5 19.9 36.2 7,718 65-80 N/A 1.58 0.5-2.5 Before TA (6.3) 12.8 36.5 7,531 89 320,029 3.27 4.3 After TA 3.6 17 36.5 8,478 77 378,452 3.88 2.7 Net Change or Percent Change 9.9 4.2 12.6 —12 18.3 18.7 —1 .6
Source : Footwear Industry Revitalization Program 1980, Annual Progress Report, US Department of Commerce.
Decline of the Footwear Industry in Japan and the United States as a Result of the Global Shift in Production 71
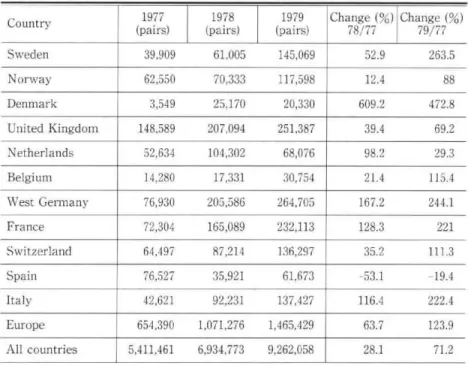
After elaborate marketing researches on potential export countries, the team decided on the creative US fashion style, and the certified establishments actively participated in events such as the execution and the fashion show in the European countries. The program was successful, despite the initial skepticism of the govern-ment and the industrial association about this. As shown in Table 7, the exports to Europe increased by 124% for three years from 1977 to 1979. The exports to Sweden, West Germany, France, and Italy increased both in amount and growth rate.
In addition, the development of a new technology was continuously encouraged. Firstly, to achieve a unique technological development for gaining a competitive advantage in the domestic footwear industry, CAD and CAM were introduced. Moreover, the latest equipment such as the forepart pulling, lasting, and bottoming machines with numerical control, automatic bottom cementing machines, tackless insole attaching machines, injection molding machines, and so on were introduced. As a result, improvement in productivity was accomplished and labor cost was reduced. Secondly, the program brought about an improvement in design and implemented a new marketing method in order to improve the existing technology and to trigger technological innovation. Finally, in order to provide training opportunities to the
Table 7 The export markets in US footwear industry (1977-1979)
Country Sweden Norway Denmark United Kingdom Netherlands Belgium West Germany France Switzerland Spain Italy Europe All countries 1977 (pairs) 1978 (pairs) 1979 (pairs) 39,909 61,005 145,069 62,550 70,333 117,598 3,549 25,170 20,330 148,589 207,094 251,387 52,634 104,302 68,076 14,280 17,331 30,754 76,930 205,586 264,705 72,304 165,089 232,113 64,497 87,214 136,297 76,527 35,921 61,673 42,621 92,231 137,427 654,390 1,071,276 1,465,429 5,411,461 6,934,773 9,262,058 Change (%) 78/77 Change (%) 79/77 52.9 263.5 12.4 88 609.2 472.8 39.4 69.2 98.2 29.3 21.4 115.4 167.2 244.1 128.3 221 35.2 111.3 -53 .1 -19 .4 116.4 222.4 63.7 123.9 28.1 71.2
Source : Footwear Industry Revitalization Program 1980, Annual Progress Report, US Department of Commerce.
employers and managers, the American Shoe Center was established in Philadelphia.
As mentioned above, the certified establishments experienced greatly increased productivity due to such assistance. The volume of exports was greatly extended as a result of the export promotion program in particular. From among the certified establishments, 23 companies set up a new market in foreign countries. Therefore, the purpose of this program is generally considered to have a certain effect.
However, a comparison between the certified and the non-certified establishments revealed minor differences in performance. For example, the decrease in employment from 1976 to 1978 was smaller in the non-certified than in the certified establishments. This influenced the entire domestic industry due to the limitation of the program. As shown in Table 8, the inflow of imports continued to increase during the term of the program. In other words, the increase in exports could not contain the inflow of imports.
It is understood that the effects of the industrial support program were limited with respect to time and scope of the industry. Judging from the decline in the domestic output in recent times, it is obvious that the program has not led to the maintenance of a long-term productive capacity. As regards the small and medium-sized establishments, the introduction of a new technology for product innovation is difficult due to the shortage of capital. They are thus unable to gain a competitive advantage in the high value-added production. The footwear production in the US continues to encounter the difficulties in high value-added production. In brief, the impasse of the value-added production in the developed countries exposes the limita-tions of government support through technological and financial assistance.
Table 8 Economic highlights in the US leather footwear
Indicator
Production (1,000 Pair) Exports (1,000 Pair) Imports (1,000 Pair) Market Supply (1,000 Pair) Import Penetration Employment (1,000) Average Weekly Earnings Average Weekly Hours
Unemployment Rate 1978 1979 418,948 6,935 373,515 785,528 47.6% 157.8 $138.81 37.0 8.2% 381,171 9,261 404,563 776,473 52.1% 148.9 $148.12 36.2 8.0% Net or Change (%) — 9.0 +33.5 + 8.3 — 1.1 + 4.5 — 5.6 + 6.7 — 2.2 — 0 .2 Source : Footwear Industry Revitalization Program 1980, Annual
Decline of the Footwear Industry in Japan and the United States as a Result of the Global Shift in Production 73
5. Concluding remarks
As present, China is the largest footwear-producing country in the world. The share of China in the total global production touched 39% in 1992. The competitive advantage of China in this industry is primarily due to the factor of low wages. Thus, the footwear production bases have increasingly shifted to China and Southeast Asia. The inflow process of imports that resulted in a decrease in the domestic production in Japan and the US is one that corresponds to the footwear production trend in the world. It is the multinational corporations that prompted the global shift in footwear production. In other words, they established the quasi-integrated manufacturing system to arrange for the subcontractors in China and Southeast Asia. Most small and medium-sized enterprises in the developed countries are also tackling the difficulty of achieving sustainable high value-added production. However, it is difficult to compete with the developing countries despite the promotion of exhaustive improve-ments such as the system of social division of labor and diversified small-quantity production.
On the other hand, Western European products, particularly those from Italy, continue to occupy the largest share of the import value in Japan. Italy had achieved high value-added production by implementing measures such as the conversion of the sales strategy, shortening of the lead time, and so on. They had developed high-quality markets distinct from the low-priced ones in the developing countries. The polarization of production into high-quality and low-grade goods is accelerating rapidly in the import market.
Although the US government had promoted several policies since the 1980s, they neither had a considerable effect on the working efficiency on a long-term basis nor did they lead to the revitalization of the domestic industry. For small and medium-sized enterprises, an improvement in product innovation alone is not capable of acquiring a competitive advantage in the high value-added production over the cheap and abun-dant labor in the developing countries. The footwear production in the United States and Japan is still unable to accomplish the same level of high value-added production as in Italy. Therefore, the footwear industry in the developed countries should explore a new approach, different from the existing one, in order to maintain their current productive capacity.
Acknowledgements
I would like to thank Prof. M. Hino (Tohoku University) for his constructive comments and suggestions on this article.
Note
1) We should pay attention to the unevenness of these data, drafted by the United Nations (Industrial Statistics Yearbook). This is because these data were gathered from the statistics using different standards in each country.
2) Incidentally, in 2000, the average wage per hour in the US rubber/plastic footwear industry and the leather footwear industry was $26.4 and 24.7, respectively. It can be understood that the wages in the footwear industry are extremely low as compared with those in the other industries ($38.0).
Reference
American Apparel and Footwear Association (2000) : Statistical Report.
Congressional Budget Office, The Congress of the United States (1991) : Trade Restraints and
the Competitive Status of the Textile, Apparel, and Non-rubber Footwear Industries.
U.S. Department of Commerce (1980) : Annual Progress Report, Footwear industry
ization program 1980.
U.S. Census Bureau, U.S. Department of Commerce (1999) : Current Industrial Reports,
Footwear Production
U.S. International Trade Commission (1993) : The Economic Effects of Significant U.S.
Imports Restraints.
U.S. International Trade Commission, Office of Industries (1993) : Industry and Summary,
Footwear.
U.S. Tariff Commission (1969, 1971) : Imports and Tariff provisions effect on domestic shoe
industry, Tariff Act of 1930, 1962.
Footwear Industries of America (1999) : Current Highlights of the Nonrubber Footwear
try.