21
also isotope effects between the NDIR models. Details of the isotope effect are described in section 9.5.
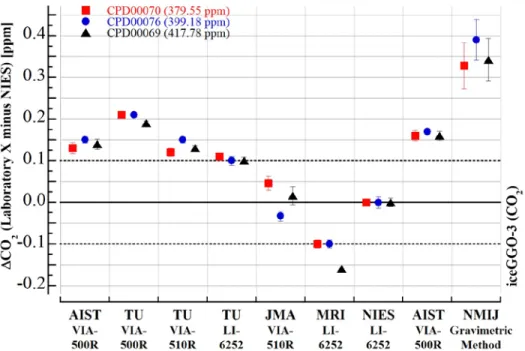
Figure 4. Differences (Laboratory X minus NIES) of CO2 concentrations in three round-robin cylinders measured during the iceGGO-3. The error bars represent the ± measurement uncertainty reported by each laboratory, although the error bar for the NMIJ indicates the ± expanded uncertainty of the gravimetric method. The dashed lines around the zero line identify the WMO criterion (±0.1 ppm) in the Northern Hemisphere for network compatibility.
5. iceGGO-4 (CO)
5.1. Round-robin cylinders (iceGGO-4)
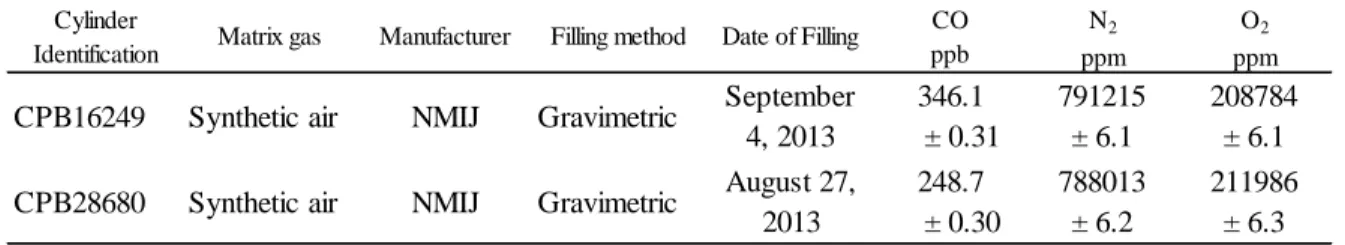
The fourth experiment (iceGGO-4), which took place in 2013-2014, focused on comparison of CO standard gas scales by circulating high-pressure cylinders. Table 11 provides details about the two sample cylinders used for this round-robin experiment. The samples in these two cylinders contained CO at concentrations of about 346 ppb and 249
22
ppb, respectively. The samples were prepared from pure CO, N2, and O2 with a four-step dilution by the gravimetric method in accord with ISO 6142:2001. The CO concentrations at each step were 23,000–29,000 ppm, 610–670 ppm, 13–16 ppm, and 250–350 ppb. The expanded uncertainty of the CO gravimetric values (k = 2), about 0.3 ppb, was associated mainly with the determination of the CO concentrations in pure N2 and O2. Before the gravimetric preparation at the NMIJ, the inner walls of the high-pressure aluminum cylinders were treated in a special way by the Iwatani Corporation in Japan to minimize the drift of CO.
Table 11. The two cylinders used for CO analyses during the iceGGO-4.
5.2. Measurement methods (iceGGO-4)
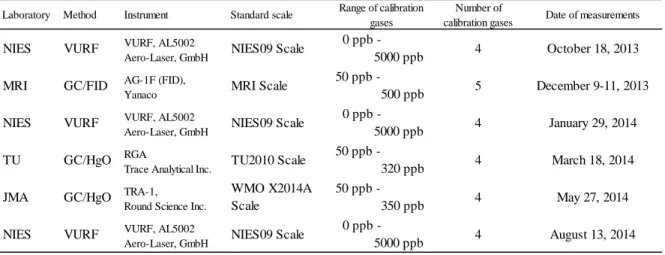
Four laboratories (NIES, MRI, TU, and JMA) participated from October 2013 to August 2014 in the iceGGO-4 round-robin measurements. Table 12 lists the participating laboratories and provides details about their CO analytical methods. To monitor for CO drift during the experimental period, the NIES measured all cylinders three times with a vacuum ultraviolet resonance fluorescence (VURF) analyzer. The TU and JMA used a gas chromatograph equipped with a reduction gas detector (GC/RGD) to measure CO concentrations, whereas the MRI used a GC/FID after conversion of CO to CH4.
Cylinder
Identification Matrix gas Manufacturer Filling method Date of Filling CO ppb
N2
ppm
O2
ppm
CPB16249 Synthetic air NMIJ Gravimetric September 4, 2013
346.1 ± 0.31
791215
± 6.1
208784
± 6.1 CPB28680 Synthetic air NMIJ Gravimetric August 27,
2013
248.7 ± 0.30
788013
± 6.2
211986
± 6.3
23
The JMA measurements were based on the WMO X2014A scale, which has been propagated from the NOAA/GMD (Novelli et al., 2003). The other three laboratories used different standard gas scales (NIES09, MRI, and TU2010), which were independently developed and maintained for a long period.
Table 12. The four laboratories and their analytical methods, instruments, and calibration scales for CO during the iceGGO-4.
5.3. Results of iceGGO-4
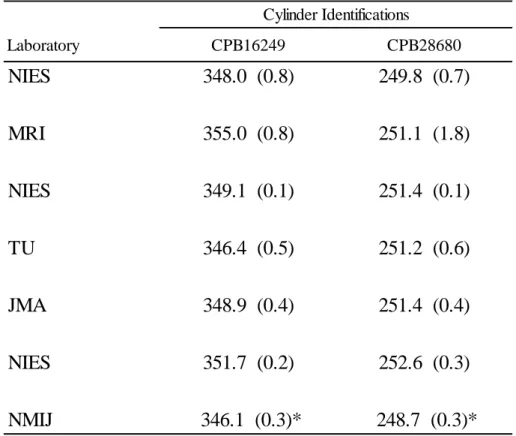
Table 13 shows the CO concentrations measured in the two round-robin cylinders by the four laboratories using different methods together with NMIJ’s gravimetric values.
The analytical precision of most of the measurements from the four laboratories was less than 1 ppb, although the precision was larger for the GC/FID method used by the MRI. The NIES measurements, which were made three times during this experimental period of about one year, revealed a CO concentration increase in both cylinders. After the drifts had been
Laboratory Method Instrument Standard scale Range of calibration gases
Number of
calibration gases Date of measurements
NIES VURF VURF, AL5002
Aero-Laser, GmbH NIES09 Scale 0 ppb -
5000 ppb 4 October 18, 2013 MRI GC/FID AG-1F (FID),
Yanaco MRI Scale 50 ppb -
500 ppb 5 December 9-11, 2013
NIES VURF VURF, AL5002
Aero-Laser, GmbH NIES09 Scale 0 ppb -
5000 ppb 4 January 29, 2014
TU GC/HgO RGA
Trace Analytical Inc. TU2010 Scale 50 ppb -
320 ppb 4 March 18, 2014
JMA GC/HgO TRA-1,
Round Science Inc.
WMO X2014A Scale
50 ppb -
350 ppb 4 May 27, 2014
NIES VURF VURF, AL5002
Aero-Laser, GmbH NIES09 Scale 0 ppb -
5000 ppb 4 August 13, 2014
24
estimated and the difference of CO standard scales examined, the measured values were corrected as discussed in section 9.3. Thus, the concentrations in Table 13 reported by the four laboratories reflect not only the differences of CO standard scales but also the CO drift effect.
Table 13. CO concentrations (ppb) during the iceGGO-4. The reported precisions are shown in parentheses.
Figure 5 shows the differences in the CO concentrations measured by each laboratory (Laboratory X) and the gravimetric value of the NMIJ for the two round-robin cylinders. The concentrations measured by the NIES clearly increased with time due to the CO drifts in both the cylinders; none of the measured values was corrected. The differences
Laboratory CPB16249 CPB28680
NIES 348.0 (0.8) 249.8 (0.7)
MRI 355.0 (0.8) 251.1 (1.8)
NIES 349.1 (0.1) 251.4 (0.1)
TU 346.4 (0.5) 251.2 (0.6)
JMA 348.9 (0.4) 251.4 (0.4)
NIES 351.7 (0.2) 252.6 (0.3)
NMIJ 346.1 (0.3)* 248.7 (0.3)*
*Gravimetric value (Expanded uncertainty of gravimetric method (k = 2)) Cylinder Identifications
25
(Laboratory X minus NMIJ) among the laboratories ranged from 0 ppb to +8 ppb for the two cylinders. When the CO drifts are taken into consideration, the measurements of both the TU, JMA, and NIES are almost in agreement with the NMIJ gravimetric values to within the WMO recommended compatibility criterion (±2 ppb). In contrast, relatively large deviations from the NMIJ gravimetric values were observed for the high-CO- concentration cylinder assayed by the MRI. These results mainly reflect differences in the CO calibration standard scales used by the MRI and JMA.
Figure 5. Differences (Laboratory X minus NMIJ) of CO concentrations for the two round-robin cylinders assayed for the
iceGGO-4. The error bars represent the ± measurement precision reported by each laboratory, although the error bar of the NMIJ indicates the ± expanded uncertainty of the gravimetric method (k = 2). The dashed lines around the zero line identify the WMO recommended criterion (±2 ppb) for CO measurement compatibility.