Phase-Sensitive Imaging with High-Peak-Power THz Radiation Toshiaki Hattori, Keisuke Ohta, Rakchanok Rungsawang, and Keiji Tukamoto Institute of Applied Physics, University of Tsukuba, Tsukuba, Ibaraki, 305−8573 Japan
Phone: +81−29−853−5210, Fax: +81−29−853−5205, e-mail: [email protected]
Abstract. Phase-sensitive fast THz imaging was demonstrated by the introduction of the optical heterodyning to the imaging setup using high-peak-power THz radiation generated from a large-aperture photoconductive antenna. Time-resolved and frequency-resolved spatial profiles of electric field on the focal plane of a focused half-cycle THz pulse were observed.
1. Introduction
For real-world applications of terahertz (THz) imaging, achievement of short image acquisition time and high spatial resolution is desired. With conventional weak THz sources, spatial scanning is required for image acquisition, which is time-consuming and prohibits real-time imaging. Use of intense THz radiation generated from a large-aperture photoconductive antenna enables us to achieve imaging without spatial scanning [1]. High spatial resolution can be achieved by the frequency-resolved imaging using Fourier analysis of the temporal waveforms of the THz field at each position. We applied the optical heterodyne detection (OHD) method in the fast imaging setup, and observed the frequency-dependent almost diffraction-limited focusing of half-cycle THz pulses.
2. Experiment
The experimental setup was essentially based on that described in the previous paper [1]. Briefly, a large-aperture semi-insulating GaAs antenna was pumped by 150-fs, 800-nm amplified pulses at a repetition rate of 1 kHz, and the generated THz radiation was focused by an off-axis parabolic mirror. Almost half-cycle electric pulses with a duration (FWHM) of 0.5 ps were obtained at the focus. The two-dimensional profile of the THz radiation on the focal plane was observed by the electro-optic (EO) sampling method using a CCD camera. The image acquisition can be achieved
on a single-shot basis with this setup, although data presented here are results of accumulation over 30 laser shots, which corresponds to an acquisition time of 30 ms per image, to obtain better signal quality. In the EO setup, with the polarizer and the analyzer crossed with each other, the signal intensity is, in the ideal case, proportional to the squared magnitude of the electric field, or intensity. Fourier analysis is difficult in this case. To achieve field-linear detection, the OHD method was introduced in the fast imaging apparatus.
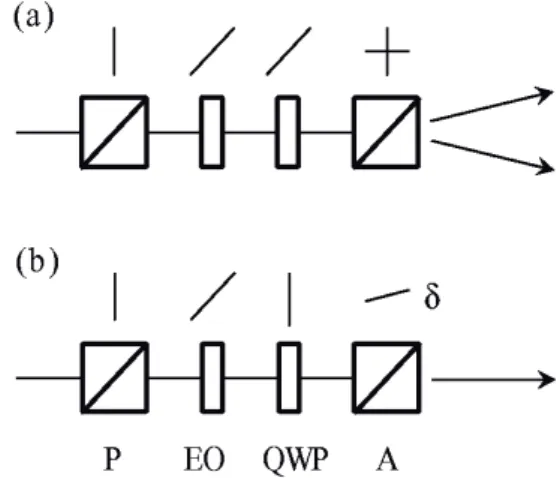
In Fig.1, the optical configuration of the OHD method is compared with that of the conventional balanced detection, which is almost impossible with the image acquisition using a CCD camera. Very often in the actual measurements, field, not the intensity, is obtained unintentionally due to residual birefringence of the EO crystal. In this case, however, the sensitivity of the measurement to the field magnitude is not controllable and depends on the position. In the OHD method,
Fig. 1. The experimental configuration of the optics in (a) the balanced detection and (b) the OHD method. P:
polarizer, EO: an EO crystal, QWP: a quarter-wave plate, and A: a polarization analyzer. Vertical lines and 45-degree oriented lines indicate the direction of the optical axes. The analyzer is oriented by a small angle δ.
field detection is achieved by the introduction of a quarter-wave plate and small-angle orientation of the analyzer.
By the intentional manipulation of the polarization status with a quarter-wave plate, controlled and spatially uniform field detection was achieved.
3. Results and Discussion
The time-resolved spatial profiles of the electric field of focused half-cycle THz pulses were obtained with the setup described above. A donut-shaped profile at a certain range of the time, as observed previously with the intensity measurement [1], was confirmed with the present field images.
By Fourier transforming the temporal field waveform at each position in the images, frequency-resolved spatial distributions of the electric field amplitude were calculated. Acquisition of over a hundred images and the subsequent Fourier transformation calculation takes about 20 minutes, which can be shortened by software improvement.
Examples of the profiles are shown in Fig. 2, where the spatial profiles for the 0.48 and 1.50 THz components are displayed. It is seen from the figure that the sensitivity of this measurement to the field magnitude is uniform over the observed area, and that components with higher frequency are
(a) (b)
focused more tightly, which enables us to perform imaging with higher spatial resolution.
In Fig.3 the THz beam size at each frequency extracted from the image is compared with the value from the analytical expression based on the Gaussian beam model. Although the experimental values are 10 to 50% larger, the frequency dependence is consistent, and it can be seen that almost diffraction-limited focusing was achieved and 1-mm spatial resolution can be obtained with the present setup.
4. Conclusions
The optical heterodyne detection method using a quarter-wave plate was introduced in the real-time imaging apparatus to achieve direct electric field imaging. Using Fourier analysis, frequency-resolved spatial profiles were obtained. The frequency dependence of the obtained beam radius agrees with that of a Gaussian beam, which shows that almost diffraction-limited focusing was achieved. The present imaging technique can also be applied in imaging of versatile objects, such as biological tissues.
References
[1] R. Rungsawang, K. Ohta, K. Tukamoto and T. Hattori, J.
Phys. D: Appl. Phys. 36, 229 (2003).
0.4 0.6 0.8 1.0 1.2 1.4 1.6 1.8 2.0
0.5 1.0 1.5 2.0 2.5 3.0 3.5 4.0
Beam Radius (mm)
Frequency (THz) Fig. 2. The spatial distribution of the electric field
amplitude of (a) 0.48 THz and (b) 1.50 THz components of the focused half-cycle THz pulse. The images correspond to an area of 18.2 mm x 18.2 mm on the focal plane. The amplitude is normalized at each frequency.
The peak value of image (b) is much smaller than that of image (a), which enhances the relative level of the background noise in (b).
Fig. 3. The THz beam size (1/e radius) obtained from the frequency dependent amplitude distribution (solid circles and line) is compared with the beam waist size of the Gaussian beam of the corresponding frequency (line).