Regulation of xenobiotic efflux systems in Escherichia coli in response to environmental changes
著者 YAMAMOTO Kentaro
著者別名 山本 健太郎
その他のタイトル 環境変化に応じた大腸菌異物排出システムの制御 page range 1‑89
year 2016‑03‑24 学位授与番号 32675甲第376号 学位授与年月日 2016‑03‑24
学位名 博士(生命科学)
学位授与機関 法政大学 (Hosei University)
URL http://doi.org/10.15002/00013049
法政大学審査学位論文
環境変化に応じた大腸菌異物排出システムの制御
法政大学大学院 理工学研究科 生命機能学専攻 山本健太郎
2016
年3
月Doctoral Dissertation March, 2016
Regulation of xenobiotic efflux systems in Escherichia coli in response to environmental changes
Kentaro Yamamoto
Department of Frontier Bioscience, Graduate School of Science and Engineering,
Hosei University
i
Table of contents
Table of contents ··· i
Abstract ··· ii
Acknowledgments ··· vi
List of abbreviations··· viii
CHAPTER I. General Introduction ··· 1
CHAPTER II. Substrate-dependent dynamics of the multidrug efflux transporter AcrB of Escherichia coli ··· 11
CHAPTER III. Accumulation of indole in the cytosol induces the multidrug efflux transporter gene acrD ··· 38
CHAPTER IV. Methods for fluorometric imaging of outer and inner membrane proteins ··· 51
CHAPTER V. Conclusion ··· 60
CHAPTER VI. Materials and Methods ··· 62
References ··· 79
Notes ··· 89
ii
Abstract
The rising incidence of bacterial multidrug resistance has become a serious worldwide issue. The resistance-nodulation-cell division (RND)-type xenobiotic efflux system plays a major role in multidrug resistance of gram-negative bacteria. The only constitutively expressed RND system of Escherichia coli consists of the inner membrane transporter AcrB, the membrane fusion protein AcrA, and the outer membrane channel TolC.
The latter two components are shared with another RND-type transporter AcrD, the expression of which is induced by environmental stimuli. In CHAPTER II of this study, I demonstrate how the RND-type ternary complexes, spanning the two membranes and the cell wall, are formed in vivo. Most foci of AcrB fused to green fluorescent protein (GFP) were fixed in the presence of TolC but showed lateral displacements when tolC was deleted. The fraction of fixed AcrB-GFP foci decreased with increasing levels of AcrD. I therefore propose that AcrD replaces AcrB in the complex with AcrA and TolC through a process I named
“transporter exchange.” Moreover, transporter exchange was suppressed by AcrB-specific substrates, suggesting that the ternary complex is stabilized when it is in action. These results suggest that the assembly of the RND-type efflux system is dynamically regulated in response to external stimuli, shedding new light on bacterial adaptive antibiotic resistance.
Indole plays important roles in a wide variety of bacterial physiology such as
iii
virulence, drug resistance, persister cell formation, motility, and quorum sensing, among other diverse physiological processes. The expression of the inner membrane transporter gene acrD is induced by the presence of high concentrations of indole via a two-component system (TCS) consisting of the sensor kinase BaeS and the response regulator BaeR. In CHAPTER III of this study, I first observed GFP-fused AcrD encoded by the chromosomal gene with the native promoter. Observation of AcrD-GFP foci required very high concentrations of indole.
In contrast, AcrD-GFP foci were readily detected in a tolC-deletion derivative strain without exposing to exogenous indole. The deletion of the tryptophanase gene tnaA or the TCS genes baeSR abolished the constitutive expression of AcrD-GFP in the tolC-deleted strain. I next
measured indole concentrations in the presence and absence of TolC. The intracellular concentration of indole in the tolC-deleted strain was about three times as high as that in the parental strain. In contrast, TolC had little effect on the extracellular concentration of indole.
These results suggest that TolC is involved in indole efflux. Moreover, I examined whether the interaction between TolC and an inner membrane transporter is required for indole efflux.
A mutant TolC protein, defective in coupling to the inner membrane transporter, decreased the level of accumulation of intracellular indole, though not as effectively as the wild-type protein.
It was suggested that TolC provides a channel not only for drugs but also for indole to diffuse out of cell, and that E. coli monitors changes in the intracellular concentration of indole rather than extracellular one.
iv
Fluorescent proteins such as GFP have been used for labeling a cellular proteins.
However, their large molecular weight of fluorescent proteins often interfere with the function of host protein, which would lead us to misdirected interpretations. In CHAPTER IV of this study, I applied florescent labeling methods other than fluorescent proteins to xenobiotic efflux and environment signaling systems. The fluorescein arsenical hairpin (FlAsH) specifically binds to a short peptide sequence of Cys-Cys-Pro-Gly-Cys-Cys (TC-tag), and it becomes fluorescent only when it binds covalently to a TC-tag. The TC-tagged outer membrane channel TolC of a part of the RND efflux system was labeled by FlAsH. This method resulted in the lateral localization of TolC without loss of their host functions.
Moreover, I also used this FlAsH labeling method for the cytoplasmic signaling protein of Vibrio cholerae. I observed that the GFP-fused histidine kinase CheA1 of V. cholerae was
localized to a cell pole and lateral region of the membrane with standing incubation or in the presence of sodium azide (NaN3) that inhibits cytochrome c oxydase, whereas the protein was diffused in cellular cytosol without such treatments. The localization pattern of TC-tagged CheA1 was consistent with those of the GFP fusions, arguing strongly that the behaviors of CheA1-GFP reflects the localization of the native protein. Next, I visualized the taurine/amino acid chemoreceptor Mlp37 of V. cholerae in vivo by using the fluorescently labeled L-serine 5(6)-carboxyfluorescein ester (Ser-FAM). Upon treatment with Ser-FAM, fluorescent spots were detected at poles of cells expressing wild-type mlp37. Moreover, fluorescent spots of
v
Ser-FAM were decreased in the presence of non-fluorescent attractants serine and taurine, but not the weakest attractant L-glutamate, suggesting that the former attractants compete with Ser-FAM for binding to Mlp37. These results provide, for the first time, a tool to visualize direct ligand binding to a bacterial chemoreceptor in vivo and can also be applied to visualize signaling of TCSs and substrate transport in the xenobiotic efflux systems.
vi
Acknowledgements
I would like to express my gratitude to Prof. Ikuro Kawagishi for a great deal of continuous advice, discussions and encouragements through the research.
I thank Drs. Akio Abe (Kitasato University), Tsutomu Sato (Hosei University), and Kaneyoshi Yamamoto (Hosei University) for giving invaluable advices as members of my doctoral dissertation committee.
I also thank Dr. Satoshi Murakami (Tokyo Institute of Technology) for invaluable discussion and encouragement, Dr. Yasushi Sako (RIKEN) for technical advices of image analysis, Dr. M. D. Manson (Texas A&M University) for critically reading the earlier version of the manuscript about the transporter exchange mechanism, Dr. Yoshiyuki Sowa (Hosei University) for all technical advices and allowing me to use the TIRFM system, and Dr. K.
Yamamoto (Hosei University) for P1 phage strains and allowing me to use the spectrophotometer.
I would also like to thank Dr. Takehiko Inaba, Dr. So-ichiro Nishiyama, Dr.
Yong-Suk Che, Dr. Satomi Banno, Dr. Hiroki Irieda, Dr. Hirotaka Tajima, Dr. Jun Teramoto, Dr. Yuki Yamanaka, Dr. Noriko Ohta, Ms. Tomomi Fujikawa and Ms. Natsumi Nonoyam for their supports and encouragements.
Strains from the Keio collection and plasmids from the ASKA clone were provided by the National BioResource Project - E. coli Strain at the National Institute of Genetics
vii
(NBRP-E.coli at NIG). This work was supported by an MEXT KAKENHI Grant Number 24115519 and 24115518, the MEXT-Supported Program for the Strategic Research Foundation at Private Universities, 2008-2012 and Tokyo Institute of Technology Foundation Research and Educational Grants (26-reserch-013), 2013-2014.
viii
List of abbreviations
ABC ATP-binding cassette
Ara arabinose
CBPC carbenicillin
CP chloramphenicol
DMSO dimethyl sulfoxide
EDT ethanedithiol
EGFP enhanced green fluorescent protein
FlAsH fluorescein arsenical hairpin binder
GFP green fluorescent protein
IMT inner membrane transporter
IPTG isopropylthiogalactoside
MATE multidrug and toxic compound extrusion
MFP membrane fusion protein
MFS major facilitator superfamily
MIC minimum inhibitory concentration
MINO minocycline
MRSA methicillin-resistance Staphylococcus aureus
MSD mean square displacement
NA nalidixic acid
NBRP national bioresource project
NDM-1 New Delhi metallo-beta-lactamase-1
OMC outer membrane channel
PBP penicillin-binding protein
ix
PDDF pairwise difference distribution function
PG peptidoglycan
SMR small multidrug resistance
TIRFM total internal reflection fluorescent microscope
TM transmembrane
TxRM Texas Red C2 Maleimide
RFP red fluorescent protein
RND resistance-nodulation-division
ROI region of interest
Ser-FAM serine 5(6)-carboxyfluorescein ester
sfGFP superfolder GFP
TC-tag tetracysteine-tag
TCEP tris-(2-carboxyethyl) phosphine
TCS two-component regulatory system
YFP yellow fluorescent protein
1
CHAPTER I
General Introduction
Bacterial antibiotic and multidrug resistance
Human has combated bacterial infections in this today. In 1928, Alexander Fleming incidentally discovered penicillin from a moldy petri dish and it had an ability to kill some bacteria. After 12 years, the other group at University of Oxford developed the mass-producing method of penicillin, and it was utilized as a therapeutic to treat patients of bacterial infection. For instance, in 1944, one of the deadly illnesses was tuberculosis which could be treated by streptomycin. Moreover, in 1950s, the various antibiotics including other than β-lactam as penicillin were discovered and used widely to pathogenic bacteria, which developed a chemotherapy (Davies & Davies, 2010).
However, in late-1950s, antibiotics leaded antibiotic resistant bacteria, which synthesis the enzyme as β-lactamase that inactivate antibiotics, to spread to a medical front.
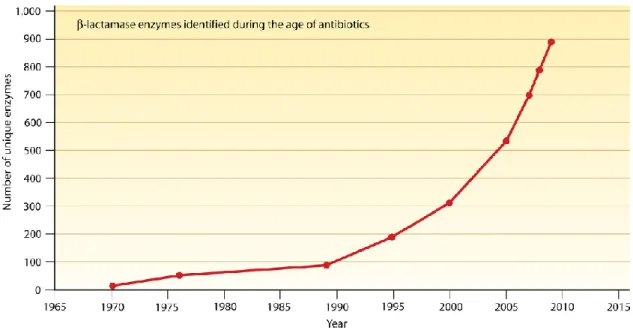
Now, it has been known over 900 β-lactamase are divided into 4 classes (A-D) based on amino acid sequence (Fig. I-1) (Davies & Davies, 2010; Matagne et al., 1999). These genes are coded on bacterial chromosomes or plasmids, and are transferred by transposons and mobile genetic elements such as R plasmids (Adams et al., 2008). Serine-β-lactamases as penicillinase are found in Pseudomonas aeruginosa and Staphylococcus aureus, and
2
Metallo-β-lactamases are found in Escherichia coli, P. aeruginosa (Bush et al., 1995; Garau et al., 2004; Lambert, 2002). These are hydrolytic enzymes to the ester and amide bond of β-lactam which causes inactivation of antibiotic activity. Especially, Metallo-β-lactamases lead gram-negative bacteria to achieve the resistance to new-generated antibiotic cephalosporin recently (Walsh et al., 2005). The β-lactams interfere with synthesis of peptidoglycan layer in cell wall. The peptidoglycan plays an important role in the rigid structure of cell wall which is essential to cell growth, division, and retaining cell form of bacteria. The penicillin-binding proteins (PBPs) are major enzymes involved in the synthesizing cross-linking of peptidoglycan layers (Spratt, 1977). The active sites of PBPs are targeted in an attack of β-lactam antibiotics and formed highly stable PBP-β-lactam complexes, which lead to inactivate the synthesis of bacterial cell walls (Nguyen-Disteche et al., 1982). The β-lactamases modify PBPs to reduce the affinity for β-lactams, which results in the resistance to β-lactam antibiotics (Dzidic et al., 2008).
The chloramphenicol and aminoglycosides interfere with protein synthesis by binding to each 50S and 30S ribosomal subunit of bacteria, respectively. An enzyme chloramphenicol transacetylase of gram-positive and -negative bacteria acetylates a hydroxyl group of chloramphenicol to prevent a binding of chloramphenicol to the 50S ribosomal subunit, which leads host strain to resist chloramphenicol (Morar & Wright, 2010). Also, the inactivating of aminoglycoside is caused by a phosphoryltransferase and adenylyltransferase
3
that modify the binding to the 30S ribosomal subunit, and its modification provides the resistance to aminoglycosides (Strateva & Yordanov, 2009).
In 1980, the active efflux system for tetracycline in E. coli was originally reported (McMurry et al., 1980), and now has been discovered in any bacteria. The xenobiotic efflux systems (pumps) transport antibiotics and toxic compounds for bacteria out of cell and keep the low levels of intracellular concentration of those (Nikaido, 1998; Webber & Piddock, 2003). Although some have drug-specificity, most of efflux systems are multidrug transporters that can transport various toxicants including drugs unrelated to structure and functional mechanism (Table. I-1). Thus, the multidrug efflux systems contribute pathogenic bacteria to resistance to a wide variety of antibiotics (Nikaido, 1998; Nikaido, 2000; Putman et al., 2000).
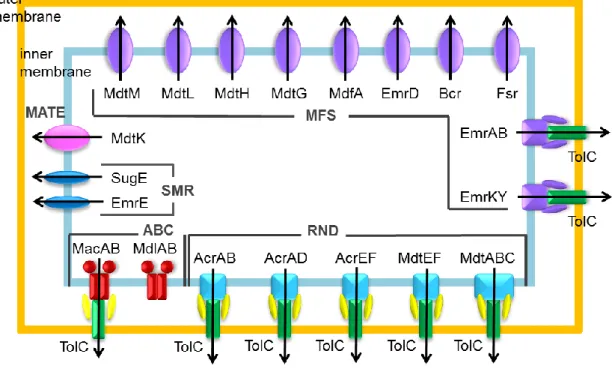
The drug efflux transporters are classified into five categories: the major facilitator (MFS), small multidrug resistance (SMR), multidrug and toxic compound extrusion (MATE), ATP-binding cassette (ABC) and resistance-nodulation-cell division (RND) superfamilies (Li
& Nikaido, 2009; Paulsen et al., 1996; Putman et al., 2000). A predominant cause of multidrug resistance of gram-negative bacteria is elevated expression of multidrug efflux transporters of the RND family (Nikaido, 1998). These systems comprise the inner membrane transporter (IMT), the outer membrane channel (OMC), and the membrane fusion protein (MFP) that is anchored to the inner membrane via a lipid moiety and bridges IMT and OMC (Nishino & Yamaguchi, 2001a; Paulsen et al., 1996). This transporter superfamily is
4
ubiquitous in nature, including higher animals and plants (Altmann et al., 2004).
Use of many antibiotics over the years, the increasing use of antibiotics leading to the emergence of multidrug resistant bacteria is responsible for serious social problems. Our pace of the discovering new antibiotics has been slowed exponentially while the appearance of novel variants of multidrug resistant bacteria has increased. The methicillin was developed as a first designed β-lactam antibiotic to resist to a penicillinase-producing pathogenic bacteria such as S. aureus. After 3 years, however, the methicillin-resistance S. aureus (MRSA) which has resistance to many β-lactam antibiotics emerged and caused a serious bloodstream infection in the clinical front. Recently, it had enormous impacts on society that the spread of super multidrug resistant bacteria across the entire world was reported. This bacteria have the resistance to almost all β-lactam antibiotics, fluoroquinolone and aminoglycoside by New Delhi metallo-beta-lactamase (NDM-1) (Gelband & Laxminarayan, 2015). The potent drug resistant bacteria have threatened our public health, and also multidrug resistant bacteria have killed over 700,000 patients every year in the world (Shallcross et al., 2015). We have no perfect antibiotic that is effective in every bacteria without adverse effects, and also we are required a non-traditional proactive approach to multidrug resistant bacteria.
Indole
Indole occurs widely throughout nature environment. Over the past 100 years,
5
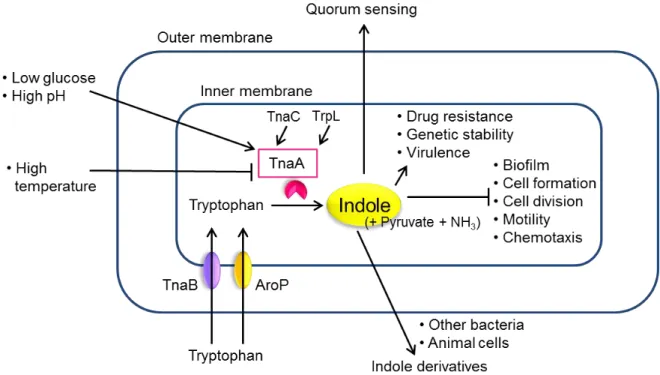
bacteria produces indole have been found and used for bacterial taxonomy, identification and diagnostic test (Smith, 1897). Now at least 85 bacterial species including pathogenic Gram-negative and positive bacteria are known to produce a quantity of indole (Lee & Lee, 2010). Indole is synthesized from amino acid tryptophan by tryptophanase, which is a cytoplasmic hydrolysis enzyme to reduce tryptophan to indole, pyruvate and ammonia. In Escherichia coli, these reactions are catalyzed by the tryptophanase TnaA (Stewart &
Yanofsky, 1985) and many other proteins; tryptophan specific transporter TnaB, AroP, tryptophanase leader peptide TnaC, trp operon leader peptide TrpL and so on (Li & Young, 2013). The indole biosynthesis is down regulated by environmental factors, such as a high concentration of glucose as carbon source (Wyeth, 1919), a high temperature (indole synthesis is stopped at 44.5°C) (Bueschkens & Stiles, 1984; Li et al., 2003), a low pH (TnaA is most induced at pH9.0) (Blankenhorn et al., 1999; Wyeth, 1919), and a cell density (Kobayashi et al., 2006). Biosynthetic indole has long been known to work as a chemorepellent of E. coli (Tso & Adler, 1974), and recently has also been learned as a chemical signaling molecule to an intra- and interspecies of bacteria which involve in the expression of many genes (Melander et al., 2014). The signaling of indole regulates the bacterial virulence (Hirakawa et al., 2009), drug resistance (Hirakawa et al., 2005), biofilm formation (Di Martino et al., 2002), genetic stability (Chant & Summers, 2007), persister cell formation (Vega et al., 2012), motility (Lee et al., 2007), and quorum sensing (Lee & Lee, 2010), among other diverse
6
physiological processes. It also has been known that indole is stable in E. coli cell because of no pathway of indole degradation and modification by enzymes (Chant & Summers, 2007;
Lee & Lee, 2010). Moreover, the equilibrium of indole and its metabolism involve in an intestinal tract inflammation of mammalian (Bansal et al., 2010). Indole and derivations of tryptophan-metabolite play an important role in the regulation of broad-ranging physiology in bacteria and animals (Fig. I-2).
Fluorescein arsenical hairpin binder (FlAsH) labeling
Fluorescence microscopy has been used for the study of protein localization and dynamics with a variety of chemical labeling methods. The discovery of green fluorescence protein (GFP) from the jellyfish Aequorea victoria (Shimomura et al., 1962) enable a fluorescent live-cell imaging using GFP fused host protein chimera. Moreover, GFP variants have been developed, such as enhanced GFP (EGFP) (McRae et al., 2005), superfolder GFP (sfGFP) (Pedelacq et al., 2006), and yellow fluorescence protein (YFP) (Ormo et al., 1996), and were utilized in various situations in cell biology. In spite of these benefits, fluorescence proteins were limited on use due to their large molecular weight. This molecular size interferes with the function, stability, and localization of their fused host protein (Swulius &
Jensen, 2012). The fluorescein arsenical hairpin binder–ethanedithiol (FlAsH-EDT2) has been developed as an alternative approach for specific labeling in live-cell imaging (Griffin et al.,
7
1998). FlAsH specifically binds to a short peptide sequence of Cys-Cys-Pro-Gly-Cys-Cys (TC-tag), and it forms intermolecular disulfide linker. FlAsH is complexed with EDT as a weakly fluorescence, and it becomes a fluorescence with binding to a TC-tag whose excitation and emission peaks are 508 and 528 nm, respectively. The equilibrium of FlAsH-EDT2 and FlAsH-TC depend on the concentration of EDT. In HeLa cell, FlAsH-TC is likely to be stable at ≤ 10 µM EDT which returned to a FlAsH-EDT2 as non-fluorescence state at ≥ 1 mM EDT (Griffin et al., 1998). FlAsH labeling technique is useful for live-cell imaging as an alternative to fluorescence proteins.
8
Fig. I-1. Increasing of number of identified β-lactamase.
Number of β-lactamase, which inactivates β-lactam class of antibiotics, is on the increase.
(cited from Davies & Davies, 2010)
9
Fig. I-2. Indole biosynthesis and signaling pathway in E. coli.
This figure shows that the regulations of indole biosynthesis and indole-induced phenotype.
Arrows and bar-head lines indicate up and down-regulation of gene expression or phenotype, respectively.
10
Table. I-1. Bacterial multidrug efflux systems and its substrates.
This table shows that the typical multidrug efflux systems of clinical pathogenic bacteria and the toxic compounds are transported by those systems.
11
CHAPTER II
Substrate-dependent dynamics of the multidrug efflux transporter AcrB of Escherichia coli
Introduction
The increasing use of antibiotics has led to the emergence of multidrug resistant bacteria, a phenomenon that has serious consequences for public problems. A predominant cause of multidrug resistance of gram-negative bacteria is elevated expression of multidrug efflux transporters of the RND family (Nikaido, 1998) (Fig. II-1). These systems comprise an inner membrane transporter (IMT), an outer membrane channel (OMC), and a membrane fusion protein (MFP) that is anchored to the inner membrane via a lipid moiety and bridges IMT and OMC (Nishino & Yamaguchi, 2001a; Paulsen et al., 1996). This transporter superfamily is ubiquitous in nature and is found in prokaryotes and eukaryotes, including higher animals and plants (Altmann et al., 2004). The RND efflux systems of Escherichia coli and Pseudomonas aeruginosa have been extensively studied in terms of their biochemistry, molecular architecture, and patterns of gene expression (Stover et al., 2000). Among the five RND transporters of E. coli, only the AcrB-AcrA-TolC complex (hereafter referred to as AcrBA-TolC) is constitutively expressed (Sulavik et al., 2001) and plays a major role in its multidrug resistance (Nikaido, 1998; Okusu et al., 1996; Zgurskaya & Nikaido, 1999). The
12
structure-function relationship of the IMT AcrB is well studied. The proton-drug antiporter AcrB (Paulsen et al., 1996), which forms a homotrimer of 12-transmembrane (TM) subunits (Murakami et al., 2002), captures a wide variety of antibacterial compounds, including antibiotics, detergents and other amphiphilic agents, and directly transports these substrates out of the cell via TolC (Nikaido, 2000; Zgurskaya & Nikaido, 1999). TolC is also a homotrimeric protein consisting of an outer membrane domain folded into a 12-stranded β-barrel. It has a periplasmic extension (about 100 Å in length) with an α-helical coiled coil domain and a mixed α/β equatorial domain, which together form a hollow cylindrical structure that allows substrate to diffuse directly out of the cell (Koronakis et al., 2000).
Whereas the TolC homotrimer has three-fold symmetry (Koronakis et al., 2000), the AcrB homotrimer is asymmetric, and each protomer plays a different role in substrate binding (Murakami et al., 2006). The functional association of AcrB with TolC is thought to require the MFP AcrA (Ma et al., 1993), the stoichiometry of which has not been unambiguously determined. However, a recent cryo-EM study suggests that AcrA forms a homohexamer (Du et al., 2014).
The transcription of various inducible xenobiotic efflux genes is regulated by two-component regulatory systems (TCSs) (Nishino & Yamaguchi, 2001b; Nishino &
Yamaguchi, 2002), each typically consisting of a sensor kinase and a response regulator, which are widely distributed among prokaryotes and eukaryotes. The E. coli genome encodes
13
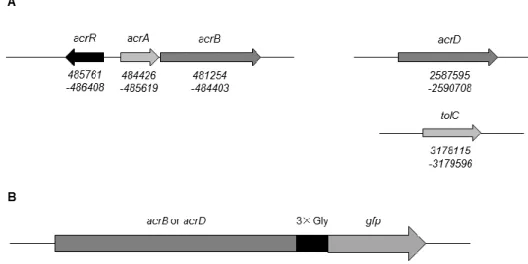
62 TCS proteins that mediate a variety of environmental responses (Kofoid & Parkinson, 1988; West & Stock, 2001). Most RND genes encoding MFP/IMT pairs, including acrA/acrB, are located in tandem on the chromosome and form transcriptional units (Fig. II-2). Among all IMT genes, only the acrD gene stands alone. Its product, AcrD, is closely related to AcrB and also interacts with AcrA and TolC (Aires & Nikaido, 2005), the latter of which is encoded by a gene belonging to a separate operon (Fig. II-2). The AcrDA-TolC complex exports aminoglycosides and anionic β-lactams, such as carbenicillin and sulbenicillin, which are not transported by AcrB (Kobayashi et al., 2014; Nishino et al., 2003; Rosenberg et al., 2000).
The expression of acrD is induced upon the addition of indole to culture media via the TCS consisting of the sensor kinase BaeS and the response regulator BaeR (Hirakawa et al., 2005;
Nishino et al., 2005).
These properties raise an important question concerning assembly of the ternary complex. Do newly synthesized AcrD molecules assemble into a ternary AcrDA-TolC complex de novo, or do they replace AcrB subunits in the pre-existing AcrBA-TolC complex?
It may be advantageous for bacteria to employ the latter mechanism, which we call
“transporter exchange,” to remove harmful substrates promptly out of cells as quickly as
possible. However, it has not been established how RND-type transporter complexes that bridge two separate membranes are assembled. These considerations, and the pioneering study on single molecule behaviors of bacterial membrane proteins (Leake et al., 2006), led us
14
to study the assembly and dynamics of the AcrB/D AcrA TolC protein complex in vivo.
I visualized AcrB in vivo using green fluorescent protein (GFP). Observations with total internal reflection fluorescence (TIRF) microscopy revealed that most fluorescent foci of AcrB-GFP were stationary and mobile in the presence and absence of TolC, respectively. I next examined the effect of AcrD on the dynamics of AcrB. The fraction of mobile AcrB-GFP foci increased with increasing levels of AcrD. I therefore propose that the AcrBA-TolC complex becomes unstable upon the induction of AcrD, which presumably replaces AcrB in the ternary complex. Moreover, such instability is suppressed upon the addition of AcrB-specific substrates. These results suggest that the assembly of the RND-type efflux system is a regulated dynamic process that provides bacteria with a highly flexible repertoire of survival strategies to cope with a wide spectrum of antibiotics.
15
Fig. II-1. Xenobiotic efflux protein families in E. coli.
RND-type: Forms a tripartite complex. Captures a wide variety of toxic compounds and directly transports them out of cell via the outer membrane channel TolC. Plays a major role in multidrug resistance of gram-negative bacteria. MFS-type: The major membrane transporter family. A drug/proton antiporter with 12-14 transmembrane domains. Plays a major role in xenobiotic efflux by gram-positive bacteria. SMR-type: Related to the MFS-type but has 4 transmembrane domains. MATE-type: Related to the MFS-type but is driven by sodium ion. ABC-type: The ATP-binding-cassette-type with 4 transmembrane domains.
16
Results
The AcrB-GFP trimer is stationary in the cytoplasmic membrane via its association with
TolC in the outer membrane.
I constructed a strain expressing green fluorescent protein (GFP)-fused AcrB from the chromosomal acrB locus (strain YKN12, a derivative of strain BW25113) (Datsenko &
Wanner, 2000). The AcrB-GFP protein retained almost full activity as judged by the minimal inhibitory concentrations (MIC) of AcrB substrates (Fig. II-3B). To assess the effect of TolC on the AcrB-GFP dynamics within the cell membrane, I constructed a tolC-deleted derivative of YKN12 (strain YKN17). Immunoblotting with monoclonal anti-GFP antibody detected a band of AcrB-GFP without visible degradation products (Fig. II-4). The expression levels of the AcrB-GFP in a tolC-deleted strain was almost the same as that of the tolC+ strain (Fig.
II-4). TIRF microscopic observations detected a clear difference in the lateral displacements of AcrB-GFP foci between strains YKN12 (tolC+) and YKN17 (∆tolC) (Fig. II-5A, B, D). Fig.
II-5A and D show the x-y trajectories and the time lapse images of AcrB-GFP foci in these genetic backgrounds. AcrB-GFP movement (an AcrB subunit with 12 TMs has a molecular mass of 110 kDa) was analyzed by monitoring two-dimensional mean square displacements (MSD) of individual foci over time. In the presence of TolC, the calculated MSD values of all AcrB-GFP foci tested at time 330 ms were distributed below 0.5 × 10⁻² µm2, with an average of 0.2 ± 0.1 (mean ± S.D.) × 10−2 µm2 (Fig. II-5B, 6A). In the absence of TolC, most
17
AcrB-GFP foci moved incessantly, and their MSD values were distributed over a wide range:
2.3−10.7 × 10⁻² µm2, with an average of 5.2 ± 2.2 (mean ± S.D.) × 10−2 µm2 (Fig. II-5B, 6A).
I then fitted the data (i.e. the averaged MSD-∆t plots for stationary and mobile fractions of AcrB-GFP in strains YKN12 and YKN17) to linear regression models (Fig. II-6B). The diffusion coefficient (= D) values in the presence and the absence of TolC calculated from these fits are 6.8 ± 5.0 (mean ± S.D.) × 10−4 µm2 s−1 and 3.5 ± 1.8 × 10⁻² µm2 s−1, respectively.
When complemented with a plasmid encoding TolC, MSD values of AcrB-GFP foci and resistance to nalidixic acid returned to levels comparable to those of the parent strain (Fig.
II-3B, 5B). AcrB-GFP foci in the tolC+ and the complemented strains showed about two orders of magnitude smaller D values (8.0 ± 4.0 × 10⁻⁴ µm2 s−1) than those in the ∆tolC strain.
The former can be regarded as immobile within experimental errors. Based on these data, foci with MSDs at time 330 ms below and above 0.5 × 10⁻² µm2 (marked with a dotted line in Fig.
II-5B) will hereafter be designated as “stationary” and “mobile,” respectively. Accordingly, all the AcrB-GFP foci in the tolC+ background are stationary and those in the ∆tolC background are mobile, whereas 84% of those in the complemented strain are stationary (Fig. II-5C). In the tolC+ background, time-course analyses of the fluorescence emission from single stationary AcrB-GFP foci detected up to three-step photobleaching (Fig. II-7A). Fig. II-6B shows the power spectrum of one focus as the pairwise differences (Pairwise Difference Distribution Function, PDDF), which indicated the step size of single molecular GFP, with an
18
average of 680 ± 180 (mean ± S.D., arbitrary unit) under my experimental conditions (Fig.
II-7B, C). The distribution of intensity at the first frame peaked at a value that is about three times the intensity of a single GFP estimated by photobleaching (Fig. II-7D).
Visualization of TolC with a fluorescent reagent.
I next examined whether stationary AcrB-GFP foci in the inner membrane indeed co-localize with TolC in the outer membrane. Substituting Cys for Ala-269 in an extracellular loop of TolC (11 residues in length; Fig. II-8A) did not affect the drug efflux activity as judged from MIC of nalidixic acid (Fig. II-3B). TolC-A269C was stained with the thiol-reactive fluorescent reagent Texas Red maleimide (TxRM) at low concentrations for a short period of time to minimize non-specific labeling of other Cys-containing proteins. TIRF microscopy detected foci of labeled TolC-A269C, some of which co-localized with AcrB-GFP (Fig. II-8B). No foci were observed in cells expressing wild-type TolC, demonstrating that non-specific labeling was negligible (Fig. II-8B).
AcrB dissociates from the preformed complex with TolC and AcrA upon induction of
AcrD.
I was interested in determining whether the expression of AcrD, the closest homolog of AcrB, influences AcrB dynamics in the tolC+ strain. First, AcrD was expressed from an
19
arabinose-inducible plasmid. The fraction of mobile AcrB-GFP foci increased (from 8% to 72%) with increasing concentrations (0−100 µM) of arabinose (Fig. II-9A, B) and increased (from 12% to 64%) over time (0−2 h) after the addition of 100 µM arabinose (Fig. II-9C, D). I suggest that the induction of AcrD facilitates dissociation of AcrB from the preformed complex with TolC and AcrA, presumably to from a new ternary complex (AcrDA-TolC). I then tested whether the dynamics of AcrB-GFP is influenced by the expression of AcrD from the native chromosomal gene. The expression of acrD was induced by the addition of indole or by overexpressing the TCS response regulator BaeR (Hirakawa et al., 2005; Nishino et al., 2005). I next constructed a strain (named MBRT02) carrying a chromosomal gene encoding AcrD-GFP (the design is essentially the same as acrB-gfp in strain YKN12). In strain MBRT02, AcrD-GFP foci were observed when cells were exposed to indole or when BaeR was overexpressed from the plasmid (Fig. II-10A). The increased expression of AcrD-GFP induced by plasmid pBaeR was verified by immunoblotting with monoclonal anti-GFP antibody (Fig. II-10B). Consistent with that result, the fraction of mobile AcrB-GFP foci in YKN12 cells treated with indole (60%) was larger than that in cells not exposed to indole (4%) (Fig. II-11A, B). Taken together, these results demonstrate that transporter exchange occurs in the native setting.
The AcrBA-TolC complex is stabilized by AcrB-specific substrates.
20
The findings just described raise the question of whether the induction of AcrD destabilizes the AcrBA-TolC complex while the latter complex is in the process of exporting its substrates. AcrBA-TolC, but not AcrDA-TolC, exports chloramphenicol and minocycline.
When either of these substrates was added to the culture medium, the fraction of stationary AcrB-GFP foci became relatively insensitive to the expression of AcrD (32% without a substrate vs 84% with 4.9 µM chloramphenicol and 60% with 3.2 µM minocycline; Fig.
II-11C, D). This was further examined under more physiological conditions: indole-induced expression of AcrD-GFP in MBRT02 cells. The functionality of the AcrD-GFP protein in these experiments was verified by checking MIC for an AcrD-specific substrate, carbenicillin (Fig. II-10C). The AcrB-specific substrate chloramphenicol decreased the fraction of stationary AcrD-GFP foci. I also examined whether the incorporation of IMT molecules into the ternary complex is affected by its substrate. The addition of the AcrD-specific substrate carbenicillin to cells expressing AcrD from the plasmid did not reduce the fraction of stationary AcrB-GFP (32% without a substrate vs 36% with carbenicillin; Fig. II-12). These results suggest that the AcrD-induced instability of the preformed AcrB-containing complex is suppressed when the preexisting complexes are transporting substrates, whereas the presence of a substrate of a second, newly synthesized transporter does not necessarily facilitate transporter exchange.
21
Fig. II-2. Characterization of AcrB-GFP and AcrD-GFP.
(A) The loci of RND-component genes on the chromosome of E. coli str. K-12 substr.
MG1655. (B) Construction of AcrB-GFP and AcrD-GFP. GFP was fused to the carboxy-terminus of AcrB or AcrD through a Gly3 linker.
22
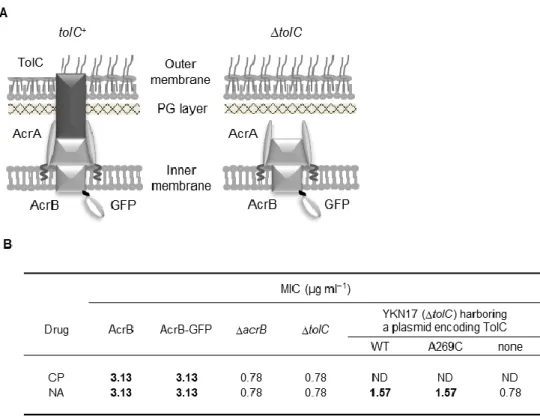
Fig. II-3. Design and MIC test of AcrB-GFP.
(A) Schematic illustration of AcrB-GFP in the cell surface of E. coli. For simplicity, AcrB is depicted to bind AcrA even in the absence of TolC, though it has not been experimentally tested. (B) Antibiotic susceptibility analysis. Wild-type AcrB and AcrB-GFP were expressed from the chromosomal genes of strains BW25113 and YKN12, respectively, while plasmid-encoded wild-type TolC (pKRB2100) and mutant TolC (A269C; pKRB2104) were expressed in strain YKN17 (∆tolC). Bold face represents the resistance indicative of the significant efflux activity. Abbreviations: CP, chloramphenicol; NA, nalidixic acid; ND, not determined (due to the plasmid-borne CP resistance).
23
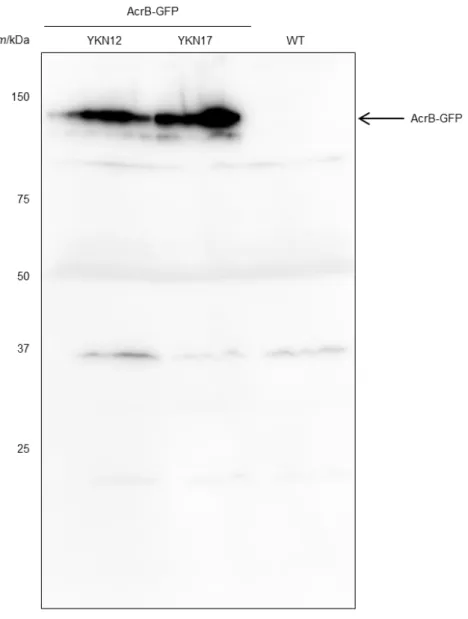
Fig. II-4. Detection of AcrB-GFP using immunoblotting.
AcrB-GFP (m/kDa = 140) was expressed in strains YKN12 (tolC+) (left lane) and YKN17 (∆tolC) (middle lane). The wild-type strain BW25113 was used as a control (right lane).
Whole cell lysates were subjected to Western blotting with monoclonal antibody raised against GFP and anti-mouse-IgG (Cell Signaling Technology) antibody labeled with horse-radish peroxidase.
24
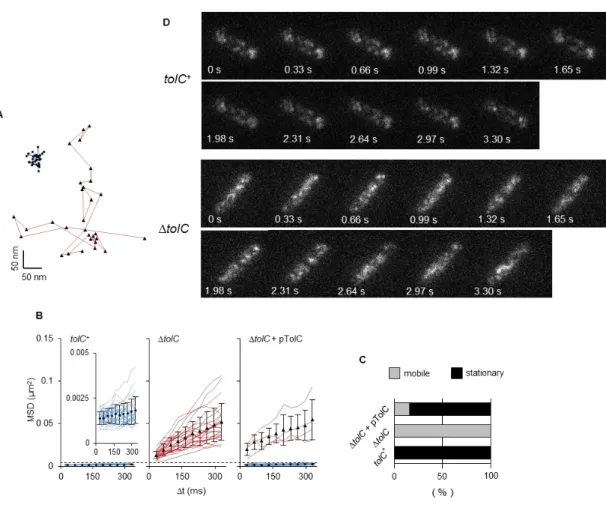
Fig. II-5. AcrB-GFP dynamics in the cytoplasmic membrane.
(A, B, C, D) x-y trajectories of AcrB-GFP in YKN12 (blue line) and YKN17 (red line) with the TIRF illumination (A) and time lapse images (D), MSD-∆t plots of AcrB-GFP foci (B) and fractions of mobile and stationary AcrB-GFP foci (C) in the presence or absence of TolC.
Fluorescent foci were traced and their MSDs were calculated (n = 25). Closed symbols with error bars indicate averaged MSD values of all mobile (triangles) or stationary (circles) trajectories at each time with standard deviations. Dotted line in panel B indicates the boundary MSD value at time 330 ms to define mobile (red lines) and stationary foci (blue lines).
25
Fig. II-6. Tracking AcrB-GFP foci and calculation of their mean square displacements (MSD) in strains YKN12 and YKN17.
(A) Distribution of MSD at time 330 ms of AcrB-GFP foci in the presence (left) or absence (right) of TolC. (n = 25). (B) The averaged MSD-∆t plots for stationary (left) and mobile (right) fractions of AcrB-GFP. These data were fitted with linear regressions.
26
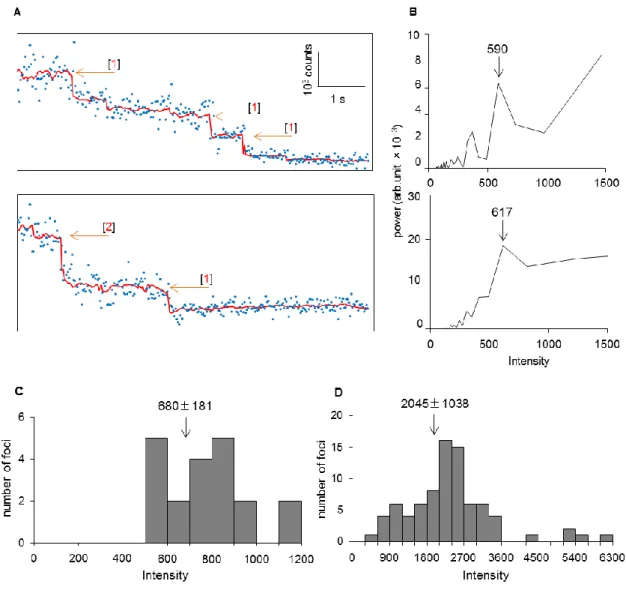
Fig. II-7. Trimeric nature of fixed AcrB-GFP foci in the presence of TolC.
(A) Three-step photobleaching of a single AcrB-GFP focus. Blue dots, the intensity of AcrB-GFP per frame; red line, output of the edge-detecting filtered intensity (window = 15);
orange arrows, the positions of predicted steps with measured a step size respectively; and red numbers, the number of bleached GFP molecules. (B) Power spectra of the PDDF with arrows indicating step sizes of photobleaching trace. (C) Distribution of the detected step sizes of photobleaching (n = 20). Arrow indicates an average (mean ± S.D.) of the step sizes. (D) Distribution of the fluorescence intensity of single foci at the first frame obtained by subtracting the background value (n = 81). Arrow indicates an average (mean ± S.D.) of the foci intensity.
27
Fig. II-8. The co-localization of AcrB-GFP foci with fluorescently labeled TolC.
(A) The crystal structure of the extracellular loop of the TolC trimer (PDB ID code: 2XMN).
Purple balls indicate the positions of A269C. (B) Co-localization of AcrB and TolC. Images of AcrB-GFP (left) and TxRM-labeled TolC-A269C (middle) were merged (right). Arrow heads indicate TolC-A269C foci that did not co-localize with AcrB-GFP (top). Observation of TxRM-treated cells expressing AcrB-GFP and wild-type TolC. YKN17 cells transformed with plasmid pKRB2100 (wild-type TolC) were grown in the presence of arabinose and treated with 1 µM TxRM. Images of the same fields taken with emission filters for GFP (left) or TxRM (middle) were merged (right) (bottom). Scale bar, 1 µm.
28
Fig. II-9. The AcrD expression influenced the mobility of AcrB-GFP foci.
Effect of plasmid-encoded AcrD induced with 0−100 µM arabinose for 2 h (n = 25) or with 100 µM arabinose for 0−2 h (n = 25). (A, C) MSD-∆t plots of AcrB-GFP foci under various conditions. Dotted line indicates the boundary MSD value at time 330 ms to define mobile (red lines) and stationary foci (blue lines). (B, D) Fractions of stationary and mobile AcrB-GFP foci.
29
Fig. II-10. The expression and MIC test of AcrD-GFP.
TIRF observation (A) and immunodetection (B) of AcrD-GFP (m/kDa = 140) in MBRT02 cells. (C) Resistance of cells expressing AcrD (strain BW25113) or AcrD-GFP (strain MBRT02) to carbenicillin. Cells carrying the BaeR-expressing plasmid pBaeR or the vector pCA24N were cultured with 100 µM IPTG.
30
Fig. II-11. The effect of induction of the chromosomal acrD gene.
(A, B) Effect of induction of the chromosomal acrD gene. The native acrD gene was induced with 4 mM indole for 2 h (n = 25). Cells were also treated with 1% dimethyl sulfoxide as a negative control. (C, D) Effects of the AcrB-specific substrates chloramphenicol (CP, 4.9 or 3.2 µM) and minocycline (MINO, 3.2 µM) on MSDs of AcrB-GFP under AcrD-inducing conditions. The plasmid-borne acrD gene was induced with 100 µM arabinose for 2 h (n = 25). MSD-∆t plots (A, C) and fractions of stationary and mobile of AcrB-GFP foci (B, D).
31
Fig. II-12. Effect of an AcrD-specific substrate on transporter exchange.
Carbenicillin (CBPC) was added to the culture for 1.5 h after acrD was induced with 100 µM arabinose. Cells were further incubated for 0.5 h. (A) MSD-∆t plots of AcrB-GFP with (left) or without (right) 6.25 µM CBPC. (B) The fractions of stationary and mobile AcrB-GFP foci (n = 25) with or without CBPC.
32
Discussion
In this study, I examined dynamics and assembly of AcrB, the major RND-type xenobiotic efflux transporter in the inner membrane (IMT) of E. coli. With TIRF microscopy, I found that most foci of GFP-fused AcrB were stationary in the presence of TolC, whereas they showed lateral diffusion in the membrane of the ∆tolC strain. The co-localization of AcrB-GFP with TolC was detected by chemically labeling TolC. I also found that the induction of AcrD destabilizes the AcrBA-TolC complex, presumably resulting in the exchange of AcrB-GFP in the preexisting complex with newly synthesized AcrD. The fraction of mobile AcrB-GFP foci increased with increasing expression levels of AcrD. Furthermore, the AcrD-induced instability of the AcrBA-TolC complex was suppressed by AcrB-specific substrates, suggesting that the assembly of the RND-type efflux system is a regulated dynamic process.
The D value of moving AcrB-GFP obtained in our TIRF microscopic analyses (3.5 ± 1.8 × 10⁻² µm2 s−1) is roughly one order of magnitude smaller than that of the E. coli serine chemoreceptor Tsr fused to the fluorescent protein Venus (4.0 ± 0.1 × 10⁻¹ µm2 s−1) (Oh et al., 2014). The difference in the D value between these proteins is reasonable considering that in the number of TMs: AcrB is a homotrimer of 12-TM subunits and Tsr is a homodimer of 2-TM subunits (or exists as a trimer of dimer). The fact that AcrB-GFP foci are stationary in the presence of TolC is consistent with the structural feature of TolC. Because the periplasmic
33
extension of TolC penetrates the peptidoglycan layer, a rigid three-dimensional mesh-like supramolecule, the lateral diffusion of TolC molecules must be very restricted. Thus, the diffusion of AcrB, once assembled into the complex with TolC, must also be limited.
I detected three-step photobleaching of stationary AcrB-GFP foci. I also detected double-sized steps, indicating that two GFP molecules were bleached simultaneously or successively. These results demonstrate that at least a majority of TolC-associated AcrB molecules form trimers. The broad distribution of MSD value in the absence of TolC might reflect interactions with other membrane proteins or a mixed population of AcrB-GFP monomers and oligomers.
Leake et al (2006) reported that TIRF illumination visualizes approximately one sixth of the surface of a cell within 100 nm of a coverslip (Leake et al., 2006). In the tolC+ strain, I detected an average of 7.5 ± 1.6 (mean ± S.D., n = 50) stationary foci of AcrB-GFP per cell in the TIRF illumination field. I therefore estimate that there are 45 ± 9.6 foci of AcrB-GFP trimers per cell, which corresponds to 135 ± 28.8 molecules of AcrB-GFP per cell if a majority of foci represented trimers. This estimation is consistent with estimated values the literature (< 500 molecules) (Tikhonova & Zgurskaya, 2004). Because the number of TolC molecules per cell is nearly three times higher than that of AcrB molecules (Tikhonova &
Zgurskaya, 2004), and because the level of TolC expressed from the plasmid-borne gene must be higher than from the chromosomal gene, it is likely that not all labeled TolC co-localized
34
with AcrB-GFP and that TolC is in excess.
Expression of the acrAB operon is regulated by AcrR repressor and transcriptional activators such as MarR and SoxS (Ma et al., 1996; Perez et al., 2012; Watanabe & Doukyu, 2012). However, the operon is known to be “constitutively” expressed under laboratory conditions (Sulavik et al., 2001), whereas genes encoding other IMTs, including AcrD, of RND-type xenobiotic efflux systems are expressed at very low levels in E. coli and are induced by environmental stimuli such as indole-induced and other stresses on the cell envelope (Hirakawa et al., 2005; Raffa & Raivio, 2002). Because AcrD shares TolC and AcrA with AcrB, and assuming that the induction signal for AcrD (indole) does not significantly affect the cellular amounts of AcrB, AcrA and TolC, it was reasonable to ask whether AcrD can replace AcrB in the preformed AcrBA-TolC complex. Indeed, the expression of AcrD either from the chromosomal gene with the native promoter (induced by indole) or the promoter-less gene under the control of the araBAD promoter (induced by arabinose) increased lateral diffusion of AcrB-GFP, which was otherwise stationary in complex with TolC and AcrA. This AcrD-induced instability of the AcrBA-TolC complex, which may result in transporter exchange, would be part of adaptive drug resistance, an important bacterial responses to harmful substances. It should also be noted that transporter exchange may occur between different molecules of the same IMT: for instance, the AcrBA-TolC complex may undergo assembly and disassembly with some frequency. Thus, an RND-type xenobiotic
35
efflux complex is not rigid or fixed but allows association and dissociation of its components.
The next obvious question is whether the AcrD-induced instability of the AcrBA-TolC complex can be regulated. Our results indicate that there is some level of regulation: the AcrBA-TolC complex was stabilized by the AcrB-specific substrates. Of the two substrates tested, minocycline showed weaker effects, likely because it has a lower affinity for AcrB. Minocycline might also be sequestered because it chelates divalent metal ions in the medium (Leyden, 1985). These results suggest that the AcrBA-TolC complex is stabilized by substrate binding, slowing the exchange of AcrB with AcrD. The stabilization of a ternary complex when it is in action should be advantageous for bacterial survival. In particular, AcrB can transport the widest range of substrates among all xenobiotic transporters (Nishino & Yamaguchi, 2001a), including the bacterium’s own metabolites or their derivatives such as fatty acids and bile salts (Ma et al., 1995). Interference with the activity of AcrB when cells are exposed to its substrate(s) would presumably have adverse effects on viability (Murakami & Yamaguchi, 2003). The AcrD-specific substrate, however, had little effect on the stability of the ternary complex. Thus, the presence of a substrate for a non-associated IMT may not necessarily accelerate destabilization of preexisting ternary complexes. Alternatively, a free IMT might not bind its substrate. A thermodynamics study suggests that, in the absence of substrate, AcrB forms a symmetric trimer, and that forced substrate binding to one protomer induces and stabilizes an asymmetric form of the AcrB
36
trimer (Yao et al., 2010). In vivo, an IMT might bind its substrate to become an asymmetric trimer only when it is in the ternary complex. The resulting asymmetric IMT trimer might stabilize the IMT-MFP-OMC ternary complex, making it resistant to transporter exchange.
Alternatively, the AcrBA-TolC complex might be stabilized by some endogenous substrate(s).
The AcrBA-TolC complex might also be stabilized by some endogenous substrate(s) (Fig.
II-13).
In this chapter, the full data were published in Scientific Reports (Yamamoto et al., 2016).
37
Fig. II-13. The transporter exchange model.
The pre-formed AcrB-AcrA-TolC complex becomes instable upon the induction of AcrD, which presumably result in the exchanges of AcrB with AcrD to form a new AcrDA-TolC complex (left). The pre-formed ternary complex can be stabilized by its substrates (right).
38
CHAPTER III
Accumulation of indole in the cell induces the multidrug efflux transporter gene acrD
Introduction
The RND-type multidrug efflux transporter AcrD is closely related to AcrB, and shares MFP AcrA and OMC TolC with AcrB (Aires & Nikaido, 2005). The AcrDA-TolC complex exports aminoglycosides and anionic β-lactams, such as carbenicillin and sulbenicillin, which are not transported by AcrB (Kobayashi et al., 2014; Nishino et al., 2003;
Rosenberg et al., 2000). The acrD is expressed at very low levels in E. coli under the standard laboratory conditions and is induced upon the addition of indole to culture media via the TCS consisting of the sensor kinase BaeS and the response regulator BaeR (Hirakawa et al., 2005;
Nishino et al., 2005). Indole is synthesized from tryptophan by a variety of bacterial species, including E. coli, and hence is present throughout natural environments (Lee & Lee, 2010).
This laboratory constructed a strain expressing GFP-fused AcrD from the chromosome of strain BW25113. In the resulting strain, fluorescence foci of AcrD-GFP were observed when cultured in the presence, but not in the absence, of 4 mM indole. Although the concentrations required for induction are consistent with the literature (Hirakawa et al., 2005), 4 mM seems too high compared to physiological concentrations of indole (0.6 – 1.2 mM; Li
39
& Young, 2013) which bacteria would encounter in the intestine (Knarreborg et al., 2002).
Therefore, the real trigger or signal that a bacterium senses to induce AcrD must not be extracellular indole itself, but rather something resulting from high extracellular indole concentrations. Here, based on the following lines of evidence, I propose that it is intracellular indole that triggers the acrD expression. First, I observed fluorescent foci of AcrD-GFP in a tolC-deletion derivative strain, but not in the parental strain, without exposing to indole or any
exogenous agents. The effect of the tolC deletion was reversed by the expression of wild-type TolC or mutant TolC defective in drug efflux. Second, the deletion of the tryptophanase gene tnaA or the TCS genes baeSR abolished the constitutive expression of AcrD-GFP in the
tolC-deleted strain. Third, the direct measurements of indole concentration revealed that the
intracellular concentration of indole in the tolC-deleted strain was higher than that in the tolC+ strain.
Results
The deletion of tolC influences the acrD expression
I examined whether the expression of acrD is induced by the addition of indole as reported previously (Hirakawa et al., 2005). In strain MBRT02 which carries the chromosomal acrD-gfp gene (for detail, see CHAPTER II of this study), TIRFM observation detected AcrD-GFP foci when cells were treated with 4 mM indole for 2 h, but scarcely did
40
without indole (Fig. III-1A). Interestingly, in the tolC-deleted derivative strain MBRT05, AcrD-GFP foci were detected without treating with indole (Fig. III-1B, left). When complemented with a plasmid encoding TolC (pKRB2109), AcrD-GFP foci were not observed without indole (Fig. III-1B, middle). Furthermore, I constructed a tnaA-deleted derivative from MBRT05. In the resulting tnaA tolC double-deletion strain encoding AcrD-GFP (named YKN51), AcrD-GFP foci were not observed without indole despite the absence of TolC (Fig. III-1B, right). These results suggest that the deletion of tolC results in the constitutive expression of acrD.
I next measured the expression of AcrD-GFP quantitatively using a microplate reader.
The fluorescence intensity of ∆tolC cells carrying the plasmid encoding TolC was decreased about 23%, compared to those with the empty vector (Fig. III-2A). The ∆tolC ∆tnaA double mutant showed decreased fluorescence intensity, which returned to the level of the parent strain by introducing a tnaA-expressing plasmid (Fig. III-2A, B). Moreover, the fluorescence intensity was substantially reduced by the deletion of baeSR, whose products mediate indole responses (Fig. III-2B). These results are consistent with the TIRFM observation of AcrD-GFP described above. Presumably, the deletion of tolC might causes the accumulation of indole, or some other factor, in the cytosol or some deformation in the cell surface, either of which might trigger the acrD expression by activating the BaeSR system.
The outer membrane channel TolC works as a part of RND efflux system with inner
41
membrane transporter. The constitutively expressed transporter AcrB and its paralog AcrF of E. coli are considered to play a central role in the efflux of intracellular xenobiotics. The
deletion of acrB and acrF, however, had little effect on the AcrD-GFP expression (Fig.
III-2B). I then asked whether TolC can complement the expression of AcrD-GFP without an interaction with transporters. Based on the literature (Tamura et al., 2005), I constructed a plasmid encoding mutant TolC with the substitution of a Gly×4 linker for residues Q142-A150 in the loop between helices H3 and H4 (named TolC∆loop), which is defective in drug efflux as judged from chloramphenicol resistance (Fig. III-2C). I also constructed a plasmid encoding TolC and TolC∆loop fused to mCherry (a red fluorescent protein). These fusion proteins were detected by immunoblotting with anti-RFP antibody without visible degradation products and apparently localized to the cell surface as judged from observation with epi illumination (Fig. III-2D, E). The expression of either mCherry-fused TolC or TolC∆loop AcrD-GFP in the tolC-deleted strain decreased the expression of AcrD-GFP (Fig.
III-2A, C), suggesting that even mutant TolC defective in coupling to an inner membrane transporter can suppress the induction of acrD.
Measuring the amount of intracellular indole
I then examined whether indole is indeed accumulated in a ∆tolC cell using Kovac’s reagent. About 33.5% difference was detected for the amount of intracellular indole between
42
in the tolC+ (0.881 ± 0.199 × 10⁶ molecule/cell) and the tolC-deleted (2.629 ± 0.150 × 10⁶ molecule/cell) strain. It was estimated that the concentration of intracellular indole in a cell at 332.74 ± 75.27 µM and 992.45 ± 56.56 µM, respectively (Fig. III-3, right). In contrast, the difference of the amount of indole that was transported to the extracellular space was no more than about 5.6% (129.476 ± 1.381 × 10⁶ molecule/cell in the tolC+ vs 122.637 ± 0.987 × 10⁶ molecule/cell in the ∆tolC). These values correspond to 167.76 ± 1.79 µM and 158.9 ± 1.28 µM, respectively. In the tolC-deleted strain, the total amount of indole was about 4.1%
smaller than that in the tolC+ strain. Moreover, when complemented with the TolC-encoding plasmid, the amount and concentration of indole returned to levels comparable to those of the parent strain. With TolC∆loop, the complementation level of any indole test was lower than those with wild-type TolC. These results suggest that the lack of TolC renders indole to be accumulated in the cell, which may induces the expression of acrD.
43
Fig. III-1. Observation of AcrD-GFP under various conditions.
Fluorescent imaging of AcrD-GFP from chromosomal gene with TIRFM. (A) In the presence of tolC strain MBRT02, cells were treated with or without 4 mM indole for 2 h. (B) Observation of AcrD-GFP in a tolC-deleted strain MBRT05 (left) and in a tolC and tnaA-deleted strain YKN51 (right). Cells carrying the TolC expressing plasmid pKRB2100 were cultured with 100 µM arabinose for 2 h (middle).
44
Fig. III-2. The deletion of tolC induced the chromosome-encoded acrD-gfp.
(A, B) The relative of AcrD-GFP intensity in the various backgrounds using microplate reader.
Each bar represents the mean ± standard deviation of data (n = 3). (A) Cells carrying the wild-type TolC, TolC∆loop mutant, mCherry fused TolC or TnaA-expressing plasmid or the vector pBAD24 were cultured with 100 μM arabinose. (C) Antibiotic susceptibility analysis.
The tolC+ (WT) and ∆tolC cells expressing AcrD-GFP from the chromosomal genes. The plasmid-encoded wild-type TolC and its variants were expressed in the ∆tolC strain. (D, E) The immunodetection (D) and epi fluorescent imaging (E) of mCherry fused TolC and TolC∆loop (m/kDa = 80) in the ∆tolC strain.
45
Fig. III-3. The measuring intra- and extracellular indole.
Cells carrying the wild-type TolC or TolC∆loop mutant-expressing plasmid or the vector pBAD24 were cultured with 100 μM arabinose. The amount of indole are shown as the accumulation of intracellular indole (intracellular), the excretion of indole to supernatant (extracellular), and the total amount of indole that have been produced by a cell (total) per cell (left). The closed circle indicates the concentration of intracellular indole (right). Each bar represents the mean ± standard deviation of data (n = 3).
46
Discussion
In this chapter, I examined whether the outer membrane channel TolC of RND-type transports indole to out of cells. With fluorescence microscopic observation, I found that a deletion of tolC induced the chromosome-encoded acrD-gfp without exogenous agents as indole. Because this induction was inhibited by the deficiency of tryptophanase TnaA which synthesizes indole from tryptophan, I suspected an increasing concentration of intracellular indole in the absence of tolC. Hirakawa et al reported that the expression of acrD is induced by the addition of indole to culture media via the TCS consisting of the sensor kinase BaeS and the response regulator BaeR (Hirakawa et al., 2005). Indeed the lacking BaeSR regulation system suppressed the expression of acrD-gfp in the tolC-deleted background, which was complemented with plasmid encoding BaeSR (Yamazaki, unpublished). These results reinforced that the intracellular indole induces the acrD-gfp expression via BaeSR.
In Kawamura-Sato et al, they proposed that AcrEF-TolC of RND-system involves in indole efflux based on there was about 1.7 times difference in the intracellular indole concentration between the acrEF mutant and wild-type strain (Kawamura-Sato et al., 1999).
On the other hand, Pinero-Fernandez’s group argued using by measuring concentration of supernatant indole that the excretion of indole is a free diffusion without support of RND-efflux system or other protein to transport indole (Pinero-Fernandez et al., 2011).
Although, it is not clear from this literature whether RND-system affects the concentration of
47
intracellular indole. Then, I found that there was about 3 times difference in the amount of intracellular indole per cell between in the presence (330 µM) and the absence of TolC (990 µM). I thought that the reason why I had a difference of the estimated indole concentration with Kawamura-Sato et al is that they did not subtract a background quantity of the tnaA-deleted strain which produces no indole from an actual measurement (see materials and
methods). In contrast, based on the amount of extracellular indole, it appears that TolC had little effect on indole excretion. The final extracellular indole concentration is dependent on the excretion of indole which is biosynthesized in early exponential phase (Kobayashi et al., 2006). Thus, these integrated extracellular indole concentration may counteract the effect of indole efflux by TolC. A high pH condition increases the concentration of extracellular indole as a result of inducing the expression of tnaA (Blankenhorn et al., 1999; Wyeth, 1919). It also has been reported that TolC may play a physiological role in pH homeostasis through an interaction with the proton motive force in a multidrug efflux transporter (Deininger et al., 2011). In the tolC-deleted strain, the total amount of indole which was produced by one cell was smaller than that in the tolC+ strain. I suspected that this result reflects the difference in the amount of indole due to a change in the intracellular pH homeostasis with the loss of proton transfer by RND efflux systems.
The deletion of major RND-type inner membrane transporter AcrB and its paralog AcrF did not affect the AcrD-GFP expression, which raise the next obvious question whether
48
the interaction with TolC and inner membrane transporter involves in indole efflux. In fact, TolC∆loop mutant, which has no drug efflux activity, decreased the concentration of intracellular indole. These results suggested that TolC can transport indole to out of cell without an interaction with inner membrane transporter. TolC is the pore-like outer membrane channel whose entrance conformation is changed the closing-state into the opening-state by interaction with inner membrane transporter. However, non-interaction TolC state has been unclear in vivo. It is possible that indole directly passes through TolC whichever its state is switched.
The high concentration of extracellular indole (about 2 mM) induces the expression of multidrug transporter genes including acrD (Hirakawa et al., 2005). However, E. coli produces up to about 0.6 mM indole, which mainly depends on the concentration of tryptophan, in a rich medium including 0.5 mM tryptophan. The concentration of indole reaches about 4.5 mM at 24 h if the 5 mM tryptophan is ever added to the culture medium (Li
& Young, 2013). In the intestine of pig, the maximum indole concentration has been estimated to be 0.12 mM with about <0.5-0.7 mM (in the small intestine) and <0.1 mM (in the large intestine) tryptophan (Knarreborg et al., 2002). Thus, it is unthinkable that the extracellular indole reaches up to 2 mM under normal physiological conditions. It was suggested that E.
coli senses the change of indole concentration in not the supernatant but the cytosol. In my
additional considerations, the possibility still remains that E. coli senses not only the indole
49
but also the envelope stress of its accumulation. An envelope stress by indole affects the expression of various gene including multidrug efflux gene acrD via TCS BaeSR and CpxAR in E. coli (Hirakawa et al., 2005; Raffa & Raivio, 2002). In fact, it have been known that a high concentration of indole, which is toxic to E. coli, influences the persister cell formation (Vega et al., 2012). The major envelope sensor CpxA might sense injurious stimuli of inner membrane that was induced by intracellular indole, and it transmits this signal to the cognate response regulator CpxR or BaeR as a cross-talk. In the complex web of indole signal pathway, my results suggested that indole-induced gene expressions are caused by intracellular indole signals (Fig. III-4).