Myanmar's International Trade Competitiveness through the effect of FDI Comparing with Successful FDI promoted Asia Countries
Dissertation
Presented to Graduate School of Humanities and Social Sciences
(Doctor`s Course) OKAYAMA UNIVERSITY
In Partial Fulfillment of the Requirements for the Degree of Doctor of Philosophy in Economics (経済学)
By
KHIN MAR THET December 2018
i
TABLE Of CONTENTS
Acknowledgement……… vii-viii Abbreviations………...……… ix Abstract……… x-xi INTRODUCTION
Backgrounds of the Study--- 1-5 Objectives of the Study and Research Context--- 5-7 Organizational Structure of the Study --- 7-8 CHAPTER I: Evolution of Myanmar Trade Structure and Foreign Direct Investment
1.1. Introduction--- 9-10 1.2. Historical Background --- 11-13 1.3. Trade Flow and Structure from 1988 onwards--- 13-17
1.3.1 Trade Flow and Structure in Market Oriented Period
1.3.2 Trade Flow in Democratic Government Period (2011-2015)
1.3.3 Trade Flow in Current Public Democratic Government Period (2015 onwards) 1.4. Overview Trade Pattern and Policy--- 18-27 1.5. Foreign Direct Investment in Myanmar--- 27-33
1.5.1 Background
1.5.2. Recent FDI trends 1.5.3. Future FDI Trends
1.6 Conclusion --- 33-34 CHAPTER II: The Influential Determinants of FDI Inflow in Myanmar
2.1. Introduction--- 35-36 2.2. Previous Literature Review--- 36-38
ii
2.3. The Current Foreign Direct Investment Situation in Myanmar--- 38-39 2.4. The influential determinants of the FDI in Myanmar--- 39-48
2.4.1. Myanmar Investment Law 2.4.2. Current Financial sector
2.4.3. Special Economic Zones (SEZs) 2.4.4. Labour Utilization
2.4.5. Infrastructure Development 2.4.6. Tax Exemption
2.4.7. Trade Policy Issue
2.5. Policy Implications--- 49-50
CHAPTERI III: “Does the Gravity Model of Trade explain Myanmar’s Trade Structure?”
3.1. Introduction--- 51-53 3.2. Theoretical Framework and Previous Literature Perspective--- 53-58 3.3. Empirical Methodology --- 58-61 3.4. Data Description--- 61-65
3.4.1. The ASEAN Dummy 3.4.2. Trade Conformity Index
3.5. Empirical Results, Discussion, and Hypothesis Testing--- 65-79 3.6. Conclusion and Finding --- 80-82 CHAPTER IV: The Effects of Trade Openness and Exchange Rate Volatility on
Foreign Direct Investment of ASEAN and Myanmar
4.1 Introduction--- 83-92 4.1.1 The Relationship between Exports and FDI Net Inflows into Myanmar
4.1.2 Current Exchange rate System --- 4.1.3. Trade Restrictions, Uncertainty and Sanction Effect ---
iii
4.1.4. Influences on investment in Myanmar---
4.2. Theoretical background of FDI--- 92-95 4.3. Empirical Literature--- 95-99 4.4. Empirical Framework and Model--- 99-101 4.5. Data Description and Sources of Data--- 101-106 4.6. Results Discussion, Policy implication and Conclusion--- 106-117
4.6.1. The OLS regression estimations --- 4.6.2 The Fixed Effect and Random Effect estimation ---
4.7 Policy Implication and Conclusion--- 117-118 CONCLUSION
Major contributions and Policy Implication --- 119-123 Limitations of the study and suggestions for future research --- 123-124 Bibliography --- 125-134
iv
List of Tables
Table 1.1 Composition of Trade (1938-1962)--- 12
Table 1.2 Myanmar External Trade (2011-12 to 2017-2018 January)--- 15
Table 1.3 Myanmar Export Structure (2013-14 to 2017-18 January) --- 15
Table 1.4 Import Structure of Myanmar (2013-14 to 2017-18 January) --- 16
Table 1.5 Top Ten Trade Partners (2015-16 to 2018 January) --- 17
Table 1.6 Evolution of trade policy in Myanmar (1990 onwards)--- 19
Table 1.7 External Trade (1948-49 to 1985-86) --- 20
Table 1.8 External Trade (1980-2017) --- 22
Table 1.9 Permitted Foreign Direct Investment (1988-89 to 2017-18)--- 30
Table 1.10 Yearly Approved Amount of Foreign Investment (by Sector) --- 31
Table 1.11 Yearly Approved Amount of Foreign Investment (by country) --- 32
Table 2.1 Thilawa SEZ Investment (by Sector)--- 42
Table 2.2The Employment Opportunities from Investment Enterprises (2011-2012 to 2017-2018)--- 44
Table 2.3 List of existing Infrastructure Enterprises under the Foreign Investment Law--- 45
Table 3.1 Data description--- 64
Table 3.2 Standard Gravity Model (OLS Pool Estimation) Type I Estimation (without Ryi Ryj)--- 67 Table 3.3 Standard Gravity Model (Random Effect) Type I Estimation
v
(without Ryi Ryj) --- 68
Table 3.4 Standard Gravity Model (OLS Pool Estimation) Type II Estimation (without Ryi, Ryj) --- 69
Table 3.5 Standard Gravity Model (Random Effect) Type II Estimation (without Ryi, Ryj) --- 71
Table 3.6 Standard Gravity Model (OLS Pool Estimation) Type III Estimation (Combination)--- 72
Table 3.7 Standard Gravity Model (Random Effect) Type III Estimation (Combination)--- 75
Table 3.8 Standard Gravity Model (OLS Pool Estimation) --- 76
Table 3.9 Standard Gravity Model (OLS Pool Estimation)--- 77
Table 3.10 Standard Gravity model (OLS pool estimation)--- 78
Table 3.11 Hausman Test Result --- 79
Table 4.1 Data Description (Myanmar Model, Time Series Data Analysis)--- 102
Table 4.2 Data Description (ASEAN Model, Panel Data Analysis)--- 103
Table 4.3 Regression results (Myanmar FDI net inflows)--- 108
Table 4.4 The OLS Regression results (Myanmar FDI net inflow as a % of GDP) 110
Table 4.5 The Fixed and Random Effect results (ASEAN 8 FDI net inflows)--- 112
Table 4.6 Fixed Effect and Random Effect results (ASEAN 8 FDI as a % of GDP) 113
Table 4.7 The Fixed Effect and Random Effect results (ASEAN 7 FDI net inflows) 115
Table 4.8 Fixed and Random Effect results (ASEAN 7 FDI net inflow % of GDP) 116
Table 4.9 Results of the Hausman-Taylor Test --- 117
vi
List of Charts
Figure 1 Exports from ASEAN 10 countries (2000-2017)--- 2
Figure 2 Imports into 10 ASEAN countries (2000-2017) --- 4
Figure 1.1 Myanmar Export (1952-1953 to 1985-1986)--- 21
Figure 1.2 Myanmar Exports (1980-2017)--- 24
Figure 1.3 Myanmar Imports (1980-2017)--- 25
Figure 1.4 Export Value, Import Value and Trade Balance (2000-2017)--- 25
Figure 1.5 Myanmar’s Main Trade Partner (2018 - 2018 January) US$ in millions 26
Figure 1.6 Myanmar GDP Growth (Annual %) 1961-2016--- 27
Figure 1.7 Myanmar FDI, net inflows (% of GDP) 2000-2016--- 28
Figure 1.8 Approved Amount of FDI Inflows into Myanmar (2011-12 to 2017-18) 32
Figure 4.1 The Relationship between Exports and FDI Net Inflows into Myanmar (1990 -2017)--- 86
Figure 4.2 FDI and Exports share of GDP in Myanmar (1990-2014)--- 87
Figure 4.3 Exchange Rate Volatility in Myanmar (1990-2017)--- 89
Figure 4.4 FDI net inflows in ASEAN countries--- 104
Figure 4.5 Trade Openness in ASEAN countries--- 105
Figure 4.6 Exchange Rate Volatility in ASEAN countries--- 106
vii
Acknowledgement
This dissertation could not have been completed without helping and supporting of many people. I am incredibly grateful to my advisor Professor Masao Tsuri, for giving the excellent guidance, kind patient, and strong support with his comprehensive knowledge and persistent desire for research to be accomplished successfully. Moreover, I would particularly like to thank my co-supervisors, Professor Kensaku Kishida, Professor Jian Teng, Professor Masahiro Taguchi, and Hisashi Sawaki for their invaluable guidance and helpful suggestion throughout this research. I can’t have left to express my special thanks to Professor Dr.
Heather A. Montgomery who taught me a lot of research knowledge and got many research experiences from her excellent guidance while I studied in International Christian University in Tokyo, Japan. I ever would like to give my thanks to all Professors who have provided me with their academic advice and sharp criticisms to keep this study on the right track.
The government of Myanmar, the government of Japan, (Ministry of Education, Culture, Sports, Science and Technology (MEXT or Monbukagakusho Scholarship), Yangon University of Economics and Okayama University Graduate School of Humanities and Social Science have also been a source of support throughout my doctoral study and granting me a scholarship to make this study possible.
I would like to express my sincere gratitude to all of them. First of all, I would like to give special thanks to Professor Dr. Phyu Phyu Ei, Head of Department of Applied Economics, Yangon University of Economics and Professor Dr. Cho Cho Thein, Head of Department of Economics, Yangon University of Economics for their kind attention and
viii
giving valuable suggestions, excellent guidance to be fruitful accomplishments. I would also like to give a heartfelt special thanks to Professor Dr. Tun Aung, Rector, Meiktila University of Economics and Professor Dr. Thida Kyu, Pro-Rector, Meiktila University of Economics for introducing this great chance to me. I would also like to give a special thanks to Professor Dr. Htay Htay Lwin, Rector-Retd, Cooperative University for her kind support and encouragement since I was started as a teaching staff in life. Professor Dr. Kyaw Min Htun, Pro-Rector (Retd), Yangon University of Economics who ever supported me to recommend my effort to do further study abroad. I also would like to thanks to Daw Kay Khine Nyein, Associate Professor, Department of Economics, Meiktila University of Economics who ever intentionally give me advice and suggestion whenever I need concerns with my research works.
I would also like to express my enormous gratitude to my parents, all family members and relatives that I have received strong support and endless encouragement along my doctoral study life in Japan. I am very grateful to their kind understanding and fruitful support.
I will forever be thankful to all of my former teachers who encouraged and supported me to be owned bright future along the whole life. Finally, I would like to thank all my colleague, friends for standing by my side throughout the whole study period and their endless love and friendship.
ix
Abbreviations
ASEAN Association of Southeast Asian Nations CBM Central Bank of Myanmar
CIL Citizens' Investment Law CLM Cambodia, Lao and Myanmar
DICA Directorate of Investment and Company Administration DOTs Direction of Trade Statistics
EU European Union
ERIA Economic Research Institute for ASEAN and East Asia FDI Foreign Direct Investment
FIL Foreign Investment Law GDP Gross Domestic Product
GSP Generalized System of Preferences IFS IMF International Financial Statistics
ISI Import-Substituting Industrialization strategy MIL Myanmar Investment Law
MIC Myanmar Investment Commission NIEs Newly Industrial Economies NES Myanmar National Export Strategy
OECD Organization for Economic Co-operation and Development OLS Ordinary Least Square
SEZs Special Economic Zones SMEs Small and Medium Enterprises
UNCTAD United Nations Conference on Trade and Development US United States
WTO World Trade Organization
x
Abstract
Trade can promote the development of a country by improving factors such as technological progress, the importation of technical knowhow, greater access to resources, the expansion of markets and attracting foreign direct investment (FDI). This study mainly focuses on how Myanmar’s trade competitiveness can increase through higher foreign direct investment inflows by comparing Myanmar to other Asian countries with successful FDI inflows.
When analyzing the main theme, this study is divided into four parts. Firstly, it describes the evolution of Myanmar’s trade development and foreign direct investment inflows while explaining historical background conditions, the current situation and recent and possible future trends of FDI by examining past data.
Secondly, it determines the influential determinants of FDI inflow in Myanmar and describes the current Myanmar economy. Many different factors affect FDI inflows and it is believed that FDI contributes to the improvement of an economy by enhancing a nation’s economic growth.
Thirdly, an analysis of the trade structure between Myanmar and 20 partner countries estimated with a standard gravity model using panel data. Although GDP and distance variables can explain Myanmar’s trade structure, an ASEAN dummy cannot explain what Myanmar still needs to do in cooperation with ASEAN for trade improvement. According to the Trade Conformity Index (TCI), Myanmar’s trade structure shows that trade volume increases with falling complementary trade and it has an increasingly competitive trade
xi
structure using differentiated product models with intra-industry trade. The standard gravity model can explain Myanmar’s trade structure and flow.
The final part of this study explores the impact of trade openness and exchange rate volatility on foreign direct investment in Myanmar and the eight ASEAN member countries covered by the dates of this case study (1990-2014).
Some consequences of the previous long-term sanctions imposed by the US and the EU were that Myanmar could not promote its trade sector and had difficulty attracting foreign direct investment. Exchange rate volatility was inversely related to FDI inflow due to Myanmar’s long history of using a de facto multiple exchange rate system. In the analysis of ASEAN countries, trade openness and the export per GDP ratio were directly related to FDI inflow as a percentage of GDP and proves that a nation’s free trade policies contribute to foreign direct investment inflow per GDP. The larger the exchange rate volatility, the greater the impact on FDI inflow in ASEAN countries can be shown for both explained variables.
The analysis model proves that exchange rate volatility’s impact on FDI inflow is an appropriate explanation regarding Myanmar’s FDI inflow and also proves that trade openness affected FDI inflow per GDP in ASEAN countries.
1
INTRODUCTION
Background of the Study
Trade is one influential way towards economic development for countries all over the world. Moreover, trade played a vital role in the historical development of Third World countries. Likewise, international trade allows for the efficient allocation of resources and supports human welfare by applying a division of labor. In addition, trade can promote the development of the country by improving its technological progress, the importation of technical knowhow, greater access to resources and an expansion of markets that come from specialization, encourage strong competition and attract foreign direct investment (FDI). Most ASEAN countries have achieved outstanding economic progress by partaking in regional integration. In 1992, Myanmar joined the regional cooperation agreement called the Greater Mekong Sub Region (GMS) which including China, Thailand, Laos, Cambodia and Vietnam to raise trade and cross-border investment. Similarly, Myanmar is attempting to strengthen its economy with membership in the Association of Southeast Asian Nations (ASEAN) and has chances to utilize its singular geographic position as a link between South and Southeast Asia, which can offer new opportunities. As ASEAN is among the fastest growing economies in the world, stronger integration between member countries will allow ASEAN to continue to out-perform the rest of the global economy.
Since the Democratic government took power and changed many administrative systems in the country, Myanmar has a chance to create new economic opportunities through trade sector openness, encouraging foreign direct investment and moderating its financial sector
2
properly. Myanmar’s long-time policy of self-reliance allowed the country to survive in isolation for many decades without taking much support from the world economy or regional communities. Many economic reforms have been made in the trade sector and other essential sectors. As a market economy, the foreign trade policy of Myanmar is mainly a self- determining one and has remained at the center of debate on the economic policies implemented in Myanmar. Nevertheless, transforming to an open-door policy and its related trade growth are the most powerful forces to strengthen Myanmar’s economy. With this favorable situation, Myanmar may develop its trade sector development by setting up appropriate trade policies accompanied by the utilization of domestic natural resources and human resources.
Figure 1 Exports from ASEAN 10 countries (2000-2017)
Source: IMF: International Financial Statistics (IFS)
0.00 50,000.00 100,000.00 150,000.00 200,000.00 250,000.00 300,000.00 350,000.00 400,000.00 450,000.00 500,000.00
Exports ($mils)
Year 10 ASEAN countries Exports (2000-2017)
Brunei Cambodia Indonesia Laos Malaysia
Myanmar Philippines Singapore Thailand Vietnam
3
Among the exports from 10 ASEAN countries (2000-2017), Singapore was the largest exporter followed by Malaysia, with Thailand in the third position. Indonesia, Vietnam and the Philippines followed in relative positions. All of these countries experienced a substantial increase in export value since 2001 with slight changes during this period. In addition, after international financial crisis in 2008, exports decreased in nearly all of these countries and from 2016 to 2017 their exports also increased. Myanmar, Cambodia, Laos and Brunei had far lower export totals without a substantial difference between them. (Fig. 1)
Many different factors affect the volume and distribution of FDI in developing countries around the world. Many researchers have found that the primary determinants of major FDI inflows including political stability, favorable policies regarding tax and subsidies, the existence of an appropriate business environment, better administrative procedures and low level of corruption. Since globalization, the world economy is more characterized by increased integration and ties with between countries in which Foreign Direct Investment (FDI) constitutes a business phenomenon of vital importance and frequency. Likewise, it is believed that FDI contributes to the improvement of macroeconomic outcomes of the host countries, and from there it can enhance a nation’s economic growth.
When checking the imports of 10 ASEAN countries (2000-2017), Singapore is also in the highest position with Thailand following in second position and Malaysia third. Indonesia, Vietnam and the Philippines followed in relative positions. Like the above-mentioned export values, these countries had a substantial increase in import values since 2001 with slight changes during the period. However, in 2009, after the 2008 international financial crisis, imports decreased substantially and increased later in the period. Myanmar, Cambodia, Laos
4
and Brunei had the lowest import values without a substantial difference between them although there was a small increase later in the period. (Fig. 2)
Figure 2 Imports into 10 ASEAN countries (2000-2017)
Source: IMF: International Financial Statistics (IFS)
Myanmar has a significant probability to promote its economic development based on an FDI export-oriented driven growth strategy through East Asia's production networks such as that adopted by Vietnam in the past two decades. Likewise, FDI is a critical element for the development of Myanmar in the future, considering that the most advanced ASEAN countries, plus countries such as Malaysia, Thailand and China that have shown good economic performances after receiving large amounts of FDI. On the other hand, these countries have deregulated FDI policies and have demonstrated outstanding accomplishment in attracting FDI.
0.00 50,000.00 100,000.00 150,000.00 200,000.00 250,000.00 300,000.00 350,000.00 400,000.00
Imports ($mils)
Year 10 ASEAN countries Imports (2000-2017)
Brunei Cambodia Indonesia Laos Malaysia
Myanmar Philippines Singapore Thailand Vietnam
5
Like other Asian countries including China, Bangladesh, Cambodia, and Vietnam, Special Economic Zones (SEZs) in Myanmar have played an essential role in jumpstarting manufacturing activity to attract FDI (IMF Country Report, 2018). Like China and Vietnam, Myanmar has the comparative advantage of lower labor cost. FDI has played a central role in transforming Vietnam from a country exporting mainly commodities to one exporting a diversified set of products. Vietnam also took some practical steps while experiencing a string of success in various aspect of FDI promotion and has carried out measures to attract FDI in line with deepening integration into the regional and world economies. Following their example, Myanmar has also gained considerable trade competitiveness in attracting FDI in export-oriented labor-intensive sectors.
Objectives of the Study and Research Context
This research aims to achieve four primary objectives:
Firstly, the objective of this study was to investigate the evolution of Myanmar’s trade sector and foreign direct investment inflows into Myanmar by showing both the historical background conditions and the current situation. This historical description will weigh factors for improving the process and draw out some hindering conditions for the improvement of trade and FDI in Myanmar.
Secondly, this paper points out the influential determinants of FDI inflow in Myanmar by showing the current situation of Myanmar’s economy as a case study. Many researchers have described the primary determinants of major FDI inflows. Since globalization, the world economy is more characterized by increasing integration and ties between countries in which
6
FDI constitutes a business phenomenon of vital importance and frequency. Likewise, many different factors affect the volume and distribution of FDI in developing countries of the world and it is believed that FDI contributes to the improvement of macroeconomic outcomes of the host countries and enhances a nation’s economic growth.
Thirdly, this study intends to assess Myanmar’s trade potential and complementary trade in the future by empirically investigating its trade flows by comparing them with trading partner countries. It seeks to draw out the strengths and weaknesses of Myanmar’s trade competitiveness by analysing bilateral trade partner countries by using the trade conformity index (TCI).
Finally, this paper endeavors to make a comparison and find the determinants of FDI by comparing Myanmar with Asian countries that have successfully promoted FDI and trade impacts on FDI. In analyzing the impacts of FDI on key economic variables, this research seeks to prove the impact of trade openness, exchange rate volatility and other economic variables on FDI inflow by focusing on seven ASEAN countries (excluding Singapore, Brunei, and Timor-Leste and Myanmar) by using the panel data analysis of fixed effect and random effect model estimation and a Hausman test to check whether REM is appropriate or not. It intends to find the proper techniques and means for FDI promotion in Myanmar using OLS estimation. It also attempts to highlight appropriate ways and methods for trade sector development through FDI promotion in Myanmar. Finally, it seeks to point out the negative and positive effects of FDI, along with future trends in FDI and trade potential that Myanmar will face in the coming future.
This research seeks to answer the following research questions:
7
1. What are the influential factors on Myanmar’s trade structures, flows and patterns?
2. What are the influential determinants of FDI inflows to Myanmar?
3. Does the gravity model of trade explains Myanmar’s trade structure and trade pattern using the trade conformity index?
4. How can trade openness, exchange rate volatility and key economic variables impact FDI inflow to Myanmar and other ASEAN countries?
Organizational Structure of the Study This study is organized into six parts:
First, an introduction to the background of the study, the objectivities of the research, the context of the study and the organizational structure of the study.
Chapter 1 summarizes the evolution of Myanmar’s trade structure and foreign direct investment with explanations of the historical background of trade and FDI, the evolution of trade structures and policies, the relationship between Myanmar’s trade policy and its political situation, recent and future FDI trends provided by examining data reported in past years.
Chapter 2 is a qualitative analysis of the influential determinants of FDI inflow into Myanmar using the current economy as a case study. This part of the study is made up of four sections; exploring some perspectives from previous literature, current FDI trends in Myanmar, the influential determinants of FDI in Myanmar, and FDI policy implication for Myanmar.
Chapter 3 investigates the current trade structure and flow in Myanmar using the gravity model to compare the country with the bilateral trade partners including both Asian and
8
Western countries. This research endeavour is made up of five sections; exploring the theoretical framework and some perspectives from previous literature, illustrating the empirical methodology, data description and finally discussing the empirical results and conclusion of the main findings along with some remarks.
Chapter 4 verifies the effects of trade openness and exchange rate volatility on foreign direct investment in ASEAN and Myanmar using panel data and time series data analysis.
This chapter of the study contains the following five sections; exploring some perspectives from previous literature, the theoretical foundation of FDI, illustrating the research methodology and empirical model, data description and sources of data and finally explaining the results, including a discussion on policy implications, and the conclusion of the study.
Finally, there is a summary highlighting how and what this study can contribute to Myanmar and other ASEAN countries’ FDI and trade improvement. As for policy implications, weaknesses and strong points are described along with some of the limitations of the study with some suggestions for further potential research concerns about foreign direct investment and trade issues for the future.
9 CHAPTER I
Evolution of Myanmar Trade Structure and Foreign Direct Investment
1.1 Introduction
The objective of this study was to investigate the evolution of Myanmar’s trade sector and foreign direct investment (FDI) inflows into Myanmar. The qualitative analysis based on descriptive studies uses secondary data from Myanmar governmental organizations, international organizations and other relevant publications. This study contains four sections;
exploring the historical background of Myanmar trade structure, explaining trade flow and structure from 1988 onwards, presenting an overview of trade patterns and policy, and finally describing foreign direct investment in Myanmar.
Myanmar is located in mainland Southeast Asia and also situated on the dynamic crossroads linking Southeast Asia, Western China (Yunnan) and the Indian sub-continent.
Myanmar has a potentially vast market and is a sub-regional economic nodal link progressing towards international integration. At the beginning of the sixteenth century, during the times of Burmese kings, Myanmar traded with neighboring Southeast Asian countries and exported mainly rice to European countries (Myan Than (1992), p 6). When the British annexed Myanmar in 1886, the country adopted a laissez-faire system with free trade. After the Revolutionary Council took power in 1962, the government introduced an import substitution industrialization (ISI) policy to encourage foreign investment.
In 1998, under the market-oriented economics system, government liberalized trade and set three basic categories of trade: trade, transit trade, and border trade (Myat Thein (2004)).
10
Though the government stated that export promotion and import substitutions would be the main planks of trade policy, export rules and regulations were revised during 1998-99. After the 2010 election, the democratic government adopted an open-door policy to create more economic opportunities. At the same time, Myanmar passed trade liberalization and had a strong desire for free and fair trade with the rest of the world. Myanmar has adopted bilateral trade policies as well as testing multilateral trading policies in practice. The composition of both export and import changed after 2010 onwards.
Historically, Myanmar has been familiar with foreign investment and external business operations since the seventeenth century. Foreign direct investment has played a significant role in the recently industrializing countries of Southeast Asia. Singapore, Malaysia, Hong Kong, China, and Thailand have been large recipients of FDI inflow since 1985. Myanmar’s FDI inflow has greatly increased since 1988. Most of the investment come from Asia Pacific and Association of Southeast Asian Nation (ASEAN) countries. Most of the FDI was in the primary (mostly agricultural) sector, the secondary (manufacturing) sector was second and the tertiary (services) sector was third during the SLORC government period between 1988 and 1997. After several burdensome trade restrictions were lifted in 2016, the business environment is set for dramatic improvement. The resultant new environment has substantially eased the way for international trade and investment and has provided a better selection of business partners. Myanmar is now encouraging an export-driven growth strategy through promoting FDI inflows. This study seeks to highlight the evolution of Myanmar’s trade structure and foreign direct investment to promote economic development.
11 1.2. Historical Background
After the British annexation of Lower Burma in the early 1850s, Upper Burma controlled foreign trade, and Lower Burma adopted a free trade policy. Mali (as cited by Myat Thein (2004)) said, “Laissez-faire and competitive enterprise, two adjuncts of Anglo-Saxon liberalism, were the basic principles of commercial policy of British rule in Burma. As the Suez Canal opened in 1869, Myanmar had some experience in foreign trade as an export economy and the largest rice exporter in the world at the time. The general trade patterns of Myanmar and other Southeast Asian countries were the same at the time.
In 1957, U Nu welcomed the active participation of private enterprises in the national economy by guaranteeing them against nationalization for ten years and the government discouraged all economic activities of foreigners. Myanmar’s trade sector flourished considerably with 11 agricultural products accounting for about 44% of total import, and an estimated 50% of GDP being related to export in parliamentary democracy period. As for the composition of export, rice products became more prominent in the post-war years than in the pre-war period. Rice was the major earner of foreign exchange and accounted for more than 50% of export earnings and forest products, mainly teak, came to be the second most important export. In 1957-58, the trade surplus disappeared or became minimal level due to the declining unit value of export. Many studies mentioned that the commercial policy of the government to levy very low tariffs on the import of industrial raw materials and machinery led many entrepreneurs to set up small-scale factories to evade the relatively higher tariffs on finished goods and these industries were very import dependent import substituting industries.
12
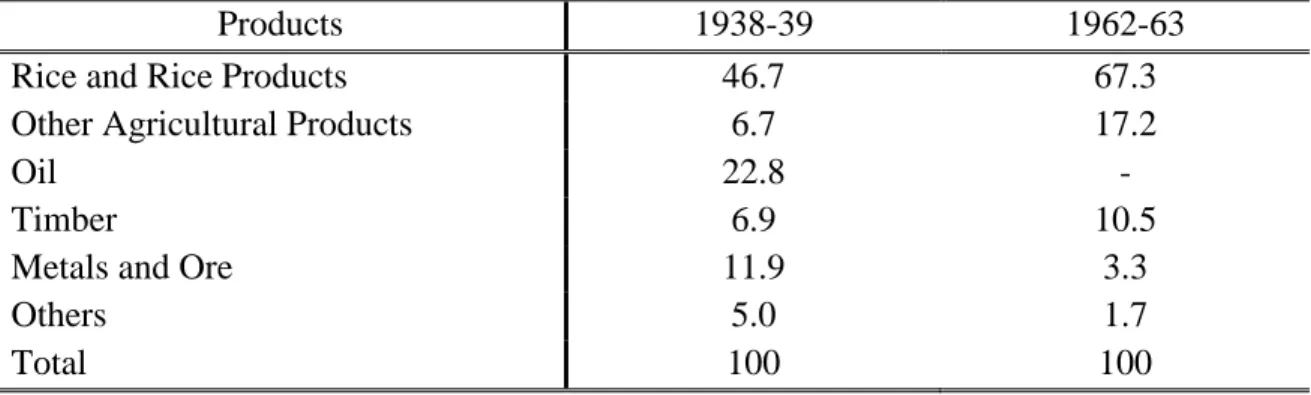
Table 1.1 compares the composition of trade between 1938-39 and 1962-63. Rice and rice products were by far the largest portion of trade.
Table 1.1 Composition of Trade (1938-1962, %)
Products 1938-39 1962-63
Rice and Rice Products 46.7 67.3
Other Agricultural Products 6.7 17.2
Oil 22.8 -
Timber 6.9 10.5
Metals and Ore 11.9 3.3
Others 5.0 1.7
Total 100 100
Source: Myat Thein (2004) Economic Development of Myanmar, p 31
After the Revolutionary Council took over power in 1962, the government adopted the
“Burmese Way to Socialism” as its political ideology and pursued a self-reliant socialist economy. The government controlled the trade sector as a monopoly handled by state producers. Export were indirectly taxed by maintaining national buying prices of commodities below their international prices by State Owned Economic Enterprises (SEE). Import were managed under government priorities and the availability of foreign exchange. However, rice export fell sharply, and this decline directly led to a drastic decline in export earnings and indirectly led to a decrease in import, savings, investment, and growth in GDP. The value of import was mainly determined by export revenues due to the government neither eager to take official development assistance (ODA) nor to borrow substantially from abroad. The shortage of foreign exchange limited the amount of consumer goods that could be imported, and a black market appeared. External trade by the private sector was conducted by market-determined parallel exchange rates (Mya Than and Myat Thein (2004)). In the early 1980s, Myanmar’s
13
external trade direction changed slightly. The economic situation in the country had worsened, and it gave rise to three distinct economies: the nominal official economy, and two hmaung- kho (literally: “taking refuge in the dark”) black-market economies in 1967 Myat Thein (2004).
1. 3. Trade Flow and Structure from 1988 onwards
1. 3. 1 Trade Flow and Structure in Market-Oriented Period
After the State Law and Order Restoration Council (SLORC) government took over political power in 1988, it introduced a market-oriented economic system and became outward-looking in orientation. The SLORC government set encouraging private investment and entrepreneurial activity, opening the economy to foreign direct investment and promoting export as the main objectives of economic reforms. In 1989 foreign trade was liberalized to allow private participation and an “open-door” policy towards FDI and foreign trading firms.
The state monopoly on both domestic and foreign trade was abolished, making way for private trading Tin Maung Maung Than (2007). Exporters and importers had permission to be registered and getting permission for foreigners to set up companies, opening the economy to direct foreign investment and promoting export were key points for trade development.
The government introduced an “import first and export later” system, allowing foreign companies to import commodities for sale on a consignment basis, In 1996, the government decided on three basic principles to guide trade policy: Trade activities 1) should be in the interest of the State and the people, 2) should not be a burden on the people, and 3) should envisage a long-term stable trading system rather than gaining short-term profit. The “Import first and export later” scheme has varied over time due to various economic and political situations. Some export products such as agricultural products, forest products, petroleum
14
products, and precious stones and minerals are controlled by SEEs. Importers can import all the same products that are controlled by importing SEEs and the Ministry of Commerce. The official exchange rate only applies to within the public sector, and the private sector has no chance for any allocation of foreign exchange at the official exchange rate. It was difficult to conduct normal trade and economic relations with the outside world at the official exchange rate. However, the open-door policy generated significant changes and trade volume with neighboring countries expanded.
1. 3. 2 Trade Flow in the Democratic Government Period (2011-2015)
While adopting a free trade policy, the new democratic government made many reforms to all sectors of the economy including trade. To promote the external sector and accelerate integration into the world economy, the government tried to open the economy more freely and revised trade-related legislation such as preparing a competition law, a consumer protection law, and comprehensive intellectual property legislation. To develop trade, the government set four main objectives: 1) To support internal and external trade activities for the economic development of the country, 2) To upgrade the commercial efficiency of public and private trading houses, 3) To increase the foreign exchange earnings of the country by export promotion, and 4) To encourage the trade-related activity of cooperative and private entrepreneurs. The government formalized border trade by designating official points of entry and setting up customs and banking facilities.
Table 1.2 shows import increasing over time and the trade balance shows a deficit consecutively from 2012-13 onwards. Export volume also increased considerably although import increased parallel to export and have generated a long-term trade deficit. Currently,
15
import is steadily increasing, and the trade balance has been in deficit up to January 2018, although the deficit gap has slightly decreased compared to 2016-17. An export value smaller than import value for two years and a trade balance still in deficit shows Myanmar was still a high importer of capital goods and intermediate goods during those years.
Table 1.2 Myanmar External Trade (2011-12 to 2017-2018 January) US $ in millions Years Export Import Total Trade Surplus/Deficit
2011-2012 9,135.6 9,035.0 18,170.6 Surplus
2012-2013 8,977.0 9,068.9 18,045.9 Deficit
2013-2014 11,203.9 13,759.5 24,963.4 Deficit
2014-2015 12,523.7 16,633.1 29,156.8 Deficit
2015-2016 11,136.9 16,577.9 27,714.8 Deficit
2016-2017 11,999.0 17,211.0 29,210.0 Deficit
2017-2018 (JAN) 11,912.0 15,398.0 27,310.0 Deficit Source: Myanmar Customs Department
Table 1.3 Myanmar Export Structure (2013-14 to 2017-18 January) US $ in millions Commodity 2013-14 2014-15 2015-16 2016-17 2017- 18 (JAN) Agricultural
Products
2661 2920 2616 2928 2525
Animal Products 15 8 8 11 34
Marine Products 516 421 469 582 562
Mineral Products 1339 1499 968 1011 1254
Forest Products 948 94 213 247 179
Manufactured Products
4638 6525 5734 5478 5469
Others 1087 1057 1129 1743 1891
Total Export 11204 12524 11137 11998 11912
Source: Myanmar Customs Department
Table 1.3 shows the share of manufactured products has increased to roughly 50% of total export volume. Agricultural products were the second largest export category during the listed period, and mineral products decreased sharply in 2015-16. The US released its sanctions,
16
which gave Myanmar favorable trade conditions such as a considerable improvement in the industrial sector and an increase in FDI inflows, and manufactured products were the largest export category. However, agricultural products still dominated with the second largest share in Myanmar’s export structure.
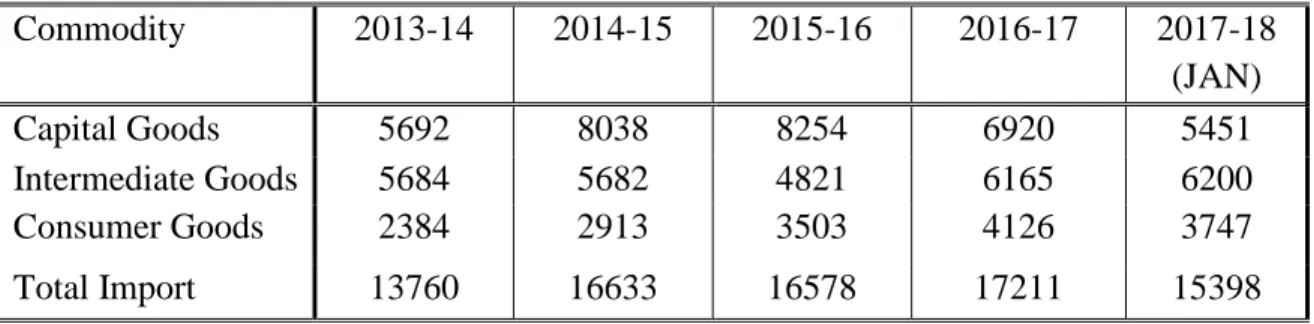
Table 1.4 shows capital good and intermediate goods import are higher than other categories due to Myanmar’s need to set up and develop the industrial sector and to promote export. capital goods and consumer goods import slightly decreased from 2016-17 to 2017- 18 January and the total value of import also decreased.
Table 1.4 Import Structure of Myanmar (2013-14 to 2017-18 January) US $ in millions
Commodity 2013-14 2014-15 2015-16 2016-17 2017-18
(JAN)
Capital Goods 5692 8038 8254 6920 5451
Intermediate Goods 5684 5682 4821 6165 6200
Consumer Goods 2384 2913 3503 4126 3747
Total Import 13760 16633 16578 17211 15398
Source: Myanmar Customs Department
1. 3. 3 Trade Flow in the Current Democratic Public Government Period (2015 onwards) After the November 2015 election, the National League for Democracy (NLD) become the country’s first civilian government and has allowed for significant economic reforms in both domestic and external sectors. Trade and investment in Myanmar have soared, buoyed by ongoing efforts to liberalize the economy and a successful political transition. The export promotion policy of the government was the extension and exploration of foreign markets to
17
promote the export of traditional and value‐added products by utilizing natural and human resources effectively.
Table 1.5 Top Ten Trade Partners (2015-16 to 2018 January) US$ in millions Country 2013-14 2014-15 2015-16 2016-17 2017-18 (Jan)
China 7033 9712 10992 10805 9684
Thailand 5666 5711 4866 4288 4074
Singapore 3604 4895 3696 2967 3100
Japan 1809 2305 1846 2032 1558
India 1636 1340 1712 1943 1257
Malaysia 948 1009 750 980 931
Indonesia 499 636 742 827 840
Korea 1570 863 657 866 635
Usa 104 544 197 691 618
Vietnam 281 321 347 494 592
Source: Myanmar Ministry of Commerce
Import policy emphasized the importation of capital goods as a priority, raw materials for production, other essential products to provide for public health and export promotion. The business environment was set for dramatic improvement after several heavy trade restrictions were lifted in 2016. Myanmar was added to the US’s Generalized System of Preferences (GSP), which exempted US-bound export from high import taxes, which were another significant trade restriction. Although China has been the largest trade partner for Myanmar for a long time, its overall significance has decreased compared to previous years. Thailand is the second and Singapore is the third largest trading partner at present. Bilateral trade with Japan increased in 2017-1018. (see Table 1.5).
18 1. 4. Overview Trade Pattern and Policy
The importance of foreign trade in Myanmar can measured by the “trade openness ratio”, which estimates how an economy is open to attract foreign trade. Foreign trade did revive during the parliament regime overthrown in 1962. With the collaboration of some enlightened socialist scholars, the government drafted an economic plan that strongly advocated an
"outward-looking" development strategy, in part inspired by the strong free trade views of Dr.
Hla Myint. This plan was, however, rejected. Until 1988, Myanmar adopted an inward- looking and self-reliant pattern of development policy, all the vital means of production and distribution were nationalized, and foreign trade became a monopoly of the state. Since foreign trade came to be a monopoly of the state in 1962, export volume and value declined significantly from 1964-65 to 1970-71. Myanmar’s evolution of trade policy and structure from 1990 onwards is shown in Table 1.6 with some facts to compare each period’s policy and structures.
The long-term plan began with a Four-Year Plan in 1974 which was together comprised the Twenty-Year Plan (1974-75 to 1993-94). Although it emphasized industrialization, it allowed spending on the agricultural sector and addressed inefficiency in public sectors (Mya Than and Joseph L.H. Tan (1990)). Another reason for export volume decreases in that period was the 1973 world oil price shock, which hit the Myanmar economy and external sector.
Export volume rapidly decreased from US$113 million in 1973-74 to US$53 million in 1974- 75. In the early 1980s, the direction of Myanmar’s external trade showed little change from the past. (see Figure 1.1 and Table 1.7).
19
Table 1.6 Evolution of trade policy in Myanmar (1990 onwards)
Years Economic
System
Trade policy
Instruments of Trade
Sanctions 1990-2010
Military Regime
Market oriented economic system
Liberalization of domestic and foreign trade, active
participation of private business in foreign trade
“Import first and export later” scheme, export and import on a consignment basis
EU-US sanctions
2011-2015 Democratization
Market economic system
Export
promotion free trade policy (open-door policy) Inviting foreign direct investment to develop trade to promote export
Reduction and exemption of commercial tax on export, income tax on income from CMP export, state trading monopolies abolished
EU reinstated
GSP, US
allows
resumption of the GSP
2016 to present Democratic Public Government
Market economic system
Free trade policy export driven growth strategy
To promote exporting value- added goods and finished goods instead of exporting raw materials
Sanction release
Source: Author’s creation
After 1988, the Myanmar government undertook reforms intended to enhance the transparency of trade-related policies and regulations, thereby increasing public accountability. A Foreign Exchange Certificate (FEC), equivalent to the US one-dollar value, was introduced in February 1993. In April 2012, the government formally abolished the dual
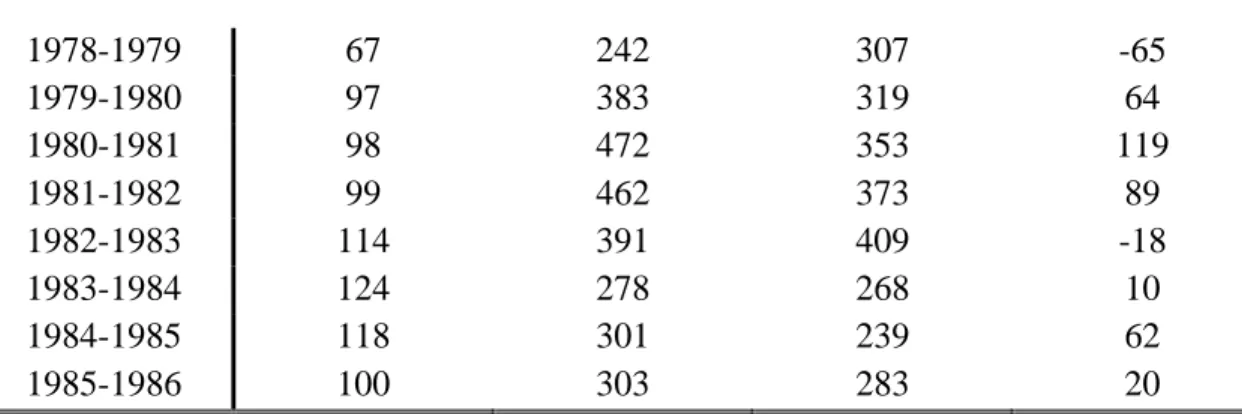
20 Table 1.7 External Trade (1948-49 to 1985-86)
Year Export
Volume
Export Value Import Value Balance Of Trade
Indices US $ US $
(base year
1985=100)
in millions in millions (+, -)
1948-1949 229 176 53
1949-1950 222 113 109
1950-1951 139 91 48
1951-1952 212 137 75
1952-1953 93 264 192 72
1953-1954 134 238 178 60
1954-1955 147 251 204 47
1955-1956 169 227 181 46
1956-1957 165 250 198 52
1957-1958 136 229 297 -68
1958-1959 166 194 204 -10
1959-1960 170 224 223 1
1960-1961 159 224 259 -35
1961-1962 179 222 215 7
1962-1963 158 265 219 46
1963-1964 122 270 234 36
1964-1965 54 233 271 -38
1965-1966 77 225 247 -22
1966-1967 80 194 158 36
1967-1968 53 124 124 0
1968-1969 73 111 114 -3
1969-1970 67 132 165 -33
1970-1971 98 108 155 -47
1971-1972 114 124 168 -44
1972-1973 118 120 133 -13
1973-1974 113 130 106 24
1974-1975 53 188 176 12
1975-1976 51 173 197 -24
1976-1977 73 206 177 29
1977-1978 75 214 241 -27
21
1978-1979 67 242 307 -65
1979-1980 97 383 319 64
1980-1981 98 472 353 119
1981-1982 99 462 373 89
1982-1983 114 391 409 -18
1983-1984 124 278 268 10
1984-1985 118 301 239 62
1985-1986 100 303 283 20
Sources: Myat Thein (2004) Economic Development of Myanmar, page -75.
exchange rate system, which had hindered foreign trade and investment. The current exchange rate is a “managed float regime” that closely reflects the true market rate. Nevertheless, the private financial sector, foreign exchange market, and regulatory framework remain significantly underdeveloped.
Figure 1.1 Myanmar Export (1952-1953 to 1985-1986)
Sources: Myat Thein (2004) Economic Development of Myanmar, page-75.
Dunn and Mutti (2004) stated that a country’s terms of trade (i.e. the ratio of an index of a country’s export prices to an index of import prices) are determined in the world markets for its export and import. Myanmar is a primary products exporter and manufactured and
0 50 100 150 200 250 300 350 400 450 500
1952-1953 1953-1954 1954-1955 1955-1956 1956-1957 1957-1958 1958-1959 1959-1960 1960-1961 1961-1962 1962-1963 1963-1964 1964-1965 1965-1966 1966-1967 1967-1968 1968-1969 1969-1970 1970-1971 1971-1972 1972-1973 1973-1974 1974-1975 1975-1976 1976-1977 1977-1978 1978-1979 1979-1980 1980-1981 1981-1982 1982-1983 1983-1984 1984-1985 1985-1986
Export Volume(indices) and Value(US$mils)
Year
Myanmar Export(1952-1953 to 1985-1986)
Export Volume Export Value
22
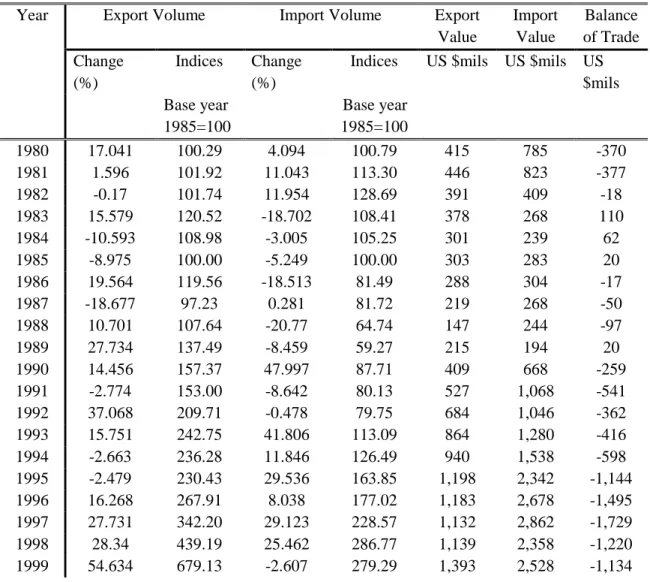
investment goods importer at unfavorable terms of trade. Many developing countries experience that their terms of trade are unstable because they export large volumes of a small number of primary products into highly competitive markets. Moreover, sometimes, the home country cannot be offset by a nominal depreciation or devaluation of money due to rapid inflation. From 1980 to 1985, Myanmar’s export volume and values roughly followed this trend. After the military government took power in 1988, export values were larger than the export volume.
Table 1.8 External Trade (1980-2017)
Year Export Volume Import Volume Export
Value
Import Value
Balance of Trade Change
(%)
Indices Change (%)
Indices US $mils US $mils US
$mils Base year
1985=100
Base year
1985=100
1980 17.041 100.29 4.094 100.79 415 785 -370
1981 1.596 101.92 11.043 113.30 446 823 -377
1982 -0.17 101.74 11.954 128.69 391 409 -18
1983 15.579 120.52 -18.702 108.41 378 268 110
1984 -10.593 108.98 -3.005 105.25 301 239 62
1985 -8.975 100.00 -5.249 100.00 303 283 20
1986 19.564 119.56 -18.513 81.49 288 304 -17
1987 -18.677 97.23 0.281 81.72 219 268 -50
1988 10.701 107.64 -20.77 64.74 147 244 -97
1989 27.734 137.49 -8.459 59.27 215 194 20
1990 14.456 157.37 47.997 87.71 409 668 -259
1991 -2.774 153.00 -8.642 80.13 527 1,068 -541
1992 37.068 209.71 -0.478 79.75 684 1,046 -362
1993 15.751 242.75 41.806 113.09 864 1,280 -416
1994 -2.663 236.28 11.846 126.49 940 1,538 -598
1995 -2.479 230.43 29.536 163.85 1,198 2,342 -1,144
1996 16.268 267.91 8.038 177.02 1,183 2,678 -1,495
1997 27.731 342.20 29.123 228.57 1,132 2,862 -1,729
1998 28.34 439.19 25.462 286.77 1,139 2,358 -1,220
1999 54.634 679.13 -2.607 279.29 1,393 2,528 -1,134
23
2000 30.39 885.52 -10.065 251.18 2,174 3,221 -1,047
2001 40.772 1246.56 21.467 305.10 2,901 2,799 102
2002 9.799 1368.71 -15.563 257.62 2,956 2,856 100
2003 -3.054 1326.91 -6.412 241.10 2,656 2,780 -123
2004 -2.16 1298.25 -16.748 200.72 2,896 2,741 155
2005 17.46 1524.93 -2.9 194.90 3,765 2,707 1,058
2006 41.535 2158.30 44.598 281.82 4,415 2,887 1,528 2007 15.38 2490.25 81.707 512.09 5,146 3,790 1,356 2008 0.285 2497.35 21.133 620.31 6,650 4,652 1,997 2009 13.116 2824.90 2.334 634.79 7,006 3,669 3,337 2010 8.958 3077.95 12.711 715.47 7,704 4,278 3,426
2011 8.597 3342.57 23.005 880.07 8,208 8,712 -504
2012 1.008 3376.26 18.071 1039.10 9,160 8,004 1,156 2013 10.747 3739.11 17.258 1218.43 11,543 12,200 -656 2014 -5.318 3540.26 -13.705 1051.45 11,551 16,459 -4,907 2015 -3.02 3433.34 14.028 1198.94 12,247 17,132 -4,885 2016 2.72 3526.73 6.143 1272.59 11,725 15,921 -4,196 2017 10.444 3895.06 10.015 1400.05 11,158 18,051 -6,893 Sources: IMF, Direction of Trade Statistics (May 2018), World Economic Outlook Database (Sept 2011) and World Economic Outlook Database (April, 2018). Following the IMTS 2010 methodology, export is recorded on free-on-board (FOB) basis, and import are recorded on cost, insurance, and freight (CIF) basis. Reported by current price.
Table 1.8 shows Myanmar’s export and import volumes from 1980-2017. This result in higher costs and lowers trade competitiveness for Myanmar’s products generate that Myanmar’s export are relatively low price primary products and import are high-price manufactured products. To have more favorable terms of trade, the government needs to encourage export processing and manufacturing industries or export promotion. Another weak point for exporters is that they are unsure of being able to get their goods into stable markets in Western countries due to the severe economic sanctions of the US and EU since 2003.
Basically, Myanmar’s main export products are primary goods such as rice, pulse and beans;
forest product like teak; and natural gas (since the 1990s). Garment export expanded significantly in 1999-2000 as well as natural gas export from offshore fields. Natural gas and
24
garments together contribute over 40% of Myanmar’s export earnings. Garment export have high import contents such as textiles, cloth, yarn and machinery. The main products exported in 2014-15 were gas, garments, base metals and ores. The main products imported were non- electric machinery, transport equipment, refined mineral oil and base metals. Myanmar’s main manufactured product export are natural gas and textiles. Its largest mineral export is jade and is one of the world’s largest producers of high quality, sought after jadeite. (see Fig 1.2 and 1.3). In 1990, the government imposed many restrictions on trade by controlling foreign exchange, called the “export first and import second” policy. This policy prompted traders to adjust misreporting of trade in accordance with the supply and demand for export earnings.
Considering that a multilateral trading system can bring a wide range of opportunities for Myanmar's export and overcome its supply-side constraints, Myanmar's trading policy was based on ASEAN. The Democratic government adopted an export promotion free trade policy and invited foreign direct investment to promote the trade sector. Trade volumes in Myanmar have soared over the past decades.
Figure 1.2 Myanmar Export (1980-2017)
Source: IMF, World Economic Outlook Database (2011, Sept) and (2018, April)
0.00 2000.00 4000.00 6000.00 8000.00 10000.00 12000.00 14000.00
Export Volume (indices) and Value (US $mils)
Year Myanmar Exports (1980-2017)
Export Volume Export Value
25 Figure 1.3 Myanmar Import (1980-2017)
Source: IMF, World Economic Outlook Database (2011, Sept) and (2018, April) Figure 1.4 Export Value, Import Value and Trade Balance (2000-2017)
Source: IMF, World Economic Outlook Database (2018, April)
The European Commission (EC) (The Report: Myanmar 2017) reported the Myanmar’s total trade rose by 32.8%, 28.1% and 24.5 % in 2010, 2011 and 2012, respectively. Trade continued recording double-digit growth in 2013-14. Import growth drove growing trade volumes, as well as an expanding trade deficit, and the EC reported that import to Myanmar rose significantly during that period. Manufactured product export increased in export share
0.00 5000.00 10000.00 15000.00 20000.00
1980 1982 1984 1986 1988 1990 1992 1994 1996 1998 2000 2002 2004 2006 2008 2010 2012 2014 2016
Import Volume (indices) and Value (US$ mils)
Year Myanmar Imports (1980-2017)
Import Volume Import Value
-10,000 -5,000 0 5,000 10,000 15,000 20,000
Export, Import Value (US$ mils)
Year Export, Import Value and Trade Balance (2000-2017)
Export value Import value Trade Balance
26
to roughly 50% of total export volume. Agricultural export was the second largest category in 2013-14, and mineral products decreased sharply in 2015-16 (Figure 1.4).
Myanmar’s main trade partners are Asian countries, with China and Thailand being the most important export destinations. The EU has had sanctions in place since the 1990s. Japan did not follow the EU sanctions but limited the amount of assistance provided to Myanmar.
US and EU sanctions strongly impacted and inhibited the economy and held back certain trade, investment and business activities. After heavy trade restrictions were lifted in 2016, the business environment was set for dramatic improvement. (Figure 1.5).
Figure 1.5 Myanmar’s Main Trade Partner (2017 - 2018 January) US$ in millions
Source: Myanmar Customs
China
Thailand Singapore
Japan India
Malaysia
IndonesiaKorea USA Vietnam Myanmar's Main Trade Partner Countries
( 2017-2018 January)