EVALUATION OF F-OSR EXPOSED TO SPACE ON SM/SEED EXPERIMENT Eiji MIYAZAKI, Junichiro ISHIZAWA and Hiroyuki SHIMAMURA
Institute of Aerospace Technology, Japan Aerospace Exploration Agency, Tsukuba, Ibaraki 305-8505, Japan
A Flexible Optical Solar Reflector (F-OSR) is a thermal control film for spacecraft. It provides low solar absorptance (Ds) and high infrared emittance (H) with flexibility. The F-OSR, which has a conductive layer and a mirror layer coated onto a polyetherimide base film, is a thermal control film material for spacecraft. Results indicate a mass increase: atomic oxygen does not erode F-OSR in low earth orbit. Thermo-optical properties show no marked change. In fact, F-OSR is verified as retaining its initial properties after exposure on ISS orbit for 46 months. Transmission electron microscopy (TEM) observation of cross-sections, including those of the exposed surface, showed that a new layer had formed over the flight sample. Qualitative analysis of the new layer indicates that the layer mainly comprises silicon and oxygen. The layer is chemically produced by deposited silicon contamination and atomic oxygen, which would be SiO2. This experiment also provides actual quantitative contamination data on ISS, contributing to improvement of contamination control on ISS in the future.
Keywords: optical solar reflector, polyetherimide
1. Introduction
This report presents results of the Flexible Optical Solar Reflector (F-OSR) installed on SM/MPAC&SEED. The F-OSR is a thermal control film used for spacecraft. It has low solar absorptance (Ds) and high infrared emittance (H) with flexibility.
The F-OSR is a five-layered and second-mirrored film with a polyetherimide (PEI) base film. It has a UV protection layer to protect the base film from UV degradation. The SM/SEED experiment can reveal whether the function of F-OSR can be maintained for a year-long-order period on orbit. For evaluation, the retrieved F-OSR samples were measured to determine their changes of mass and thermo-optical properties. Topographic analyses and qualitative analyses were also performed. Herein, we present results of those evaluations for F-OSR and discuss the influence of the space environment of the ISS orbit on the F-OSR for up to 46 months.
2. Sample preparation
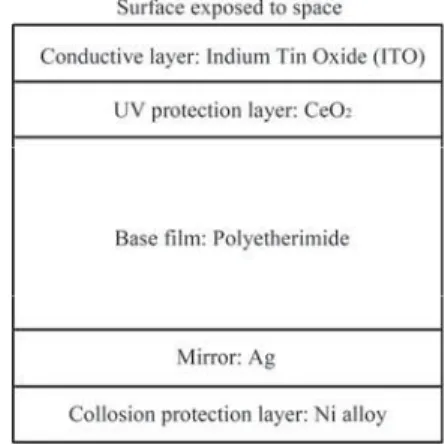
Actually, F-OSR, manufactured by Sumitomo Bakelite Co., Ltd., is a film with multilayered coatings for thermal control of spacecraft. As illustrated schematically in Fig. 1, F-OSR has five layers: a conductive layer, an ultraviolet ray (UV) protection layer, a base film polyetherimide (PEI), a mirror layer, and a corrosion protection layer. The maximum usage temperature of F-OSR is 150°C. The base film, polyetherimide, is UV degradable; for that reason, CeO2, which is known to be UV-absorbent, is deposited. Silver is used as a second surface mirror; the layer is covered completely by Ni alloy to prevent corrosion.
With such features, F-OSR achieves low solar absorptance (DS) and high infrared emittance (H) with good flexibility. The F-OSRs for SM/MPAC&SEED, with 100 μm-thick base film, were cut into 25-mm-diameter circles, subsequently mounted on the sample holder with a frame opening a 20-mm-diameter window for exposure. Table 1 shows mass and thermo-optical properties of F-OSR provided for the SM/MPAC&SEED experiment. Two samples (A and B) were
mounted on each set (#1 – #3): six samples (#1-A – #3-B) were put on the ISS.
3. Evaluation
For mass measurement, we used a microbalance (readability 1 μg, maximum load 5,100 mg, MX5; Mettler Toledo International Inc.). Solar absorptance (Ds) was measured using a JAXA custom-ordered spectrophotometer (Jasco Inc.).
The value of Ds is calculated by measured spectral reflectivity of a sample of 250–2500 nm and solar spectral irradiance.[1] The spectrum itself is also used for evaluation. Normal infrared emittance (HN) was measured using a total-emittance reflectometer (DB-100; Gier Dunkle Instruments Inc.).
Table 1 Initial properties of F-OSR provided for the SM/MPAC&SEED experiment
Mass (mg) Ds HN
48.5 0.156 0.812 Fig. 1 Cross-sectional illustration of F-OSR.
The cross-sectional microstructure was observed using transmission electron microscopy (TEM). The samples stained using RuO4 were sliced using ultramicrotomy to produce a cross-section including the exposed surface. Then TEM observation was performed at the acceleration voltage of 100 kV and magnification of uҏ200,000 to obtain microstructural information. Scanning TEM and Energy Dispersion X-ray Analysis (STEM-EDX) was conducted as qualitative analyses of small areas (ca. 1 nm diameter) in regions of interest identified in cross sectional images.
4. Results and discussion 4.1 Mass
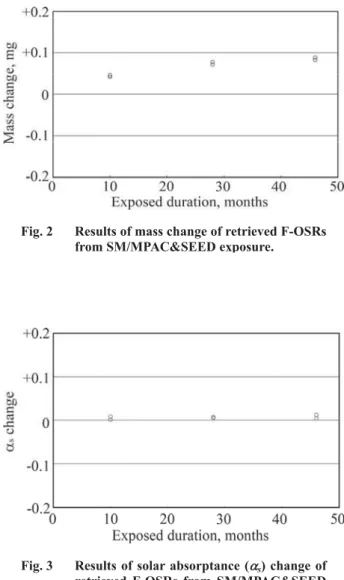
Mass changes of exposed samples are depicted in Fig. 2, which shows the relationship between exposed duration and actual mass change. The results indicated a slight mass increase of less than 0.1 mg for all retrieved samples with 48.5 mg initial mass. In addition, the mass change shows a tendency of increase concomitant with the exposure duration, i.e., 0.04 mg gain for 10 months’ exposure, 0.07 mg gain for 28 months, and 0.09 mg gain for 46 months. In general, the AO-attacked polymer material is eroded, resulting in mass loss. For instance, the third retrieved AO monitor polyimide sample “Vespel” lost 4.087 mg during exposure.[2] The F-OSR data suggest that erosion does not occur, i.e., it is verified that F-OSR has sufficient AO tolerance for almost 4 years on ISS orbit. On the other hand, such a mass increase suggests absorption or deposition of some substances during exposure. That point is discussed later using results of cross-sectional analysis.
4.2 Thermo-optical properties and spectral analysis
Changes of thermo-optical properties of the exposed samples during exposure are depicted in Figs. 3 and 4. No significant change of thermo-optical properties was observed, i.e., Ds increased 0.01 from the initial value of 0.156 for 46 months’ exposure, which is almost within the uncertainty of the measuring device. For HN, less than 0.005 changes were observed from the initial value of 0.812 for 46 months on orbit, which is also included in the uncertainty of the equipment.
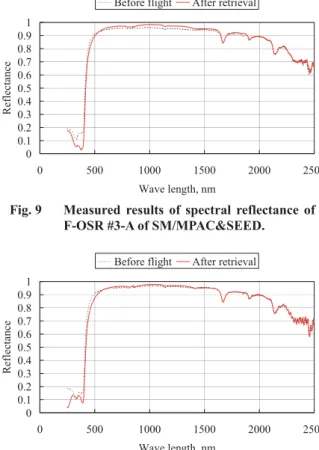
Figures 5–10 portray reflectance spectra obtained for Ds
measurement. In the UV region shorter than 400 nm, a change of reflectance by exposure is visible. However, the change depends on the sample, not the exposure duration. It might result from measurement error. No marked change was observed in other wavelength regions. Such a small change suggests that F-OSR has UV and radiation tolerance. Lack of UV protection might induce a color change of the base film, thereby changing Ds.
On the other hand, some reports have described recovery:
the degraded optical properties that have changed because of the space environment exposure are subsequently recovered by exposure to air.[3–4] In the present mission, it can not be confirmed that recovery occurred. Because of the retrieval procedure, air exposure before ground measurement is unavoidable. Compared to other SEED samples of the F-OSR, several samples show visible changes of the exposed surface.
Although they might have recovered, such visible changes persist even after extended exposure to air on the ground. These
results suggest that F-OSR can retain its beginning of life (BOL) thermo-optical properties for 46 months on ISS orbit.
Fig. 4 Results of Normal Infrared Emittance (HN) change of retrieved F-OSRs from SM/MPAC&SEED exposure.
Fig. 3 Results of solar absorptance (Ds) change of retrieved F-OSRs from SM/MPAC&SEED exposure.exposure.
Fig. 2 Results of mass change of retrieved F-OSRs from SM/MPAC&SEED exposure.
4.3 Cross-sectional analysis of exposed surface
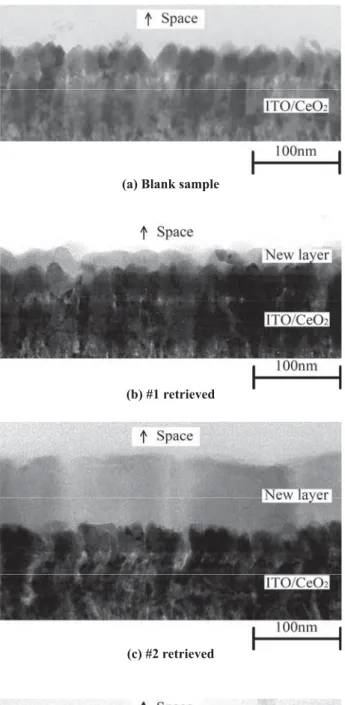
Cross-sectional TEM images of the near exposed surface are presented in Fig. 11. In those figures, the dark area appears in the lower is ITO/CeO2 layer; a bright area appearing in the upper half is a mount material for TEM observation, which is not a part of F-OSR. These areas are visible in both blank sample and retrieved samples. A gray area is apparent between the dark area and the bright area only in images of retrieved samples. The gray area would be a new layer built during exposure and covering the flight samples. For the #1 sample presented in Fig. 11b, the new layer thickness can be estimated as ca. 20 nm. No marked change was observed on the original surface, i.e., the border between the new layer and ITO/CeO2 layer, compared with the blank sample surface. The surface shape of the new layer, the border between the gray area and the bright area, is found to trace that of the original F-OSR’s ITO/CeO2 layer’s surface. A cross section image of #2 sample is presented in Fig. 11c: the new layer thickness is ca. 80 nm. The original surface retains its original shape. The shape of the new layer surface does not trace finely but smoothly. Figure 11d portrays the cross section of the
#3 sample: the thickness is ca. 120 nm; the new layer surface is smooth; and the original surface shows no obvious difference from its initial shape.
In general, the AO-attacked surface shows a distinctive shape with micrometer-sized asperity, a so-called carpet shape or needle-like shape. The F-OSR indicated neither apparent mass loss nor an AO-attacked shape at the original surface observed at
Fig. 10 Measured results of spectral reflectance of F-OSR #3-B of SM/MPAC&SEED.
0 0.1 0.2 0.3 0.4 0.5 0.6 0.7 0.8 0.9 1
0 500 1000 1500 2000 2500
Wave length, nm
Reflectance
Before flight After retrieval
Fig. 9 Measured results of spectral reflectance of F-OSR #3-A of SM/MPAC&SEED.
0 0.1 0.2 0.3 0.4 0.5 0.6 0.7 0.8 0.9 1
0 500 1000 1500 2000 2500
Wave length, nm
Reflectance
Before flight After retrieval
Fig. 8 Measured results of spectral reflectance of F-OSR #2-B of SM/MPAC&SEED.
0 0.1 0.2 0.3 0.4 0.5 0.6 0.7 0.8 0.9 1
0 500 1000 1500 2000 2500
Wave length, nm
Reflectance
Before flight After retrieval
Fig. 7 Measured results of spectral reflectance of F-OSR #2-A of SM/MPAC&SEED.
0 0.1 0.2 0.3 0.4 0.5 0.6 0.7 0.8 0.9 1
0 500 1000 1500 2000 2500
Wave length, nm
Reflectance
Before flight After retrieval
Fig. 6 Measured results of spectral reflectance of F-OSR #1-B of SM/MPAC&SEED.
0 0.1 0.2 0.3 0.4 0.5 0.6 0.7 0.8 0.9 1
0 500 1000 1500 2000 2500
Wave length, nm
Reflectance
Before flight After retrieval
Fig. 5 Measured results of spectral reflectance of F-OSR #1-A of SM/MPAC&SEED.
0 0.1 0.2 0.3 0.4 0.5 0.6 0.7 0.8 0.9 1
0 500 1000 1500 2000 2500
Wave length, nm
Reflectance
Before flight After retrieval
a magnification of nanometer nanometer-scale resolution. From the view, F-OSR might have tolerance against AO attack on the ISS orbit. Although the possibility exists that the new layer plays a role in protecting the surface from AO attack, such protection was not observed in the results for other retrieved polyimide films installed on the SM/MPAC&SEED unit, which were damaged by AO.[5] Results confirm that the tolerance of F-OSR itself against AO attack is sufficient.
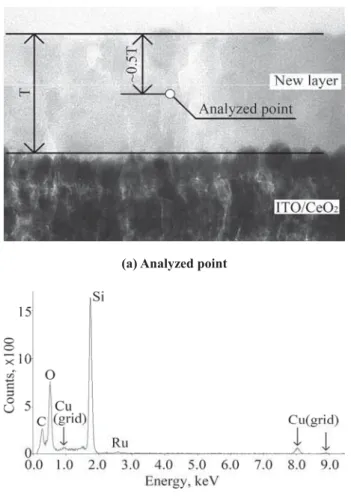
Then, to examine the new layer, we performed STEM-EDX analysis in terms of investigating the layer qualitatively. For that analysis, the electron beam was focused around the center of the new layer in the depth direction, as presented in Fig. 12. The result shows detection of carbon, silicon, and oxygen, which are commonly observed in retrieved F-OSRs. The #3-A spectrum is shown as representative in Fig.
12. First, it could not be determined whether the detected carbon was derived from the exposure on orbit. Carbon was also detected in the ITO/CeO2 layer, although the layer that was produced by deposition during manufacturing is not expected to contain carbon. Secondly, silicon and oxygen detected on the new layer are discussed. Because F-OSR contains no silicon, the silicon must originate from sources other than F-OSR, e.g., paints for thermal control, or adhesives used for solar arrays, containing silicon. Outgassed silicon from such sources would deposit on the other components on ISS including SM/MPAC&SEED. Silicon deposition is a known phenomenon occurring in spacecraft on orbit.[6] In the SM/MPAC&SEED mission, it was also observed and reported previously.[7]
Oxygen originates from existing AO in the ISS orbit. The deposited silicon on the F-OSR surface is oxidized by collision with AO, resulting in silicon dioxide (SiO2) production. The processes of silicon deposition and oxidation would occur continuously on orbit.
Both mass measurements and thickness measurements of the new layer discovered by cross-sectional observation using TEM revealed mutual agreement, suggesting that the mass increase occurs because of new layer deposition. Figure 13 portrays the relationship between the measured mass increase per unit area and the exposure duration: the deposition is expected to become saturated as the exposure duration lengthens.
This result suggests that such saturation might result from the outgassing rate behavior of the contaminant source.[8] The contamination deposition rate is calculable from the present result. Average rates are: 1.7u10-5 g/cm2/year for #1, 1.0u10-5 g/cm2/year for #2, and 7.1u10-6 g/cm2/year for #3. Those are higher than the required value: less than 1.0u10-6 g/cm2/year at a 300 K surface for molecular deposition.[9–10] Obtaining actually measured data will contribute to improvement of contamination control for ISS and other spacecraft in the future.
5. Conclusion
The F-OSR was exposed to the space environment as one SEED sample of the SM/MPAC&SEED mission carried out on ISS for 46 months from October 2001. The retrieved samples were investigated for their mass change and thermo-optical properties. Cross-sectional TEM observation and STEM-EDX analysis were also performed.
A slight mass gain of less than 0.1 mg was observed for all
(b) #1 retrieved (a) Blank sample
(c) #2 retrieved
(d) #3 retrieved
Fig. 11 Cross-sectional TEM images of F-OSRs for SM/MPAC&SEED.
retrieved samples, showing that F-OSR has tolerance against AO, i.e., erosion does not occur. The thermo-optical properties retained their initial values, although these results might also reflect recovery by exposure to air. Nevertheless, BOL thermo-optical properties of F-OSR were retained for 46 months in ISS orbit. Cross-sectional TEM observation revealed that a
new layer, which does not exist on the blank sample, was built up on the exposed surface of F-OSR. The new layer thickness increased concomitantly with the exposure duration. A STEM-EDX analysis reveals that the new layer consists mainly of Si and O, which suggests that the new layer is silicon dioxide produced chemically from silicon contamination and AO.
This experiment verified F-OSR tolerance against space environments around the ISS for almost 4 years. It also provides actual contamination environmental data on ISS quantitatively, contributing to improvement of contamination control for ISS and other spacecraft in the future.
References
[1] ASTM E490, “Standard Solar Constant and Zero Air Mass Solar Spectral Irradiance Tables,” ASTM International.
[2] Y. Kimoto, I. Yamagata, J. Ishizawa, E. Miyazaki, N.
Baba, and M. Kato, “Japanese Space Materials Exposure Experiment Utilizing International Space Station,”
Proceedings of 57th International Astronautical Congress, International Astronautical Federation (2006).
[3] H. S. Choate, S. W. Johnson, and V. L. Mongold,
“Analysis of Products Evolved from Selected Thermal Control Coating Materials during Ultraviolet Radiation in Vacuum,” AIAA Paper, 69-640 (1969).
[4] M. Iwata, F. Imai, K. Imagawa, N. Morishita, and T.
Kamiya, “Fundamental Research to Establish Ground-Test Methodology of Thermal Control Film,”
AIAA Paper, 2003-3908 (2003).
[5] J. Ishizawa, I. Yamagata, Y. Kimoto, N. Baba, E.
Miyazaki, K. Mori, H. Shimamura, F. Imai, and M.
Suzuki, “Evaluation and Analysis of the Second Retrieved Space Environment Exposure Device (SM/MPAC&SEED),” Proceedings of The 25th International Symposium on Space Technology and Science, ISTS 2006-r-2-28, Kanazawa, Japan (2006).
[6] A. S. Levine, (ed.), “LDEF – 69 Months in Space, First Post-Retrieval Symposium,” NASA CP-3134 (1991).
[7] N. Baba, M. Suzuki, I. Yamagata, Y. Kimoto, and J.
Ishizawa, “External Contamination Observed on the Micro-Particles Capturer and Space Environment Exposure Device,” Proc. 10th ISMSE, ESA-SP-616 (2006).
[8] D. H. Holkeboer, D. W. Jones, F. Pagano, and D. J.
Santeler, “Vacuum Technology and Space Simulation,”
NASA SP-105, pp. 197-222 (1966).
[9] NASA, ”Space Station External Contamination Control Requirements,” NASA SSP-30426, Rev. D (1994) [10] C. Soares, R. Mikatarian, D. Schmidl, C. Pankop, and K.
Smith, “External Contamination Environment of International Space Station Externally Mounted Payloads,” Proceedings of 56th International Astronautical Congress, International Astronautical Federation (2005).
Fig. 13 Relationship between the measured mass increase per unit area and the exposure duration for F-OSR of SM/MPAC&SEED.
Fig. 12 Results of XPS analysis of F-OSR of SM/MPAC&SEED.
(b) XPS spectrum obtained from #3-A (a) Analyzed point
Publication list related SM/MPAC&SEED
E. Miyazaki and I. Yamagata: Results of the Space Environment Exposure Experiment “SM/MPAC&SEED” on the International Space Station: Flexible Optical Solar Reflector, Proc. 10th ISMSE, ESA-SP-616 (2006).
E. Miyazaki and I. Yamagata: Results of Space-Environment Exposure of the Flexible Optical Solar Reflector, Journal of Spacecraft and Rockets (to be published).