167
Article ©2009 The Society of Rheology, Japan
1. INTRODUCTION
Water soluble polysaccharides have been widely used as the texture modifier for foods. Recently, it has been focused in a new functional food for dysphagia. The most serious symptom of dysphagia is known as an aspiration pneumonia. Aspiration pneumonia is a fatal disease for the elderly. Therefore, to avoid such accident, scientists in the food industry field struggle to develop a new type food containing a suitable texture modifier. Such a texture modified food is called toromi in Japan. Recently some kind of starch has been applied for such functional foods. However, there are some problems for using starch due to its poor anti-enzyme property and therefore, new ingredients are required.
Succinoglycan is a bacterial polysaccharide made by the Agrobacterium family. The polysaccharide was isolated in 60’s.
1)Fig. 1 shows the chemical structure of the polysaccharide.
The polysaccharide has the repeating unit containing 4 sugars and the side chain containing also 4 sugars.
2-4)The
most distinguished feature of the polysaccharide is its high viscosity in the aqueous solution. Moreover, the viscosity of the solution maintains in the high ionic strength condition or acidic condition. Therefore, the polysaccharide was applied as a thickener for the oil recovery in the oil field at first.
5)It is well known that the viscosity of the succinoglycan aqueous solution drops at around 65 °C.
5)The phenomenon is believed to be induced by a conformational change. Strenuous studies on the solution properties of the polysaccharide were
Consistency Change of Succinoglycan Aqueous Sodium Chloride Solution during Cooling Process
Isamu K aneda
*and Yuji O nOdera Department of Food Science, Faculty of Dairy Science
Rakuno Gakuen University Ebetsu, Hokkaido 069-8501 Japan
(Received : November 25, 2008)
The rheological properties of succinoglycan aqueous sodium chloride solution were investigated at the various temperatures ranging from 30 to 75 °C. The dynamic modulus of the sample solutions abruptly increased at around 65 °C during the cooling process. The critical temperature (T
c) at which the consistency changed sharply depended on the sodium chloride concentration, namely, T
cincreased with the salt concentration. Succinoglycan takes a conformation of a semi-flexible single strand chain at above T
c. The spatial size of the polysaccharide at high temperature decreased with the salt concentration since the polysaccharide is a polyelectrolyte. The aqueous solution of the polysaccharide became a structured fluid after the cooling process. To make a quantitative characterization of the mechanical property of the structure fluid, the creep curve analysis was employed. The mechanical properties of the structured fluid can be quantitatively described by using 4- elements mechanical model. Moreover, the effect of the salt on the mechanical properties also emerged. Although the consistency of the sample at above T
cdecreased with the salt concentration, it increased with the salt concentration after cooling below T
c. The result revealed that the consistency of the heat denatured succinoglycan aqueous solution was strongly affected with the salt concentration in the system.
Key Words: Succinoglycan / Polysaccharide / Rheology / Creep / Structured fluid
* To whom correspondence
Tel/Fax: +81-11-388-4701, E-mail: [email protected]
Fig.1
Fig.2
O CH2COOCH3 HH
H OH
OH HH
CH2OHO HH
H OH
OH HH
CH2OHO HH OHH OH
HH CH2OO HH
H OH
OH H H
n CH2OHO
HH OHH OH
H H
O CH2O HH H H OH
OH H
H CH2OO
H OH
H OH
OH HH
CH2OO HH OH
H OH HH
O O
O O COCH2CH2COOH
O C
H3C COOH
O
300 310 320 330 340 350
10
010
110
2G '(T ), G "( T) [P a]
T [K]
Fig. 1. The chemical structure of succinoglycan.
168
Nihon Reoroji Gakkaishi Vol.37 2009
reported in the last 2 decades. These studies confirm that the abrupt viscosity change is due to the helix-coil transition by the optical, calorimetric, and rheological technique.
6-9)It is reported that the sonicated polysaccharide has double helical structure
10-12)and also the double helical structure is re-constructed after melting at high temperature when it cools again.
13)The re-construction manner is quite different according to its polymer concentration. If the polymer concentration is below the overlapped concentration (c*) of the polysaccharide, the viscosity of the heat-denature sample reduces below the initial value. On the other hand, if the polymer concentration is above the c*, the solution become thicker than the initial state. The phenomenon means the double helical structure may make somewhat large structures after heat-cooling procedure.
The high concentration aqueous solution of succinoglycan treated heat-cool procedure shows interesting mechanical properties like a weak-gel. We call such a weak-gel like matter as “structured fluid” in this paper. It is quite important to estimate mechanical properties of structured fluids, if we apply such materials for food as a texture modifier. The influence of the ionic strength on the mechanical properties as a result of the physical interaction is also an interesting problem. Since such a problem is strongly related to industrial application of the polysaccharide, it is quite valuable to investigate the salt effect on the rheological properties of the polysaccharide aqueous solution.
In this study, we investigated the salt effect on the consistency change behavior of an industrial grade succinoglycan as a fundamental study for the application of the polysaccharide. In particular, we attempted to precisely and quantitatively estimate the mechanical properties of succinoglycan sodium chloride aqueous solution as structured fluid by using creep curve analysis.
2. MATERIALS AND METHODS
2.1 Materials
Succinoglycan was purchased from Rhodia (Paris, France). The sample was of industrial grade (Rheozan
©). The polysaccharide was used as received without further purification.
The molecular weight of Rheozan is around 6 × 10
6g / mol (estimated by gel permeation chromatography).
14)The sample solution was prepared as follows. The polysaccharide was dispersed in distilled water for 2 hrs mixing with a three-one motor mixer followed by further mixing with a high speed mixer (10000 rpm, 30 min.). The sample solution was ice cooled during the procedure to avoid heat denaturation of the polysaccharide. The sample was swollen at 4 °C for 12 hrs
before the experiments. The polysaccharide concentration was 1 wt% for the entire measurement. Sodium chloride (NaCl) was used as a salt in this study. The sample solution containing salt was prepared using aqueous NaCl (0.05, and 0.1 mol / L) as solvent. Sodium chloride was purchased from Wako Pure Chemical Industries, Ltd (Osaka, Japan).
2.2 Rheology Measurement
A stress control rotation rheometer, CSL 100 (TA Instrument;
U.K.) was employed in this study. The fixture used for the measurement was a cone-plate type (40 mm diameter, 2°).
To avoid evaporation of the solvent, a solvent trap was used.
The temperature of the sample was controlled by a Peltier temperature controller equipped to the rheometer.
3. RESULTS AND DISCUSSION
3.1 Consistency Change of Succinoglycan During the Cooling Process
The dynamic modulus was monitored during the cooling process for the samples. At first, a sample was applied to the heated plate (75 C) of the rheometer, and the temperature was maintained for 20 min. The monitoring of the dynamic modulus ( w = 6.28 rads
-1, g = 10 %) was conducted during the cooling process. The cooling rate was 0.1 °C / min. Since the sample was heated to a high temperature, the solvent trap was used to avoid evaporation of solvent. Fig. 2 shows the temperature dependency of the dynamic modulus for 1 wt% succinoglycan aqueous solution. The storage modulus abruptly increased at around 63 °C and the storage modulus and loss modulus showed a crossover at around 62 °C. The result revealed the polysaccharide made a gel-like structure
2 Fig.1
Fig.2
CH2COOCHO 3 HH
H OH
OH HH
CH2OHO HH
H OH
OH HH
CH2OHO HH OH
H OH HH
O CH2O H H
H OH
OH HH
n O CH2OH H H OH
H OH H
H
O CH2O HH H H OH
OH H
H CH2OO
H OH
H OH
OH HH
CH2OO HH OH
H OH HH
O O
O O COCH2CH2COOH
O C H3C COOH
O
300 310 320 330 340 350
100 101 102
G '(T ), G "( T) [P a]
T [K]
Fig. 2. The dynamic modulus during the cooling process for 1 wt%
succinoglycan aqueous solution. The open and closed circles
denote the storage modulus and loss modulus, respectively. The
dynamic modulus was monitored at 6.28 rads
-1and the shear
strain was 10 %. The cooling rate was 0.1 K / min.
169 KANEDA • ONODERA : Consistency Change of Succinoglycan Aqueous Sodium Chloride Solution during Cooling Process
when cooling below a critical temperature. Although no data is shown, the process was reversible, namely, the structure induced by cooling treatment would be formed with physical interactions. The salt effect on the storage modulus change for the samples is shown in Fig. 3. The transition temperature shifted to the higher temperature with increase of the salt concentration. Furthermore, the sharpness of transition also increases with the salt concentration. To precisely estimate the transition temperature (T
c), loss tangent (tand) was employed for the purpose. The value is defined as follows;.
'
"
tan G G G (1)
0
0
1 exp
K O
t J t
J t
J
e¸¸ ¹
¨¨ ·
©
§ ¸
¹
¨ ·
© §
(7)
C NaCl [M] J 0 [Pa -1 ] J e [Pa -1 ] O [s] K 0 [Pas]
0 0.0388 0.0322 33.4 8160
0.05 0.0311 0.0239 32.1 11500
0.1 0.0307 0.0235 35.2 13600
1 (1)
where G' and G" denote the storage modulus and loss modulus.
We define T
cas the temperature at which tand becomes one.
T
cwas estimated from the plot of the temperature dependency of the loss tangent for the entire sample (Fig. 4). The salt concentration dependency of T
cis shown in Fig. 5. T
cof the sample solution containing 0.1 mol/L NaCl was about 5 °C higher than that in distilled water. It means that NaCl would affect the structure formation.
The dynamic viscosity (h') and tand values at 70 °C are shown in Fig. 6. The decrease in viscosity means the decrease in spatial size of the semi-flexible chain by adding salt, namely the polysaccharide was shrinking due to screening of electro static repulsion and dehydration. The finite value of tand shows that the solution is a viscoelastic matter. The tand value increased with the salt concentration. It means that the elastic property of the sample relatively decreased with the salt concentration. The consistency of the polysaccharide aqueous solution decreased with the salt concentration at above T
c.
Fig.3
Fig.4
300 310 320 330 340 350
10-1 100 101 102 103
G '(T ) [ P a]
T [K]
300 310 320 330 340 350
0.0 0.5 1.0 1.5 2.0 2.5 3.0
ta n G
T [K]
Fig. 3. The storage modulus during the cooling process for 1 wt%
succinoglycan aqueous solution containing sodium chloride with various concentrations ranging from 0 to 0.1 mol / L. The closed symbols denote the salt free sample in distilled water. The circles, triangles, and squares denote 0.01, 0.05, and 0.1 mol / L aqueous sodium chloride, respectively.
3 Fig.3
Fig.4
300 310 320 330 340 350
10-1 100 101 102
G '(T ) [ P a]
T [K]
300 310 320 330 340 350
0.0 0.5 1.0 1.5 2.0 2.5 3.0
ta n G
T [K]
Fig. 4. The loss tangent during the cooling process for 1 wt%
succinoglycan aqueous solution containing sodium chloride with various concentrations ranging from 0 to 0.1 mol / L. The closed symbols denote the salt free sample in distilled water. The circles, triangles, and squares denote 0.01, 0.05, and 0.1 mol / L aqueous sodium chloride, respectively.
4 Fig.5
Fig.6
0.00 0.05 0.10
334 335 336 337 338 339 340
T
gel[K ]
C
NaCl[mol / L]
0.00 0.05 0.10
0.1 0.2 0.3 0.4
&1D&O>PRO/@
K
' [ P as ]
1.0 1.5 2.0 2.5 3.0
ta n
G0.00 0.05 0.10
0.1 0.2 0.3 0.4
&1D&O>PRO/@
K
' [ P as ]
1.0 1.5 2.0 2.5 3.0
ta n
GFig. 5. The salt concentration dependency of the critical temperature (T
c) for 1 wt% succinoglycan aqueous solution containing sodium chloride with various concentrations ranging from 0 to 0.1 mol / L.
4 Fig.5
Fig.6
0.00 0.05 0.10
334 335 336 337 338 339 340
T
gel[K ]
C
NaCl[mol / L]
0.00 0.05 0.10
0.1 0.2 0.3 0.4
&1D&O>PRO/@
K ' [ P as ]
1.0 1.5 2.0 2.5 3.0
ta n G
0.00 0.05 0.10
0.1 0.2 0.3 0.4
&1D&O>PRO/@
K ' [ P as ]
1.0 1.5 2.0 2.5 3.0
ta n G
Fig. 6. The salt concentration dependency of the consistency for 1 wt%
succinoglycan aqueous solution containing sodium chloride with various concentrations ranging from 0 to 0.1 mol / L at 70 °C.
The open and closed circles denote h' and tand, respectively.
170
Nihon Reoroji Gakkaishi Vol.37 2009
3.2 Rheological Properties of the Structured Fluid The mechanical spectrum was measured for the structured fluid. Figs 7 A and B show the result in distilled water and 0.1 mol / L aqueous NaCl, respectively. Both samples showed a so called weak-gel like behavior, namely, G' and G" were having the weak frequency dependency.
15)As mentioned above, we call such a matter as structured fluid. Such a feature means that there is not any characteristic length or time in the measurement time scale. In another word, it is quite difficult to precisely estimate the characteristics of the structured fluid from the data of the dynamic measurement. For example, the storage modulus at 10 rads
-1in Fig. 7A and B are about 620 Pa and 600 Pa respectively. It is quite a subtle difference.
Moreover, we can see that the frequency dependency of the dynamic modulus of both figures is different each other. Such a difference may relate to somewhat long time relaxation of the samples and it is closely related to the texture of foods containing the polysaccharide. Creep measurement can be employed for the characterization of such materials.
16)When the time constant of the relaxation is obtained, it is possible to consider the relation between the time constant and the texture. For the creep measurement, the applied shear stress was ranging from 3 to 4 Pa depending to the strength of the
sample. To estimate the mechanical characteristics of the samples, a 4 elements mechanical model consisting of one Maxwell type model and one Voigt type model connected in series was employed for the analysis of the creep curves. The creep compliance is written as follows;
'
"
tan G
G G (1)
0
0
1 exp
K O
t J t
J t
J
e¸¸ ¹
¨¨ ·
©
§ ¸
¹
¨ ·
© §
(7)
C NaCl [M] J 0 [Pa -1 ] J e [Pa -1 ] O [s] K 0 [Pas]
0 0.0388 0.0322 33.4 8160
0.05 0.0311 0.0239 32.1 11500
0.1 0.0307 0.0235 35.2 13600
1 (2)
where J (t) is the creep compliance measured from the experiment, J
0is the instantaneous compliance, J
eis equilibrium compliance for the Voigt element in the model, l is the retardation time, and h
0is the zero-shear viscosity.
Fig. 8 shows the results of the creep measurement and analysis. The open circles and lines denote the experimental results and calculated value using the model, respectively.
The fitting the measured values to the model was good. The calculated characteristics for the samples are listed in the table. The retardation time (relaxation time) was in some 10 seconds in its order. Such value must not be related to the relaxation of entanglement of polymer chains. It is considered that such a time constant related to the motion of colloid sized structure.
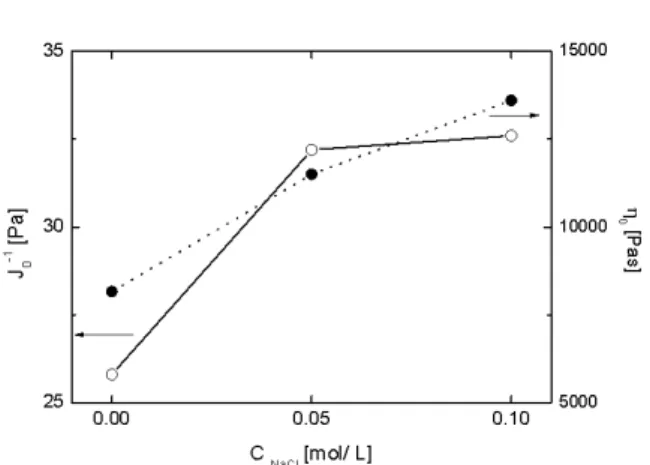
17)Moreover, the system finally showed steady flow after the retardation response. From these results, it is expected that the sample, a structured fluid, is considered as a condensed soft colloidal system. Fig. 9 shows that the salt concentration dependency of J
0-1
and h
0. The consistency of the sample (J
0-1
and h
0) increased with the salt concentration.
The result is contrary to the result of the high temperature measurement mentioned above. Although the retardation times for the samples were almost similar each other, the J
evalues were different in each salt concentration. These results mean that the structures in the structured fluid may change with the salt concentration, if there are soft colloidal particles in the sample. The zero shear viscosity must be related to the friction between the particles. As h
0increased with the salt concentration, it is considered that the state of the surface of the particles also changed by adding the salt.
Table I. The mechanical characteristics estimated the 4 elements model for succinoglycan 1 wt% aqueous solution containing sodium chloride with various concentrations ranging from 0 to 0.1 mol / L at 30 °C.
J
0, J
e, l, and h
0are the instantaneous compliance, equilibrium compliance, retardation time, and zero-shear viscosity, respectively.
'
"
tan G
G G (1)
0
J 1 exp O t K t
0J t
J
e¸¸
¹
¨¨ ·
©
§ ¸
¹
¨ ·
© §
(7)
C
NaCl[M] J
0[Pa
-1] J
e[Pa
-1] O [s] K
0[Pas]
0 0.0388 0.0322 33.4 8160
0.05 0.0311 0.0239 32.1 11500
0.1 0.0307 0.0235 35.2 13600
10-1 100 101 102
100 101 102 103
G'(Z),G"(Z) [Pa]
Z [rads-1]
㪘
10-1 100 101 102
100 101 102 103
G'(Z),G"(Z) [Pa]
Z [rads-1]
㪙
Fig.7
0 100 200 300
0.04 0.06 0.08 0.10 0.12
J(t) [Pa-1]
t [s]
㪘
0 100 200 300 400
0.02 0.04 0.06 0.08
J(t) [Pa-1]
t [s]
㪙
Fig.8
5 Fig. 7. The frequency dependency of the dynamic modulus for 1 wt%
succinoglycan aqueous solution (A) and containing 0.1 mol / L sodium chloride (B) at 30 °C. The open and closed symbols denote the storage and loss modulus, respectively.
10-1 100 101 102
100 101 102 103
G'(Z),G"(Z) [Pa]
Z [rads-1]
㪘
10-1 100 101 102
100 101 102 103
G'(Z),G"(Z) [Pa]
Z [rads-1]
㪙
Fig.7
0 100 200 300
0.04 0.06 0.08 0.10 0.12
J(t) [Pa-1]
t [s]
㪘
0 100 200 300 400
0.02 0.04 0.06 0.08
J(t) [Pa-1]
t [s]
㪙
Fig.8
5 Fig. 8. The creep curves for 1 wt% succinoglycan aqueous solution
(A) and containing 0.1 mol / L sodium chloride (B) at 30 °C.
The symbols and lines denote the experimental results and the
estimated value using the 4 elements model, respectively.
171
4. CONCLUSION
In general, a salt affects the molecular volume of the polyelectrolyte due to supplying the counter ion species to the charged moiety of the polymer. Although succinoglycan makes a double helical structure after the heat denature treatment, it is considered that the helical structure is recovered imperfectly. Furthermore, once the polysaccharide shrinks by the adding salt at above T
c, such a conformational change would affect the structure formed during cooling procedure.
The colloid level structures occurring in the structured fluid may change according to the salt concentration in the samples.
In fact, the elastic modulus, J
0-1
in this case, was increased with the salt concentration. Although we used an industrial grade sample of succinoglycan to obtain the information for the actual application, such sample may contain small amount of salt which comes from the fermentation medium in the product process. Therefore, if we want to precisely investigate the salt effects on the characteristics of the polysaccharide, the purification is needed. However, the result of this paper revealed that the effect of sodium chloride on the consistency of the polysaccharide showed salt concentration dependency.
It means that sodium chloride certainly affected the physical properties of the polysaccharide. Further study on the purified succinoglycan is undergoing. The results of the study will appear in forthcoming paper.
Here, we suggest a possible picture of the structure for the structured fluid as follows;
1) The heat-denatured succinoglycan may reconstruct the double helical structure, however the structure never recovered perfectly.
2) It is reported that succinoglycan forms intermolecular association.
18)It is considered that the network structure of the structured fluid was obtained as a result of the association. Although the detail of the association is still unknown, sodium chloride may affect the association forming.
3) The network structure was never spanning in the system.
The condensed soft colloidal system may show an elastic behaviour in short time response. The elasticity of the structured fluid may occur by elastic repulsive effect of the condensed soft colloidal particles.
We may note the validity of the creep measurement for the characterization of a soft matter. A soft matter like the succinoglycan aqueous solution is quite popular in the food science and industry field. It is considered that the most of such a soft matter are a condensed colloid system (emulsion, microgel and so on). On the other hand, if we consider the texture of food, we should precisely make characterization of foods. In particular, the time dependency of the deformation for the sample is quite important. In such a case, creep measurement is quite useful, since the measurement can elucidate rather “slow mode” dynamics related to the displacement or drugging of the colloid sized structures. The authors consider that the systematic studies on structured fluids in the food science field are required for quantitative characterization of the mechanical property of the matter.
The well defined data for “soft food” would be useful for designing the novel type of foods.
Acknowledgement
This work is partially supported by a Grant-in-Aid for Scientific Research on Priority Areas “Soft Matter Physics”
from the Ministry of Education, Culture, Sports, Science and Technology of Japan.
REFERENCES
1) Harada T, Yoshimura T, Hidaka H, and Koreeda, Agric Biol Chem. 29, 757 (1965).
2) Hisamatsu M, Abe J, Amemura A, and Harada T, Agric Biol Chem, 44, 1049 (1980).
3) Chouly C, Colquhun L, Jodelet A, York G, and Walker GC, International Journal of Biological Macromolecules, 17, 357 (1995).
4) Reinhold B, Chan S, Reuber T, Marra A, Walker G, and Reinhold VN, Journal of Bacteriology. 176, 1997 (1994).
5) Clark-Sturman A, denOttelander D, and Sturla PL, ACS, Division of Petroleum Chemistry, Preprints, 33, 25 (1989).
Fig.9
Fig. 9. The salt concentration dependency of the consistency for 1 wt%
succinoglycan aqueous solution containing sodium chloride with various concentrations ranging from 0 to 0.1 mol / L at 30 °C. The open and closed circles denote J
0-1