Fukushima Medical University
福島県立医科大学 学術機関リポジトリ
This document is downloaded at: 2021-11-07T23:24:46Z
Title
Clinical Impact of Insulin Resistance on Pulmonary Vein Isolation Outcome in Patients with Paroxysmal Atrial Fibrillation( 本文 )
Author(s)
肱岡, 奈保子
Citation
Issue Date
2020-03-24
URL
http://ir.fmu.ac.jp/dspace/handle/123456789/1063
Rights
Fulltext: © 2018 Wiley Periodicals, Inc. This is the peer reviewed version of the following article: [J Cardiovasc Electrophysiol. 2019 Apr;30(4):479-486], which has been published in final form at [https://doi.org/10.1111/jce.13827].
This article may be used for non-commercial purposes in accordance with Wiley Terms and Conditions for Use of Self- Archived Versions.
DOI
Text Version
ETD
1
Clinical Impact of Insulin Resistance on Pulmonary Vein Isolation Outcome in Patients with Paroxysmal Atrial Fibrillation
Short title
:Impact of insulin resistance on PVI outcome
Naoko Hijioka, M.D.
Department of Cardiovascular Medicine, Fukushima Medical University
2
Abstract
Introduction: A relationship between insulin resistance and AF recurrence after pulmonary vein
isolation (PVI) remains unclear.
Methods: Drug-refractory 114 paroxysmal AF patients (89 males, 62 ± 8 years) who underwent
successful PVI were enrolled. Homeostasis model assessment (HOMA-IR) was calculated, and a value of
≧2.5 was defined as insulin resistance. Left atrial volume index (LAVI) was measured using echocardiography before and 1 year after PVI. TNF-α and TGF-β1 serum levels were measured prior to PVI, and left atrium (LA) conduction velocity was calculated. The patients were divided into two groups (Group 1: HOMA-IR < 2.5, n = 81; Group 2: HOMA-IR
≧2.5, n = 33).
Results: LAVI between the two groups before PVI did not significantly differ (P > 0.05), nor did
TNF-α (7.7 ± 2.0 vs. 7.5 ± 1.0 pg/mL, P = 0.149) or TGF-β1 (28.4 ± 12.0 vs. 27.6 ± 10.3 ng/mL, P = 0.757). LAVI before and 1 year after PVI in each group did not change. The conduction velocity of Group 2 was slower than that of Group 1 (0.7 ± 0.1 vs. 1.1 ± 0.3 m/s, P < 0.001).
Kaplan-Meier analysis showed significantly higher AF recurrence in Group 2 than in Group 1 (P
= 0.019). Cox multivariable analysis revealed that insulin resistance was an independent predictor of recurrence (hazard ratio 1.287, P = 0.004).
Conclusion: Our results suggest that insulin resistance promotes LA electrical remodeling and
might be related to AF recurrence after PVI.
3
Key Words
:Atrial fibrillation; clinical outcome; insulin resistance; metabolic syndrome;
pulmonary vein isolation
4
Introduction
Atrial fibrillation (AF) has been recognized as the most common sustained arrhythmia, and is associated with both cardiovascular mortality and substantial morbidity.
1, 2Pulmonary vein isolation (PVI) is an established therapy because of its efficacy.
3, 4The development of an innovative approach to decreasing AF recurrence after PVI is important.
Metabolic syndrome is diagnosed according to a combination of several atherosclerotic risk factors including obesity, hypertension, dyslipidemia and abnormal glucose metabolism based on the guidelines, and is also proven to be associated with higher cardiac mortality and morbidity.
5These risk factors have also been shown to be associated with the pathogenesis and the development of AF.
6, 7The abnormal glucose metabolism including diabetes mellitus (DM), an impaired fasting glucose and impaired glucose tolerance, as a major component of metabolic syndrome, has been reported to affect the atrial substrate properties with an intra-atrial conduction delay and a low voltage area formation, resulting in greater AF recurrence rate after catheter ablation.
8Insulin resistance, which is a state of decrease in insulin response, is well known to be the
underlying mechanism in the development of the abnormal glucose metabolism.
9There are limited
data about the relationship between the pathogenesis of AF and insulin resistance.
10In addition, it
remains unclear whether insulin resistance affects AF recurrence after PVI. In the present study,
5
the clinical impact of insulin resistance on the promotion of atrial remodeling and AF recurrence after PVI was investigated in patients with paroxysmal AF.
Methods
Study population
The study included 141 consecutive paroxysmal AF patients who visited Fukushima Medical University Hospital in Fukushima, Japan, between February 2014 and June 2016. The subjects had been diagnosed as nondiabetic states according to the criteria of the American Diabetes Association.
11Those with diabetes mellitus and/or who were not fasting at the time of a blood examination were excluded from the study. Finally, the study participants were 114 patients (89 males, 62.6 ± 8.9 years) with symptomatic drug-refractory paroxysmal AF (Figure 1).
All patients underwent successful PVI at our hospital. No structural heart disease was detected
with echocardiography, coronary angiography or coronary artery imaging with computed
tomography (CT). The homeostasis model assessment of insulin resistance (HOMA-IR), which is
developed for application in large epidemiologic investigations. HOMA-IR served as a surrogate
measure to identify a proportion of insulin resistance without measuring insulin action directly.
12The previously validated homeostasis model assessment was assessed from fasting immuno-
reactive insulin and fasting blood glucose (HOMA-IR: fasting glucose × fasting insulin/405).
136
Insulin resistance was defined as HOMA-IR
≧2.5, according to the diagnostic criteria of the Japan Diabetes Society.
14, 15The study patients were categorized into two groups based on their insulin resistance.
Group 1 (n = 81) consisted of patients who showed no insulin resistance, and Group 2 (n =33) consisted of those who exhibited insulin resistance. Written informed consent was obtained from all study subjects, and the study was approved by the ethics committee of Fukushima Medical University.
Echocardiographic study
Echocardiography at baseline was performed in all patients in the left lateral decubitus position before and 1 year after PVI in the presence or absence of recurrence. Echocardiograms were obtained using a commercially available two-dimensional digital ultra sound scanner (ACUSON Sequoia, Siemens Medical Solutions USA, Inc., Mountain View, CA, USA). Conventional 2D, color Doppler and tissue Doppler images were acquired and saved in cineloop format. A minimum of three consecutive beats were recorded and the images were digitally stored for offline analysis.
Left atrial volume index (LAVI) and left ventricular ejection fraction (LVEF) were assessed with
echocardiography using the modified biplane Simpson’s rule. For LAVI measurement, three
consecutive beats in the apical four- and two-chamber views, including the entire left atrium at
end-systolic frames just before mitral valve opening, were acquired. Values were then indexed to
7
the body surface area. In order to calculate E/e’, conventional doppler tracings of the mitral inflow were obtained from the apical four-chamber view. The tissue doppler velocities of both the septal and lateral mitral annulus were obtained using the apical four-chamber view by placing the sample volume at the medial and lateral mitral annulus, respectively. The ratio of early mitral flow velocity (E) to early diastolic velocity of the septal and lateral mitral annulus (e’) was then calculated (septal and lateral E/e’). Next, the average septal and lateral E/e’ values were used for the evaluation of diastolic function. All Doppler signals were recorded at a speed of 50 mm/s.
Electrophysiological study
Each patient underwent an electrophysiologic study and first catheter ablation with radiofrequency catheher or cryoballoon ablation. Anti-arrhythmic drugs (AAD) were withheld for at least five half-lives, and the existence of LA thrombi were excluded by transesophageal echocardiography prior to PVI, which was performed under sedation with intravenous dexmedetomidine and fentanyl. A deca-polar catheter was positioned at the His bundle area via the right femoral vein to record His potential. A 20-polar catheter was inserted via the right subclavian vein, and the distal 10-polar electrodes were located at the distal coronary sinus (CS).
The proximal part of the catheter was positioned along the crista terminalis and superior vena cava
(SVC). Following transseptal puncture, 3D-electroanatomical mapping of the LA was
reconstructed using a contact force-sensing catheter (Thermocool® SmartTouch™, Biosense
8
Webster, CA, USA). Twelve-lead surface electrocardiograms (ECGs) and intracardiac electrograms were recorded simultaneously by a digital multichannel system (Prucka CardioLab®, General Electrical Healthcare, Milwaukee, WI, USA), filtered at 30–400 Hz for bipolar and 0.05–
400 Hz for unipolar electrograms.
Mapping and ablation
The details of the ablation procedure were as described previously. As for the RFCA procedure,
3D electroanatomical mapping (CARTO, Biosense Webster, CA, USA) of the LA with high-
density mapping (> 300 points) was performed during sinus rhythm (SR), using a contact force-
sensing catheter (Thermocool® SmartTouch™, Biosense Webster, CA, USA). If AF was
sustained, electrical defibrillation was performed to restore SR. Selective angiography of the PVs
was performed to define the PV ostia, and circumferential PVI was performed in a power-
controlled mode. Radiofrequency energy was delivered at 20 Watts along the posterior wall, roof
and bottom of LA, and 30 Watts in the remaining areas using a dragging technique with a
temperature limit of 43 ℃. During the procedure, unfractionated heparin was administered to
maintain an activated clotting time of over 300 seconds. With regard to the Cryo ablation procedure,
a 28-mm balloon (Arctic Front, Medtronic, Minneapolis, MN, USA) was introduced into the PV
ostium with the best possible occlusion of the PV after transseptal puncture. Occlusion was
considered to have been achieved when selective contrast injection showed total contrast retention
9
with no backflow to the atrium. Cryoablation was applied for 180 seconds in each vein, in an effort to achieve a circumferential ablation lesion. Before the ablation of right pulmonary veins were treated, a quadripolar catheter was placed in the superior vena cava to continuously stimulate the right phrenic nerve during Cryo application. The application was stopped immediately in cases when diaphragm movement were diminished. After successful PVI, intravenous isoproterenol was administered for the provocation of recovered PV conduction and non-PV firing (non-PV foci). In RFCA cases, if PV was still isolated and non-PV foci firing was not detected, a bolus administration of adenosine was used to check for dormant conduction and provocation of non- PV foci firing. If no AF induction was confirmed via CS burst pacing of up to 200 msec, the procedure was deemed completed.
Conduction velocity
A sequential contact voltage map was constructed during sinus rhythm. When AF occurred during
the procedure, external direct cardioversion was performed to convert to sinus rhythm. A 4-mm-
tipped ablation catheter was used to collect the local activation time (relative to the reference
signal) and voltage, while the catheter came in contact with the atrial wall as it was swiped
throughout the atrium during sinus rhythm. After completion of the sequential map, the bipolar
mapping points were analyzed using off-line software. Regional conduction velocity determined
in the direction of the propagation. The local conduction velocity for each point was calculated
10
according to previously established methodology from prior studies.
16-19The local conduction velocity was defined using electroanatomincal mapping points as the average of the conduction velocity calculated by 5 different adjacent point pairs along the activation front, where the conduction velocity between each pair of points was defined as the linear distance between the points divided by the difference in activation times. To avoid the inclusion of conduction velocity measurements in a difference direction than that of activation propagation, points with difference in local activation time < 5 ms from the index point were excluded from the conduction velocity calculation for that index point.
For the purpose of evaluating regional conduction differences, each atrium was segmented by four LA sites (anterior, septal, posterior and inferior wall). Then the mean conduction velocity for each region was determined by averaging the conduction velocity between five pair points along the activation front through regions of the least isochronal crowding at the four LA sites.
19-22Blood sampling and the evaluation
Venous blood was collected from all study subjects on the day before ablation. Levels of brain
type natriuretic peptide (BNP) was measured at our hospital. Estimated glomerular filtration rate
(eGFR) was calculated using the Modification of Diet in Renal Disease (MDRD) equation, in
keeping with the criteria of the 2002 Kidney Disease Outcome Quality Initiative (KDOQUI)
11
guidelines. Measurement of high sensitivity C-reactive protein (hsCRP) was performed using the CRP-Latex (Ⅱ) immunoturbidimetric assay (Denka Seika, Tokyo, Japan). Oxidized low-density lipoprotein (oxLDL) was measured using commercially available enzyme-linked immunosorbent assay (ELISA) kits (Sekisui Medical, Tokyo, Japan). Plasminogen activator inhibitor-1 (PAI-1) was measured using a Latex Photometric Immunoassay (LSI Medience, Tokyo, Japan).
Concentrations of inflammatory cytokines including tumor necrosis factor α (TNF -α), interleukin- 6 (IL-6) and interleukin-1β(IL-1β), as well as fibrosis related markers including transforming growth factor β1 (TGF-β1) and matrix metalloproteinase 9 (MMP-9), were measured using commercially available ELISA kits (Quantikine, R&D Systems, Minneapolis, MN, USA) according to the manufacturer's specifications. All samples were run-in duplicates.
Follow up
Follow up was performed at 1, 3 and 6 months after the procedure, then every 3 months thereafter.
At each visit, 12-lead ECG and 24-hour Holter monitoring were performed. Recurrence was
defined as documentation of atrial tachycardia (AT) or AF lasting > 30 sec recorded in a 12-lead
ECG or 24-hour Holter monitoring. AAD were continued 3 months after PVI, and discontinued
thereafter. The long-term efficacy was assessed clinically, by the basis of the clinical symptoms,
surface 12-lead ECG, and 24-hour Holter monitoring.
12
Statistical analysis
A Chi-square test was used for comparisons of categorical variables, which are expressed as
numbers and variables. Continuous variables were presented as mean ± standard deviation, and
normality was confirmed using the Shapiro-Wilk test. Parametric variables were compared using
Student’s t-test, and non-parametric variables (e.g. BNP) were compared using the Mann-Whitney
U test. The comparison of LAVI before and after the ablation procedure was performed using a
paired Student t test. Freedom from recurrence was evaluated using the Kaplan-Meier method, and
the log-rank test was used for initial comparisons. The predictor for AF recurrence was tested using
univariate and multivariate Cox proportional hazard analyses, and was expressed as a hazard ratio
(HR) and confidence interval (CI). In the multivariate Cox proportional hazard analysis, to prepare
for potential confounding, we considered the following clinical factors, which possibly affect AF
recurrence: sex, age, body mass index, hypertension, dyslipidemia, eGFR, BNP, hsCRP, LAVI,
LVEF, and HOMA-IR. All analyses were performed using SPSS for Windows, version 25.0 (SPSS
Inc., Chicago, IL, USA), and all statistical tests were two-sided. A P-value of < 0.05 was
considered statistically significant.
13
Results
Patient characteristics
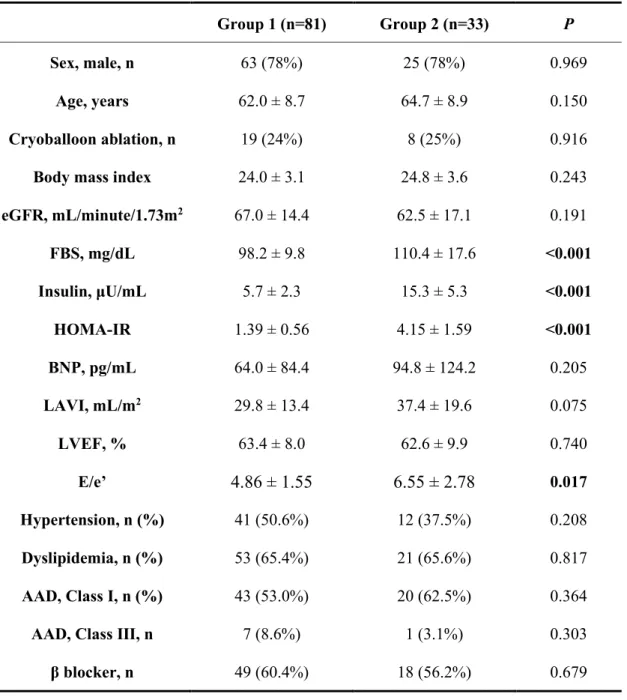
The patient characteristics of the two groups are shown in Table 1. There were no significant differences in sex, age, AF type or body mass index. LVEF and LAVI prior to the ablation showed no statistical difference. However, the E/e’ in Group 2 was significantly higher than that in Group 1. BNP and eGFR did not differ between the groups, nor did the prevalence of hypertension and dyslipidemia. There were no statistical differences in the use of AAD or β blockers. Fasting blood glucose and fasting insulin were both significantly higher in Group 2 than in Group 1 (110.4 ± 17.6 vs. 98.2 ± 9.8, P < 0.001, 15.3 ± 5.3 vs. 5.7 ± 2.3, P < 0.001, respectively). HOMA-IR was also higher in Group 2 compared with Group 1 (4.15 ± 1.59 vs. 1.39 ± 0.56, P < 0.001).
Blood sample analysis
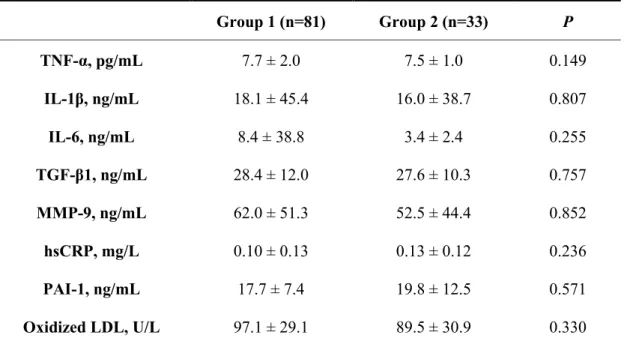
Inflammatory cytokines such as TNF-α, IL-1β and IL-6 did not differ between Groups 1 and 2
(TNF-α: 7.7 ± 2.0 vs. 7.5 ± 1.0 pg/mL, P = 0.149; IL-1β: 18.1 ± 45.4 vs. 16.0 ± 38.7 ng/mL, P =
0.807, IL-6: 8.4 ± 38.8 vs. 3.4 ± 2.4 ng/mL, P = 0.255), as shown in Table 2. In addition, TGF-β1
and MMP-9 did not differ between the groups (TGF-β1: 28.4 ± 12.0 vs. 27.6 ± 10.3 ng/mL, P =
0.757; MMP-9: 62.0 ± 51.3 vs. 52.5 ± 44.4 ng/mL, P = 0.852). The levels of hsCRP, PAI-1and
oxidized LDL showed no differences between the groups (hsCRP: 0.10 ± 0.13 vs. 0.13 ± 0.12
14
mg/L, P = 0.236; PAI-1: 17.7 ± 7.4 vs. 19.8 ± 12.5 ng/mL, P = 0.571; oxidized LDL: 97.1 ± 29.1 vs. 89.5 ± 30.9 U/L, P = 0.330).
Clinical outcome after PVI
During the follow-up period of 357 ± 170 days, recurrence was documented in 28 of the 114 patients (24.5%). At the time of PVI, 3D electroanatomical map of LA was reconstructed using CARTO system. None of the study patients showed low voltage/scar areas in LA. With respect to the comparison of ablation outcome between the two groups, recurrence occurred more frequently in Group 2 (39.0% vs. 18.5%, P = 0.019). The Kaplan-Meier time-to-event curves for recurrence revealed a higher recurrence ratio in Group 2 than in Group 1, as shown in Figure 2 (P = 0.019).
Predictor for AF recurrence
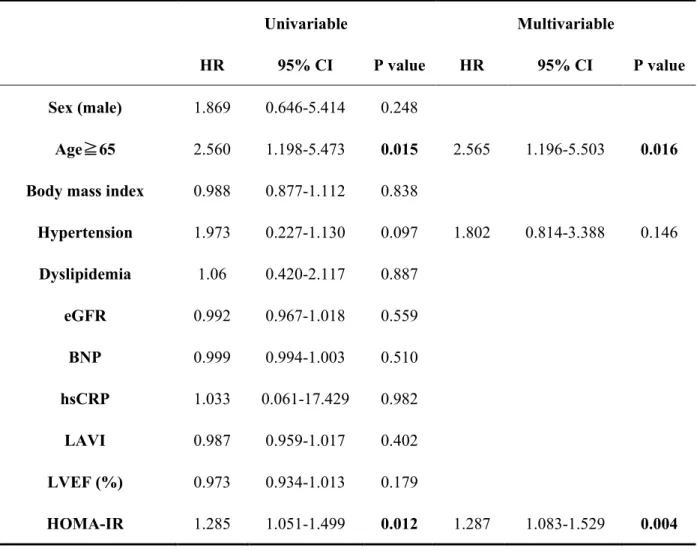
Univariable analysis showed that HOMA-IR as a continuous variable had predictive power for AF recurrence after PVI (hazard ratio 1.255, 95% CI: 1.051 – 1.499, P = 0.012), as shown in Table 3.
In the multivariable Cox regression hazard analysis, HOMA-IR remained an independent predictor of AF recurrence (hazard ratio 1.287, 95% CI: 1.831 – 1.529, P = 0.004).
Conduction velocity of LA
As shown in Figure 3, the conduction velocity of total LA in Group 2 was slower than that in
Group 1 (0.715 ± 0.199 vs. 1.120 ± 0.287 m/s, P < 0.001). Moreover, the conduction velocity of
the four different LA sections (anterior, posterior, inferior and septum) were calculated to elucidate
15
whether there was a difference in conduction velocity based on LA wall location. All of the conduction velocities in the anterior, septal, posterior and inferior walls of the LA were significantly slower in Group 2 than in Group 1 (0.7±0.1 vs. 1.0±0.3 m/s, P < 0.001, 0.6±0.2 vs.
1.0±0.2 m/s, P < 0.001, 0.7±0.3 vs. 1.1±0.3 m/s, P < 0.001, 0.7±0.3 vs. 1.1±0.3 m/s, P < 0.001, respectively).
Echocardiography
An anatomical remodeling of the LA as an echocardiographic change was evaluated using left atrial volume index (LAVI). The comparison of LAVI before and 1 year after PVI was performed.
No significant difference was observed regarding LAVI between the two groups before and 1 year after PVI (Group 1; 32.6 ± 13.6 vs. 33.3 ± 11.4, P = 0.718; Group 2; 39.3 ± 21.4 vs. 35.1 ± 13.4, P = 0.176).
Discussion
The major findings of the present study are as follows: 1) insulin resistance is associated with AF
recurrence after PVI and is an independent predictor of recurrence; 2) conduction velocity in the
insulin resistance patients was delayed compared with that in those with no insulin resistance; and
3) LAVI between before and 1 year after PVI, and serum levels of inflammatory and fibrotic
markers at baseline showed no statistical difference between the groups.
16
Insulin resistance and BMI
Insulin resistance is strongly associated with obesity.
23The adverse effects of the combination of insulin resistance and obesity on cardiac function have been reported.
24Of note, this negative effect was improved by reduction in body weight through life style intervention. In the current study, mean BMI in group 1 was normal. In addition, BMI in group 2 was also within normal range, irrespective of the existence of insulin resistance. This can be explained by the genetic difference in glucose tolerance between Japanese and Westerner. Japanese people has been reported to have genetically decreased insulin secretary ability, compared with Caucasian people.
25This means that some Japanese people had a genetic predisposition to impaired glucose tolerance, including insulin resistance, even if they are not obese.
Insulin resistance and anatomical remodeling
Dahiya et al. compared cardiac function and hsCRP levels between an insulin-resistant group and
a non-insulin resistant group in overweight young people.
26According to the study, E/e’ by
echocardiography in the insulin-resistant group was greater than that in the non-insulin resistant
group. However, they found no significant difference regarding LAVI and hsCRP levels between
the two groups. On the other hand, LAVI and hsCRP levels in the non-overweight young people
were significantly lower than those in the overweight young people. In the present study, LAVI
did not significantly differ between the two groups. However, the E/e’ in Group 2 was higher than
17
that in Group 1. These results were totally consistent with the previous one. Although no difference in hsCRP was observed between the two groups in our study, hsCRP levels in both groups exceeded normal limit. These results suggest that the existence of AF might promote increases in LA volume index and hsCRP, and insulin resistance had little impact on these changes. Zahra et al. reported that the value of TGF-β1 and MMP-9 was elevated in insulin resistance mice.
10Of interest, they also showed that the insulin-resistant mice did not exhibit atrial fibrosis. In humans, it was reported that these fibrotic markers and inflammatory cytokines were elevated in AF patients.
27-29
In the current study, fibrotic markers and inflammatory cytokines were elevated above the
reference values. These finding indicate that AF could elevate fibrotic marker and inflammatory cytokines; however, insulin resistance did not affect the value of these markers. Those factors suggested that insulin resistance would not induce additional atrial fibrosis or cause any change between LAVI before and 1 year after PVI in insulin-resistant patients, therefore, insulin resistance had little impact on the anatomical LA remodeling in the present study.
Insulin resistance and electrical remodeling
Zahra et al. reported that insulin-resistant mice were vulnerable, and had a propensity, to both
induced and spontaneous AF.
10In the present study, LA conduction velocity was significantly
slower in the insulin-resistant group than in the normal group. Chao et al. previously showed that
the impaired glucose tolerance may result in electrical remodeling before structural remodeling.
818
These results are consistent with the current study. Insulin resistance induced electrical remodeling caused by delay of LA conduction velocity. On the other hand, insulin resistance had little influence on the promotion of anatomical remodeling, resulting in no progression of LA dilatation and no increase in fibrotic and inflammatory markers. We believe that this could be the underlying mechanism of insulin resistance-induced AF recurrence after PVI.
Clinical Implications
As mentioned above, insulin resistance was improved by body weight reduction, resulting in recovery of cardiac function.
24Regarding AF recurrence after PVI, an ARREST-AF cohort study revealed that multiple risk factor management, including blood pressure, glucose metabolism, lipid profile and body weight, was needed to prevent AF recurrence after an ablation procedure.
30Interestingly, aggressive blood pressure treatment has been shown not to be able to reduce atrial arrhythmia recurrence after PVI. These results suggest that the control of individual risk factors such as insulin resistance, blood pressure and body weight might be insufficient for preventing AF after PVI. Multiple risk factor management should be considered both for the improvement of insulin resistance and for better clinical outcome after PVI in patients with paroxysmal AF.
Study limitations
This observational study investigated whether insulin resistance was able to predict recurrence of
AF after PVI. As with most observational studies, it is affected by confounding by indication.
19
We analyzed hsCRP and other prognostic factors in blood samples obtained by a point blood sampling with self-assessed fasting status, which may be subject to human errors. In addition, our study population was relatively small, which might have influenced the analysis and interpretation of the data. Further studies of larger populations are required to confirm our results.
Conclusions
Insulin resistance is a predictor of AF recurrence after PVI. For better PVI outcome, it may be important to manage not only insulin resistance, but also multiple risk factors associated with AF recurrence.
Author contribution
Concept/design: Naoko Hijioka, Masashi Kamioka Data collection: Naoko Hijioka
Data analysis/interpretation: Naoko Hijioka, Masashi Kamioka, Yoshiyuki Matsumoto, Minoru Nodera, Shinya Yamada, Takashi Kaneshiro
Statistics: Akiomi Yoshihisa Drafting article: Masashi Kamioka
Critical revision and approval of article: Takafumi Ishida, Yasuchika Takeishi
20
References
1. Lloyd-Jones DM, Wang TJ, Leip EP, Larson MG, Levy D, Vasan RS, D'Agostino RB, Massaro JM, Beiser A, Wolf PA and Benjamin EJ. Lifetime risk for development of atrial fibrillation: the Framingham Heart Study. Circulation. 2004;110:1042-6.
2. Benjamin EJ, Wolf PA, D'Agostino RB, Silbershatz H, Kannel WB and Levy D. Impact of atrial fibrillation on the risk of death: the Framingham Heart Study. Circulation.
1998;98:946-52.
3. Jais P, Cauchemez B, Macle L, Daoud E, Khairy P, Subbiah R, Hocini M, Extramiana F, Sacher F, Bordachar P, Klein G, Weerasooriya R, Clementy J and Haissaguerre M.
Catheter ablation versus antiarrhythmic drugs for atrial fibrillation: the A4 study.
Circulation. 2008;118:2498-505.
4. Wilber DJ, Pappone C, Neuzil P, De Paola A, Marchlinski F, Natale A, Macle L, Daoud EG, Calkins H, Hall B, Reddy V, Augello G, Reynolds MR, Vinekar C, Liu CY, Berry SM and Berry DA. Comparison of antiarrhythmic drug therapy and radiofrequency catheter ablation in patients with paroxysmal atrial fibrillation: a randomized controlled trial.
JAMA. 2010;303:333-40.
5. Executive Summary of The Third Report of The National Cholesterol Education Program
(NCEP) Expert Panel on Detection, Evaluation, And Treatment of High Blood
21
Cholesterol In Adults (Adult Treatment Panel III). JAMA. 2001;285:2486-97.
6. Dublin S, French B, Glazer NL, Wiggins KL, Lumley T, Psaty BM, Smith NL and Heckbert SR. Risk of new-onset atrial fibrillation in relation to body mass index. Arch Intern Med. 2006;166:2322-8.
7. Korantzopoulos P, Kokkoris S and Papaioannides D. The association of metabolic syndrome with atrial fibrillation: an emerging epidemiological and pathophysiological hypothesis. Cardiology. 2005;104:148-9.
8. Chao TF, Suenari K, Chang SL, Lin YJ, Lo LW, Hu YF, Tuan TC, Tai CT, Tsao HM, Li CH, Ueng KC, Wu TJ and Chen SA. Atrial substrate properties and outcome of catheter ablation in patients with paroxysmal atrial fibrillation associated with diabetes mellitus or impaired fasting glucose. Am J Cardiol. 2010;106:1615-20.
9. Warram JH, Martin BC, Krolewski AS, Soeldner JS and Kahn CR. Slow glucose removal rate and hyperinsulinemia precede the development of type II diabetes in the offspring of diabetic parents. Ann Intern Med. 1990;113:909-15.
10. Maria Z, Campolo AR, Scherlag BJ, Ritchey JW and Lacombe VA. Dysregulation of insulin-sensitive glucose transporters during insulin resistance-induced atrial fibrillation.
Biochimica Biophys Acta. 2018;1864:987-996.
11. Report of the Expert Committee on the Diagnosis and Classification of Diabetes Mellitus.
22
Diabetes care. 1997;20:1183-97.
12. Hanley AJ, Wagenknecht LE, D'Agostino RB, Jr., Zinman B and Haffner SM.
Identification of subjects with insulin resistance and beta-cell dysfunction using alternative definitions of the metabolic syndrome. Diabetes. 2003;52:2740-7.
13. Matthews DR, Hosker JP, Rudenski AS, Naylor BA, Treacher DF and Turner RC.
Homeostasis model assessment: insulin resistance and beta-cell function from fasting plasma glucose and insulin concentrations in man. Diabetologia. 1985;28:412-9.
14. Society JD. Treatment Guide for Diabetes 2010. Treatment Guide for Diabetes Editorial Committee. 2010.
15. Yamada C, Mitsuhashi T, Hiratsuka N, Inabe F, Araida N and Takahashi E. Optimal reference interval for homeostasis model assessment of insulin resistance in a Japanese population. J Diabetes Investig. 2011;2:373-6.
16. Fukumoto K, Habibi M, Ipek EG, Zahid S, Khurram IM, Zimmerman SL, Zipunnikov V, Spragg D, Ashikaga H, Trayanova N, Tomaselli GF, Rickard J, Marine JE, Berger RD, Calkins H and Nazarian S. Association of Left Atrial Local Conduction Velocity With Late Gadolinium Enhancement on Cardiac Magnetic Resonance in Patients With Atrial Fibrillation. Circ Arrhythm Electrophysiol. 2016;9:e002897.
17. John B, Stiles MK, Kuklik P, Chandy ST, Young GD, Mackenzie L, Szumowski L, Joseph
23
G, Jose J, Worthley SG, Kalman JM and Sanders P. Electrical remodelling of the left and right atria due to rheumatic mitral stenosis. Eur Heart J. 2008;29:2234-43.
18. Miyamoto K, Tsuchiya T, Narita S, Yamaguchi T, Nagamoto Y, Ando S, Hayashida K, Tanioka Y and Takahashi N. Bipolar electrogram amplitudes in the left atrium are related to local conduction velocity in patients with atrial fibrillation. Europace. 2009;11:1597- 605.
19. Kistler PM, Sanders P, Fynn SP, Stevenson IH, Spence SJ, Vohra JK, Sparks PB and Kalman JM. Electrophysiologic and electroanatomic changes in the human atrium associated with age. J Am Coll Cardiol. 2004;44:109-16.
20. Kuklik P, Szumowski L, Zebrowski JJ and Walczak F. The reconstruction, from a set of points, and analysis of the interior surface of the heart chamber. Physiol Meas.
2004;25:617-27.
21. Sanders P, Morton JB, Davidson NC, Spence SJ, Vohra JK, Sparks PB and Kalman JM.
Electrical remodeling of the atria in congestive heart failure: electrophysiological and electroanatomic mapping in humans. Circulation. 2003;108:1461-8.
22. Sanders P, Morton JB, Kistler PM, Spence SJ, Davidson NC, Hussin A, Vohra JK, Sparks
PB and Kalman JM. Electrophysiological and electroanatomic characterization of the
atria in sinus node disease: evidence of diffuse atrial remodeling. Circulation.
24
2004;109:1514-22.
23. Lumeng CN and Saltiel AR. Inflammatory links between obesity and metabolic disease.
J Clin Invest. 2011;121:2111-7.
24. Kosmala W, O'Moore-Sullivan T, Plaksej R, Przewlocka-Kosmala M and Marwick TH.
Improvement of left ventricular function by lifestyle intervention in obesity: contributions of weight loss and reduced insulin resistance. Diabetologia. 2009;52:2306-2316.
25. Fukushima M, Suzuki H and Seino Y. Insulin secretion capacity in the development from normal glucose tolerance to type 2 diabetes. Diabetes Res Clin Pract. 2004;66:37-43.
26. Dahiya R, Shultz SP, Dahiya A, Fu J, Flatley C, Duncan D, Cardinal J, Kostner KM, Byrne NM, Hills AP, Harris M, Conwell LS and Leong GM. Relation of reduced preclinical left ventricular diastolic function and cardiac remodeling in overweight youth to insulin resistance and inflammation. Am J Cardiol. 2015;115:1222-8.
27. Nakano Y, Niida S, Dote K, Takenaka S, Hirao H, Miura F, Ishida M, Shingu T, Sueda T, Yoshizumi M and Chayama K. Matrix metalloproteinase-9 contributes to human atrial remodeling during atrial fibrillation. J Am Coll Cardiol. 2004;43:818-25.
28. Savage DB, Petersen KF and Shulman GI. Mechanisms of insulin resistance in humans and possible links with inflammation. Hypertension. 2005;45:828-33.
29. Liu Y, Niu XH, Yin X, Liu YJ, Han C, Yang J, Huang X, Yu X, Gao L, Yang YZ, Xia YL
25
and Li HH. Elevated Circulating Fibrocytes Is a Marker of Left Atrial Fibrosis and Recurrence of Persistent Atrial Fibrillation. J Am Heart Assoc. 2018;7.
30. Pathak RK, Middeldorp ME, Lau DH, Mehta AB, Mahajan R, Twomey D, Alasady M, Hanley L, Antic NA, McEvoy RD, Kalman JM, Abhayaratna WP and Sanders P.
Aggressive risk factor reduction study for atrial fibrillation and implications for the
outcome of ablation: the ARREST-AF cohort study. J Am Coll Cardiol. 2014;64:2222-31.
26
Figure legends
Figure 1.
Overview for the workflow for the present study.
Figure 2.
The Kaplan-Meier time-to-event curves for recurrence after PVI. The patients with insulin resistance exhibited a higher recurrence rate than those with insulin resistance.
Figure 3.
The conduction velocity in each part of LA between Groups 1 and 2. The conduction velocity of
insulin-resistant group was slower than non-insulin resistant group in every part of LA (anterior,
septal, posterior, inferior wall and LA total). Blue bar indicates Group 1 and Orange bar Group 2.
27
Table 1. Patient characteristics
Group 1 (n=81) Group 2 (n=33) P
Sex, male, n 63 (78%) 25 (78%) 0.969
Age, years 62.0 ± 8.7 64.7 ± 8.9 0.150
Cryoballoon ablation, n 19 (24%) 8 (25%) 0.916 Body mass index 24.0 ± 3.1 24.8 ± 3.6 0.243 eGFR, mL/minute/1.73m2 67.0 ± 14.4 62.5 ± 17.1 0.191 FBS, mg/dL 98.2 ± 9.8 110.4 ± 17.6 <0.001 Insulin, μU/mL 5.7 ± 2.3 15.3 ± 5.3 <0.001 HOMA-IR 1.39 ± 0.56 4.15 ± 1.59 <0.001 BNP, pg/mL 64.0 ± 84.4 94.8 ± 124.2 0.205
LAVI, mL/m2 29.8 ± 13.4 37.4 ± 19.6 0.075
LVEF, % 63.4 ± 8.0 62.6 ± 9.9 0.740
E/e’
4.86 ± 1.55 6.55 ± 2.78
0.017Hypertension, n (%) 41 (50.6%) 12 (37.5%) 0.208 Dyslipidemia, n (%) 53 (65.4%) 21 (65.6%) 0.817 AAD, Class Ⅰ, n (%) 43 (53.0%) 20 (62.5%) 0.364
AAD, Class Ⅲ, n 7 (8.6%) 1 (3.1%) 0.303
β blocker, n 49 (60.4%) 18 (56.2%) 0.679
P values in bold are statistically significant.
AAD, anti-arrhythmia drug; BNP, brain natriuretic peptide; eGFR, estimated glomerular
filtration rate; FBS, fasting blood sugar; HOMA-IR, homeostasis model assessment of insulin
resistance; LAVI, left atrial volume index; LVEF, left ventricular ejection fraction.
28
Table 2. Comparison of inflammatory cytokines and blood sample between the Groups 1
and 2.
Group 1 (n=81) Group 2 (n=33) P
TNF-α, pg/mL 7.7 ± 2.0 7.5 ± 1.0 0.149
IL-1β, ng/mL 18.1 ± 45.4 16.0 ± 38.7 0.807
IL-6, ng/mL 8.4 ± 38.8 3.4 ± 2.4 0.255
TGF-β1, ng/mL 28.4 ± 12.0 27.6 ± 10.3 0.757 MMP-9, ng/mL 62.0 ± 51.3 52.5 ± 44.4 0.852 hsCRP, mg/L 0.10 ± 0.13 0.13 ± 0.12 0.236
PAI-1, ng/mL 17.7 ± 7.4 19.8 ± 12.5 0.571
Oxidized LDL, U/L 97.1 ± 29.1 89.5 ± 30.9 0.330
hsCRP, high sensitivity C-reactive protein; IL-1β, interleukin-1β; IL-6, interleukin-6; MMP-9, matrix metalloproteinase-9; Oxidized LDL, oxidized low-density lipoprotein; PAI-1,
plasminogen activator inhibitor-1; TGF-β1, transforming growth factor-β1; TNF-α, tumor
necrosis factor-α.
29
Table 3. Univariable and multivariable Cox regression hazard analysis for AF recurrence
Univariable Multivariable
HR 95% CI P value HR 95% CI P value Sex (male) 1.869 0.646-5.414 0.248
Age≧65 2.560 1.198-5.473 0.015 2.565 1.196-5.503 0.016 Body mass index 0.988 0.877-1.112 0.838
Hypertension 1.973 0.227-1.130 0.097 1.802 0.814-3.388 0.146 Dyslipidemia 1.06 0.420-2.117 0.887
eGFR 0.992 0.967-1.018 0.559
BNP 0.999 0.994-1.003 0.510
hsCRP 1.033 0.061-17.429 0.982 LAVI 0.987 0.959-1.017 0.402 LVEF (%) 0.973 0.934-1.013 0.179
HOMA-IR 1.285 1.051-1.499 0.012 1.287 1.083-1.529 0.004
P values in bold are statistically significant.
hsCRP, high sensitivity C-reactive protein; The other abbreviations are the same as those in
Table 1.
㻟㻜㻌 㻌
Figure 1.
Overview for the workflow for the present study.
㻟㻝㻌 㻌
Figure 2.
The Kaplan-Meier time-to-event curves for recurrence after PVI. The patients with insulin
resistance exhibited a higher recurrence rate than those with insulin resistance.
㻟㻞㻌 㻌