1. Introduction
Height is an easily measured variable, and is thought to
be determined during childhood and adolescence by genetic predisposition, nutrition, physical and social environments, as well as other factors.
1,2Recent studies have confirmed that taller people are at greater risk of death from several organ specific malignancies such as melanoma and cancer
of the pancreas, breast, ovary, prostate and colorectum.
3-7 Another study reported that the prevalence of malignantneoplasms was higher for participants with gout than those without gout.
8However, no published study thus far has examined the
possible association between height and hyperuricemia in a general population, although the prevalence of hyperurice- mia was reportedly higher among obese than non-obese indi-
MS#AMN 07133
Relationships of adult body height and BMI status to hyperuricemia in general Japanese male population: The Nagasaki Islands Study
Yuji S
HIMIZU1,2, Mio N
AKAZATO2, Takaharu S
EKITA2, Koichiro K
ADOTA1, Kazuhiko A
RIMA3, Hironori Y
AMASAKI4, Hisashi G
OTO5, Noboru T
AKAMURA6, Kiyoshi A
OYAGI3, Takahiro M
AEDA1,21 Department of Community Medicine, Nagasaki University Graduate School of Biomedical Science, Nagasaki, Japan
2 Department of Island and Community Medicine, Nagasaki University Graduate School of Biomedical Science, Nagasaki, Japan
3 Department of Public Health, Nagasaki University Graduate School of Biomedical Sciences, Nagasaki, Japan
4 Center for Health and Community Medicine, Nagasaki University, Nagasaki, Japan
5 Goto Health Care Office, Nagasaki, Japan
6 Department of Global Health, Medicine and Welfare, Nagasaki University Graduate School of Biomedical Sciences, Nagasaki, Japan
Several studies have reported that adult height is positively associated with risk of cancer on the hypothesis that height is a marker of childhood physical condition, and others that the risk of cancer was higher for participants with higher serum uric acid levels. We conducted a cross sectional study of 1,350 men aged 30-89 years undergoing general health check-ups.
Since body mass index (BMI) is regarded as a surrogate marker of current physical condition for hyperuricemia risk, we per- formed a stratified analysis of this risk based on BMI. Of the total study population, 368 men were diagnosed with hyperurice- mia (serum uric acid>7.0mg/dl), and a positive association between height and prevalence of hyperuricemia was detected, which was independent of classical cardiovascular risk factors. The adjusted odds ratio (OR) and 95% confidence interval (CI) for hyperuricemia of an increment of 1 SD for height (6.7cm) was 1.17 (CI: 1.01-1.35). Analysis of this association according to BMI status (non-overweight or overweight) disclosed a positive association only for non-overweight men. The adjusted ORs and CIs for hyperuricemia of an increment of 1 SD for height were 1.26 (1.05-1.52) for non-overweight and 1.01 (0.79-1.29) for overweight subjects. Height was found to be positively associated with the risk of hyperuricemia for Japanese men, espe- cially non-overweight men (BMI<25kg/2) which suggests that childhood social and physical conditions may contribute to the development of hyoeruricemia in adulthood.
ACTA MEDICA NAGASAKIENSIA 58: 57−62, 2013 Key words: height, hyperuricemia, Body Mass Index, men
Address correspondence: Prof. Takahiro Maeda, MD, PhD, Department of Community Medicine, Nagasaki University Graduate School of Biomedical Science, Nagasaki-shi, Sakamoto 1-12-4, Nagasaki 852-8523, Japan
Tel.: +81-95-819-7578, Fax: +81-95-819-7189, E-mail: [email protected] Received May 13, 2013; Accepted June 28, 2013
viduals.
9,10For an investigation of the association between height and elevated serum uric acid, BMI status should thus be taken into account.
We hypothesized that height is positively associated with risk of hyperuricemia (serum uric acid>7.0mg/dl) es- pecially for non-overweight (BMI<25kg/m
2) because status of overweight (BMI≥25kg/m
2) might reduce the effects of childhood social and physical conditions on hyperurice- mia.
To examine this hypothesis, we conducted a cross-section-
al study of a general population of Japanese men who re- ceived general health check-ups between 2005 and 2012.
2. Material and Methods
2.1 ParticipantsThe survey population included 1,538 men aged 30 to 89
years, all residents of the western rural community of the Goto Islands, who participated in this study between 2005 and 2012. A total of 32 individuals with missing data and 156 individuals with a history of cardiovascular disease were excluded, leaving 1,350 men for enrolment in this study. The mean age of the study population was 64.8 years (
±10.7 SD; range 30-89). Written consent forms were avail- able in Japanese to ensure comprehensive understanding of the study objectives, and informed consent was signed by the participants. This study was approved by the Ethics Com- mittee for Use of Humans of Nagasaki University (project registration number 0501120073).
2.2 Data collections and laboratory measurements Body weight and height were measured with an automat-
ic body composition analyzer (BF-220; Tanita, Tokyo, Ja- pan) when blood was drawn.
Fasting blood samples were obtained and the serum was
separated and centrifuged after blood coagulation. Serum samples were also obtained in individual siliconized tubes.
Serum triglycerides, HDL cholesterol, aspartate amin-
otransferase (AST),
γ-glutamyltraspeptidase (γ-GTP),HbA
1c, serum uric acid, and serum creatinine were mea- sured with standard laboratory procedures. Since the meth- od recently proposed by a working group of the Japanese Chronic Kidney Disease Initiative (JCKDI)
11does not take the influence of height and weight into account, whereas Horioʼs method
12does, we estimated the glomerular filtra- tion rate (GFR) by using both methods. The
first methodwas established with three variations, resulting in: GFR
(JCKD)
(ml/min/1.73m2) = 194
×(serum creatinine (enzyme method) )
-1.094×(age)
-0.287. The other method was the one re- ported by Horio as the following equation: GFR(Horio) (ml/
min)= (33-0.065
×age –0.493×BMI) × weight / serum creati- nine (enzyme method)
× 14.4 for men.Trained interviewers obtained information on smoking
status, drinking status, medical history, and use of antihy- pertensive agents, medication for diabetes mellitus, and medication for dyslipidemia. HbA
1c, as defined by the Na- tional Glycohemoglobin Standardization Program (NGSP) was calculated with the following equation, which was re- cently proposed by a working group of the Japanese Diabe- tes Society (JDS): HbA
1c(NGSP) = HbA
1c(JDS) + 0.4%.
13Presence of diabetes was defined as HbA
1c(NGSP) ≥ 6.5%, and/or initiation of glucose-lowering medication or insulin therapy.
14Hyperuricemia was defined as a serum uric acid level >7mg/dl.
152.3 Statistical analysis
Differences in age-adjusted mean values or prevalence of
potential confounding factors by quartile of height were cal- culated by using covariance or general linear models, while logistic regression models were used for calculating odds ratios (OR) and 95% confidence intervals (CI) for the asso- ciation of hyperuricemia with body height. In addition, sub- jects were stratified by BMI status because higher BMI was reported to be associated with hyperuricemia.
9,10Three different approaches were used for making adjust-
ments for confounding factors. For Model 1, the data were adjusted only for age. For Model 2, we included other pos- sible confounding factors, namely smoking status (never smoker, former smoker, current smoker), alcohol consump- tion [non-drinker, current light to moderate drinker (1-6 times/week), current heavy drinker (every day)], body mass index (kg/m
2), diabetes mellitus (no, yes), systolic blood pressure (mmHg), antihypertensive medication use (no, yes), antihyperlipidemic agent use (no, yes), serum triglyc- erides (mg/dl), serum HDL cholesterol (mg/dl), serum AST (IU/L), and serum γ-GTP serum (IU/L). For Model 3, serum creatinine (mg/dl) was included.
All statistical analyses were performed with the SAS sys-
tem for Windows (version 9.3; SAS Inc., Cary, NC). All p- values for statistical tests were two-tailed, and values of
<0.05 were regarded as statistically significant.
3. Results
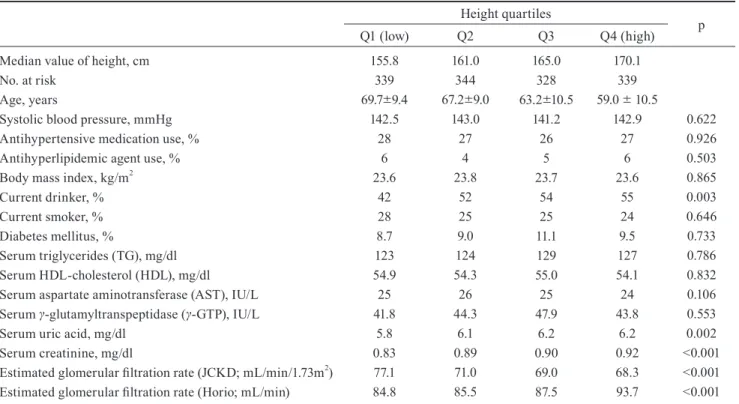
Of the 1,350 men taking part in the general health check-
up program, 368 were diagnosed with hyperuricemia (se- rum uric acid>7.0mg/dl). Table 1 shows age-adjusted char- acteristics for this study population in relation to body height. Current drinker status, serum uric acid, serum crea- tinine, and estimated glomerular filtration rate (Horio; ml/
min) were significantly positively associated, and estimated glomerular filtration rate (JCKD)(ml/min/1.73m
2) inversely associated with body height.
To assess the ability of serum creatinine to modify renal
function, we performed an additional analysis of the asso- ciation between hyperuricemia and chronic kidney disease (CKD) using two different criteria: CKD (JCKD)<60mL/
min/1.73m
2, and CKD (Horio)<60mL/min. We found that serum creatinine was a significant determinant of CKD as a risk factor for hyperuricemia in terms of either JCKD or Horio. The age-adjusted ORs (Model 1) were 2.76 (2.09- 3.64), P<0.001 for CKD (JCKD) and 3.97 (2.61-6.06), P<0.001 for CKD (Horio). Those associations remained valid even after adjustment for other classical cardiovascu- lar risk factors except for serum creatinine (Model 2). The resultant adjusted ORs were 2.52 (1.89-3.36), P<0.001 for CKD (JCKD) and 3.95 (2.54-6.14), P<0.001 for CKD
(Horio). When we made further adjustment for serum crea- tinine (Model 3), those associations disappeared. The ad- justed ORs after this final adjustment were 0.90 (0.58-1.39), P=0.636 for CKD(JCKD) and 1.00 (0.55-1.83), P=0.995 for CKD(Horio).
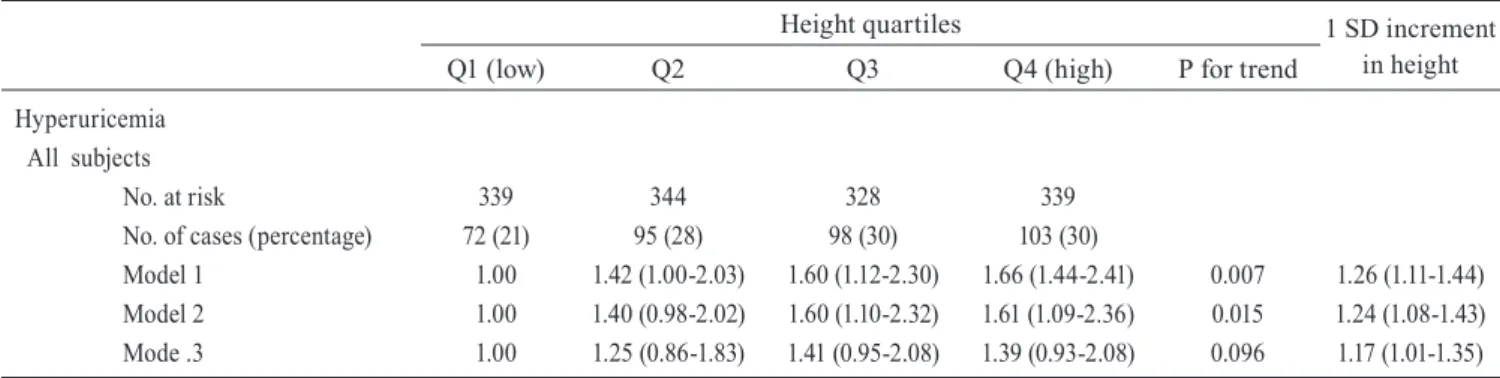
As shown in Table 2, height was positively associated
with risk of hyperuricemia. The age-adjusted OR and CI for hyperuricemia of an increment of 1 SD for height (6.7cm) was 1.26 (1.11-1.44). Even after adjustment for serum creati- nine, which resulted in a slight reduction in the OR, the as- sociation remained significant. The adjusted OR after fur- ther adjustment for other CVD risk factors except serum cratinine (Model 2) and including serum creatinine (Model 3) were 1.24 (1.08-1.43) and 1.17 (1.01-1.35), respectively.
The risk of hyperuricemia for being overweight was sub-
jected to further analysis, which showed that the age-adjust- ed OR was significant: 1.91(1.49-2.45), (P<0.001).
Table 3 shows the associations between height and risk of
hyperuricemia stratified by BMI status (non-overweight or overweight), indicating that height was positively associated with risk of hyperuricemia for non-overweight but not for overweight men. The fully-adjusted ORs were 1.26 (1.05- 1.52) for non-overweight and 1.01 (0.79-1.29) for over- weight.
Table 1. Age-adjusted mean numerical and percentage values according to body height
Height quartiles
Q1 (low) Q2 Q3 Q4 (high) p
Median value of height, cm No. at risk
Age, years
Systolic blood pressure, mmHg Antihypertensive medication use, % Antihyperlipidemic agent use, % Body mass index, kg/m2 Current drinker, % Current smoker, % Diabetes mellitus, %
Serum triglycerides (TG), mg/dl Serum HDL-cholesterol (HDL), mg/dl Serum aspartate aminotransferase (AST), IU/L Serum γ-glutamyltranspeptidase (γ-GTP), IU/L Serum uric acid, mg/dl
Serum creatinine, mg/dl
Estimated glomerular filtration rate (JCKD; mL/min/1.73m2) Estimated glomerular filtration rate (Horio; mL/min)
155.8 339 69.7∓9.4
142.5 28
6 23.6
42 28 8.7 123 54.9
25 41.8
5.8 0.83 77.1 84.8
161.0 344 67.2∓9.0
143.0 27
4 23.8
52 25 9.0 124 54.3 26 44.3
6.1 0.89 71.0 85.5
165.0 328 63.2∓10.5
141.2 26
5 23.7
54 25 11.1 129 55.0 25 47.9
6.2 0.90 69.0 87.5
170.1 339 59.0 ∓ 10.5
142.9 27
6 23.6
55 24 9.5 127 54.1 24 43.8
6.2 0.92 68.3 93.7
0.622 0.926 0.503 0.865 0.003 0.646 0.733 0.786 0.832 0.106 0.553 0.002
<0.001
<0.001
<0.001 Age: mean ∓ standard deviation. p: p factor. Height quartiles: <158.8cm, 158.8-163.0cm, 163.1-167.9cm, >167.9cm
4.Discussion
Major findings of the study presented here were that body
height showed positive associations with the risk of hyperu- ricemia for Japanese men, especially non-overweight men.
Being overweight was found to be a confounding factor for the subjects of this study.
Arastair et al. detected a significantly positive association
between height and serum uric acid for healthy mixed sex subjects (27 men and 30 women). This study also performed a sex-specific analysis and found that this association did not reach significance for either men or women. The corre- lation coefficients for serum uric acid concentration and
body height were r=0.47 (P<0.001) for all subjects, r=0.08 (P>0.1) for men, and r=0.15 (P>0.1) for women.
16However, women might not be suitable subjects for such
an investigation because menopause is independently asso- ciated with higher serum uric acid levels
17and also height is confounded by vertebral compression fractures, which are mainly caused by postmenopausal osteoporosis.
18We there- fore limited our study to men. Furthermore, the prevalence of hyperuricemia was reported to be higher for obese than non-obese individuals.
9,10A study taking BMI status, be- sides obesity, into account was also needed, however, and our study showed significant positive associations between body height and hyperuricemia for men, and that this asso-
Table 2. Odd ratios (ORs) and 95% confidence intervals (CI) for hyperuricemia in relation to body height for all subjectsHeight quartiles 1 SD increment
in height
Q1 (low) Q2 Q3 Q4 (high) P for trend
Hyperuricemia All subjects
No. at risk
No. of cases (percentage) Model 1
Model 2 Mode .3
339 72 (21)
1.00 1.00 1.00
344 95 (28) 1.42 (1.00-2.03) 1.40 (0.98-2.02) 1.25 (0.86-1.83)
328 98 (30) 1.60 (1.12-2.30) 1.60 (1.10-2.32) 1.41 (0.95-2.08)
339 103 (30) 1.66 (1.44-2.41) 1.61 (1.09-2.36) 1.39 (0.93-2.08)
0.007 0.015 0.096
1.26 (1.11-1.44) 1.24 (1.08-1.43) 1.17 (1.01-1.35) Model 1 : Adjusted for age. Model 2: Age + other CVD risk factors (systolic blood pressure, antihypertensive medication use, antihyperlipidemic agent use, body mass index, smoking, alcohol intake, diabetes mellitus, serum triglycerides, serum HDL cholesterol, serum aspartate aminotrans- ferase (AST), and serum γ-glutamyltranspeptidase (γ-GTP)). Model 3 : Model 2 + serum creatinine. Hyperuricemia defined as serum uric acid level >7.0mg/dL. Height quartiles: <158.8cm, 158.8-163.0cm, 163.1-167.9cm, and >167.9cm.
Table 3. Odd ratios (ORs) and 95% confidence intervals (CI) for hyperuricemia in relation to body height for all subjects
Height quartiles 1 SD increment
in height
Q1 (low) Q2 Q3 Q4 (high) P for trend
Hyperuricemia
Non-overweight (25kg/m2>BMI) No. at risk
No. of cases (percentage) Model 1
Mode .2 Model 3
Overweight (BMI≥25kg/m2) No. at risk
No. of cases (percentages) Model 1
Model 2 Model 3
243 39 (16)
1.00 1.00 1.00 96 33 (34)
1.00 1.00 1.00
225 53 (24) 1.67 (1.05-2.66) 1.70 (1.05-2.76) 1.57 (0.95-2.61)
119 42 (35) 1.04 (0.59-1.82) 1.02 (0.57-1.84) 0.83 (0.45-1.54)
224 58 (26) 1.98 (1.24-3.16) 1.98 (1.20-3.24) 1.82 (1.09-3.04)
104 40 (39) 1.16 (0.65-2.08) 1.07 (0.58-1.97) 0.84 (0.44-1.59)
223 60 (27) 2.17 (1.34-3.53) 2.12 (1.27-3.54) 1.86 (1.10-3.16)
116 43 (37) 1.07 (0.58-1.94) 0.95 (0.51-1.79) 0.81 (0.43-1.56)
0.002 0.004 0.023
0.762 0.916 0.578
1.39 (1.17-1.64) 1.35 (1.12-1.61) 1.26 (1.05-1.52)
1.09 (0.87-1.36) 1.05 (0.83-1.33) 1.01 (0.79-1.29) Model 1 : Adjusted for age. Model 2: Age + other CVD risk factors (systolic blood pressure, antihypertensive medication use, antihyperlipidemic agent use, body mass index, smoking, alcohol intake, diabetes mellitus, serum triglycerides, serum HDL cholesterol, serum aspartate aminotrans- ferase (AST), and serum γ-glutamyltranspeptidase (γ-GTP)). Model 3 : Model 2 + serum creatinine. Hyperuricemia : serum uric acid level >7.0mg/
dL. Height quartiles: <158.8cm, 158.8-163.0cm, 163.1-167.9cm, >167.9cm
ciation was limited to non-overweight participants.
Several studies have reported that positive associations
exist between body height and risk of death from several organ-specific malignancies such as melanoma and cancer of the pancreas, breast, ovary, prostate and colorectum.
3-7Other studies reported that risk of cancer was higher for subjects with higher uric acid levels.
8,19In this connection, it has been hypothesized that, because taller people have larg- er organs, they have more cells at risk of malignant transfor- mation and/or proliferation.
20Since uric acid is the
finalproduct of purine metabolism in human beings, cell prolif- eration is related to uric acid production. These mechanisms thus may explain why taller people show higher levels of uric acid.
Since height is regarded as a surrogate marker of child-
hood social and physical conditions
1,2while BMI may re-
flect primarily current physical conditions, a detailed analy-sis of persons with lower BMI may elucidate a potential effect of childhood conditions. A previous of ours, The Cir- culatory Risk in Community Study (CIRCS), determined that height was inversely associated with risk of stroke among middle-aged Japanese men and women and that in- verse association was limited to persons with lower BMI, which suggests that childhood social and physical condi- tions may contribute to the development of stroke in adult- hood.
21On the other hand, the prevalence of hyperuricemia is reportedly higher among obese than non-obese individu- als.
9,10And our present study determined significant positive association between height and hyperuricemia especially among participants with non-overweight which also sug- gests that childhood social and physical conditions may contribute to the development of hyperurimia in adult- hood.
These studies support our hypothesis that body height is
positively associated with risk of hyperurimia especially for non-overweight.
However, other studies have reported that height was in- versely associated with incidence of or mortality from car- diovascular disease,
22,23while several studies found a posi- tive association between serum uric acid and cardiovascular disease.
24-26Nevertheless, many of these reports indicated that hyperuricemia may not constitute an independent risk factor for most cardiovascular diseases.
24,25Potential limitations of this study warrant consideration.
Because we did not have access to creatinine clearance data and estimated GFR is not an effective tool for evaluating kidney function for a comparison of associations with vari- ous body heights, we could not perform an analysis adjusted for precise renal function. However, our analysis showed
statistically significant associations even after further ad- justments for serum creatinine, but because this study was cross sectional, we could not establish any causal relation- ships.
In conclusion, we established that body height is posi-
tively associated with risk of hyperuricemia (serum uric acid>7.0mg/dl) for general Japanese men, especially for non-overweight (25kg/m
2>BMI) men which suggests that childhood social and physical conditions may contribute to the development of hyoeruricemia in adulthood.
Acknowledgments
This work was supported by a Grant-in-Aid for Scientific
Research from the Japan Society for the Promotion of Sci- ence (No. 22370090). All authors have no
financial or anyother kinds of conflicts with this paper. We are grateful to the staff of Goto City Hall for their outstanding support.
References
1. McCarron P, Okasha M, McEwen J, et al. Height in young adulthood and risk of death from cardiorespiratory disease: a prospective study of male former students of Glasgow University, Scotland. Am J Epide- miol 155:683–687, 2002.
2. Gunnell D. Can adult anthropometry be used as a ʻbiomarkerʼ for pre- natal and childhood exposures? Int J Epidemiol 31:390–394, 2002.
3. Sung J, Song YM, Lawlor DA, et al. Height and site-specific cancer risk: a cohort study of a Korean adult popoulatoin. Am J Epidemiol 170: 53-64, 2009
4. Green J, Gairns BJ, Casabonne D, et al. Height and cancer incidence in the Million Women Study: prospective cohort, and meta-analysis of prospective studies of height and total cancer risk. Lancet Oncol 12:
785-794, 2011
5. Zuccolo L, Harris R, Gunnel D, et al. Height and prostate cancer risk:
a large nested case-control study (ProtectT) and meta-analysis. Can- cer Epidemiol Biomarkers Prev 17: 2325-36, 2008
6. Batty GD, Barzi F, Woodward M, et al. Asia Pacific Cohort studies Collaboration. Adult height and cancer mortality in Asia: the Asia Pa- cific Cohort Studies Collaboration.Ann Oncol 9: 106-117, 2010 7. Batty GD, Shipley MJ, Langenberg C, et al. Adult height in relation to
mortality from 14 cancer sites in men in London (UK): evidence from the original Whitehall study. Ann Oncol 17: 17157-17166, 2006 8. Boffetta P, Nordenvall C, Nyrén O, et al. A prospective study of gout
and cancer. Eur J Cancer Prev 18: 127-32, 2009
9. Binod KY, Gokul BC, Bibek P, et al. Serum uric acid level in obese and non-obese individuals. JNAMLS 10:27-30, 2009
10. Amin UH, Rashid M, Abdul JS, et al. Association of serum uric acid with obesity. JPMI 23: 3, 2009
11. Imai E, Equation for estimating GFR from creatinine in Japan. Nip- pon Rinsho. 66: 1725-1729, 2008 (in Japanese).
12. Horio M, Orita Y, Manabe S, et al. Formula and nomogram for pre- dicting creatinine clearance from serum creatinine concentration.
Clin Exper Nephrol 11: 110-114, 1997
13. Kashiwagi A, Kasuga M, Araki E, et al. Committee on the Stan- dardization of diabetes mellitus related laboratory testing of Japan
Diabetic Society. International clinical harmonization of glycated he- moglobin in Japan: From Japan Diabetes Society to National Glycohe- moglobin Standardization Program values. J of diabetes Invest 3: 39- 40, 2012
14. American Diabetes Association. Diagnosis and classification of dia- betes mellitus. Diabetes Care 2013; 36: S67-S74, 2013
15. Yamamoto T. Definition and classification of hyperuricemia. Nihon Rinsho 66: 636-640, 2008 (in Japanese).
16. Alastair CK, Keith B, Priscilla CK, et al. The relationship between uric acid and potassium in normal subjects. Annals of the Rheumatic Diseases 37:333-338, 1978
17. Hak AE, Choi HK. Menopause, postmenopausal hormone use and se- rum uric acid levels in US women--the Third National Health and Nu- trition Examination Survey. Arthritis Res Ther 10: 116, 2008 18. Nasto LA, Fusco A, Colangelo D, et al. Clinical predictors of vertebral
osteoporotic fractures in post-menopausal women: a cross-sectional analysis. Eur Rev Med Pharmacol Sci 16: 1227-1234, 2012
19. Strasak AM, Rapp K, Hilbe W, et al. VHM&PP Study Group. Serum uric acid and risk of cancer mortality in a large prospective male co- hort. Cancer Causes Control 18: 1021-1029, 2007
20. Albanes D, Winick M. Are cell number and cell proliferation risk fac- tors for caner? J Natl cancer Inst 80: 772-774, 1988
21. Shimizu Y, Imano H, Ohira T, et al. Adult height and body mass index in relation to risk of total stroke and its subtypes: the Circulatory Risk in Communities Study (CIRCS). J stroke cerebrovas dis: in press, 2013 22. Davey SG, Hart C, Upton M, et al. Height and risk of death among
men and women: aetiological implications of associations with cardio- respiratory disease and cancer mortality. J Epidemiol Community Health 54: 97-103, 2000
23. Peck AMN. Childhood environment, intergenerational mobility, and adult health-evidence from Swedish data. J Epidemiol Community Health 46: 71-74, 1992
24. Nishioka K, Iwatani M. Hyperuricemia and atherosclerosis. Nihon Rinsho 51: 2177-2181, 1993 (in Japanese).
25. Lin KC, Tsao HM, Chen CH, et al. Hypertension was the major risk factor leading to development of cardiovascular disease among men with hyperuricemia. J Rheumatol 31:1152-1158, 2004
26. Tomita M, Mizuno S, Yamanaka H, et al. Does hyperuricemia affect mortality? A prospective cohort study of Japanese male workers. J Epidemiol 10: 403-409, 2000