Detection of Ground Deformation after the Xinmo Rock Avalanche in Sichuan, China, using 2.5-D Analysis Based on PALSAR-2 InSAR image
14
0
0
全文
(2) Hiroshi P. SATO and Masahiro CHIGIRA. landslide body beneath the sub-scarp had moved (depart-. influenced by such active tectonics (Dong et al. 2018).. ed) from the bedrock at an average rate of 30 mm/day. Historically, there have been a few earthquakes near the. and a maximum value of 145 mm five days after the rock. village (Fig. 1a), including the 1933 Diexi earthquake. avalanche, as measured by ground-based SAR (GBSAR).. (Mw 7.3; Ren et al. 2018), the 1976 Songpan–Pingwu. However, few studies reported on the ground deformation. earthquake (Mw 6.7; Jones et al. 1984), and the 2008 Wen-. after the rock avalanche using satellite SAR remote sens-. chuan earthquake (Mw 7.9; Sato and Harp 2009). These. ing data.. earthquakes are thought to cause intensive neo-tectonic. In this study, we sought to detect the ground deforma-. deformations and an abundance of source material of land-. tion using SAR interferometry (InSAR) and to determine. slides is thought to have been brought along the Min Riv-. the relationship between the detected deformations and. er and its tributaries (Intrieri et al. 2018). Recently, Ren et. the scarp and structures identified after the rock ava-. al. (2018) have specified that normal faulting of the sur-. lanche. Using this approach, the objective of this study. face rupture triggered by the 1933 Diexi earthquake oc-. was to better understand the relationship between the de-. curred along the Songpinggou Fault, whose activity is. tected deformations and the geological structures.. thought to be closely related with landslides along the Songping River, including the old Xinmo landslide. In Fig.. 2. Study area. 1b, villages that were destroyed by the 1933 Diexi earth-. Regarding the study area around Xinmo Village and the rock avalanche, we have outlined the characteristics of the. quake have been plotted (Ren et al. 2018). 2.3 Geologic and geomorphological setting. study area based on the previous studies (Dong et al.. The bedrock in the study area consists of Triassic sand-. 2018; Intrieri et al. 2018; Zhao et al. 2018).. stone (Zagunao Formation, Fig. 1b), which has been. 2.1 Location of the rock avalanche. metamorphosed to psammitic and pelitic or intercalated. As shown in Fig. 1a, the buried Xinmo Village was lo-. with slate. The Xinmo rock avalanche area was contained. cated about 170 km north from Chengdu, Sichuan Prov-. within old landslide areas (Fig. 1b), whose source area. ince, which sits on the left bank of the Songping River. was planer from top to bottom (3,100–3,900 m in elevation;. (Fig. 1b), which is a branch of the Min River located at the. Zhao et al. 2018). The white slide plane at the source of. foot of the south-facing collapsed slope. The climate is re-. the rock avalanche (ca. 3,200–3400 m) beneath the ridge. ported as having an average annual temperature of 11.0 ℃. also displayed an approximately planar rock surface. The attitude of the source plane was N 80°W/49°S,. and an average annual precipitation of 716.5 mm (Wang et. measured from 5-m-resolution ALOS World 3D topograph-. al. 2008). The relative height of the rock avalanche slope is ca.. ic data (AW3D; http://www.aw3d.jp/en/), which is quite. 1,100 m from the top of the main scarp to the village, and. consistent with the bedding attitude measured in the field. the runout distance was ca. 2,600 m; therefore, the angle. (Zhao et al. 2018). This AW3D digital elevation model. of reach (fahrboschung) was around 21° (Intrieri et al.. (DEM) was produced from ALOS/PRISM panchromatic. 2018). The village was built on gentle slope at the bottom. stereo imagery (2.5 m in resolution), which was provided. of the valley along the Songping River. The village was. by Japanese Nippon Telegraph and Telephone (NTT). completely buried in the collapsed debris, with an average. DATA and Remote Sensing Technology Center of Japan. thickness of ca. 8 m and a local maximum thickness of ca.. (RESTEC).. 32 m (Fan et al. 2017).. The source ground was bounded by cliffs on both the. 2.2 Tectonic setting. east and west, which run along a high-angle joint that. Regionally, the village was situated in the east margin of. trends north–south (NS) and aligns along the maximum. the Tibetan Plateau, an area with active tectonics that is. slope line. The ground of the cliffs is iron-stained and. reportedly a result of the collision between the Indian and. brownish, which suggests that it had already been opened. Eurasian Plates (Intrieri et al. 2018). In particular, it is lo-. before the event (Zhao et al. 2018).. cated in the Longmenshan–Minshan Fault zones, where rugged mountains with deeply incised valleys are largely ( 2 ). ─ 2 ─.
(3) Detection of Ground Deformation after the Xinmo Rock Avalanche in Sichuan, China, using 2.5-D Analysis Based on PALSAR-2 InSAR image. Fig. 1 a Study area, b Geological setting around the Xinmo rock avalanche area (hill shade was produced from 5-m-resolution AW3D DEM). Scarp, old deposit, talus based on the old landslide was interpreted from ALOS/PRISM imagery by Zhao et al. (2018). Active fault and active fault (unclear) is after Chen and Wu (2018) and Ren et al. (2018), respectively. Geology of Q: lacustrine deposits, T3Zh: Upper Triassic Zhuwo Formation, T2z: Middle Triassic Zagunao Formation, T1b: Lower Triassic Bocigou Formation, is after Fan et al. (2017). Destroyed village caused by 1933 Diexi earthquake was reported by Ren et al. (2018). Lines #1–#8 including arrayed points are correspondent to the lines in Figs. 6c and 7c.. 3. Method. the earliest obser vation date was November 18, 2017. 3.1 PALSAR-2 data sets. (Table 1), which was 147 days after the rock avalanche.. As shown in Table 1, six ALOS-2/PALSAR-2 data were. 3.2 InSAR image production. used in this study. For example, #1 in Table 1 contains. Intrieri et al. (2018) used the SqueeSAR technique to. master and slave data, which were observed on Novem-. discuss ground deformation before the Xinmo rock ava-. ber 26, 2017, and on December 24, 2017, respectively. All. lanche using the C-band (the wavelength of the micro-. data listed in Table 1 were observed after the Xinmo rock. wave was ca. 6 cm) Sentinel-1 SAR data. However, such. avalanche in StripMap mode-1 (3 m in resolution on the. coherent points are not always densely and uniformly dis-. ground).. tributed around the rock avalanche area where vegetation. The observation dates are different among the data, and. coverage is significantly more dense. This indicated that. ─ 3 ─. ( 3 ).
(4) Hiroshi P. SATO and Masahiro CHIGIRA. it was dif ficult to judge whether the vegetated slope. The filtering intensity and processing window size. around the rock avalanche area was or was not deformed. (Goldstein and Werner 1998) were 0.2 and 32 pixels, re-. after the event. This study uses L-band (the wavelength of. spectively. Next, the phase of the InSAR image was un-. the microwave is ca. 23 cm) PALSAR-2 data, which are in-. wrapped (hereinafter, unwrapped InSAR image) for the. susceptible to vegetation and tend to detect ground defor-. entire area with SNAPHU software (Chen and Zebker. mation on vegetated slopes. To obtain a rough illustration. 2002). Next, the line-of-sight (LoS) changes calculated. of the ground deformation not only in the exposed rock. from the unwrapped InSAR images were examined.. avalanche area but also around the vegetated area, a con-. 3.3 Phase offset removal from unwrapped InSAR images. ventional multi-look InSAR technique was used. To produce the InSAR images, RINC ver.0.39 software. InSAR images have some phase errors that do not re-. (Ozawa et al. 2016) was used. In Table 1, #1 shows the In-. late to the ground deformation. The errors may include. SAR image from an ascending orbit, and #2 and #3 show. the effect of speckle noise, atmospheric delay, ionospheric. the InSAR images for a descending orbit. Moreover, in. delay, foreshortening, and layover. Because the slope in-. Table 1, master and slave designations were assigned to. clination in the rock avalanche area (ca. 21°) was less than. the data observed on earlier and later dates, respectively.. all of the off-nadir angles shown in Table 1, it is thought. As a result, one ascending InSAR image and two descend-. that the effect of foreshortening and layover does not give. ing InSAR images were generated, as shown in Table 1. serious errors in the study area. However, it is difficult to. and Fig. 2. In processing the images, a 30-m-resolution. fully remove all errors. When focusing on the local area,. Global DEM (GDEM; https://gdex.cr.usgs.gov/gdex/). we found a phase offset in the unwrapped InSAR images,. was used to remove the topographic phase in the study. which is thought to be influenced by the errors (the offset. area.. is shown in Fig. 5a and explained in the unwrapped In-. We employed multi-look processing in order to reduce. SAR image section), the offset is not thought to be di-. speckle noise and ultimately improve phase accuracy, i.e.,. rectly related to the local ground deformation, and the. we performed a five-look process in azimuth and a seven-. phase offset does not appear over a wide area (e.g., not in. look process in range. This means that the resolution of. the whole study area) but is relatively localized.. the resulting InSAR image was ca. 15 m. However, in prac-. Before performing the 2.5-D analysis (see the 2.5-D. tice, it was difficult to identify the deformation in each pix-. analysis section), the phase offset should be removed. el because of the noise contained in the image, and. from the unwrapped InSAR image. Therefore, the phase. therefore, the size of interpretable deformation is over a. offset at fixed points outside the Xinmo rock avalanche. relatively wide area.. area was estimated by linear and spline interpolation (Sato. As mentioned above, we used GDEM during topograph-. and Une 2016), and the better interpolation method that. ic phase removal; however, since the GDEM resolution. agreed with the interpreted offset in the unwrapped In-. was 30 m, interpolation at a 15-m resolution was em-. SAR image was selected. When estimating the phase off-. ployed, whereas in and around the rock avalanche area. set, the fixed points must be carefully selected (the. where 5-m-resolution AW3D data were available, it was av-. distribution of these points is shown in Fig. 5a); thus, 25. eraged at a 15-m resolution, and the GDEM data were. such points were selected around the rock avalanche area.. then used to replace the AW3D data. This DEM was also. 3.4 Adjustment of the observation period between ascending and descending data. used in geocoding the InSAR images. Owing to the rigid management and control of the. As the obser vation period was different between as-. ALOS-2 orbit, the normal baseline (Bperp) of the pro-. cending and descending InSAR images (Table 1, Fig. 2),. duced InSAR image is less than 160 m (in Table 1). The. to perform 2.5-D analysis, adjusting the observation peri-. short Bperp ensured that low geometric decorrelation can. od between the two unwrapped InSAR images is suffi-. be achieved, and the unfavorable impact of DEM errors. cient. We supposed that the ground defor mation. on displacement measurement can be largely reduced. progresses not sporadically but lineally, and we thus lin-. (Dong et al. 2018).. eally or spline function-using interpolated both images. ( 4 ). ─ 4 ─.
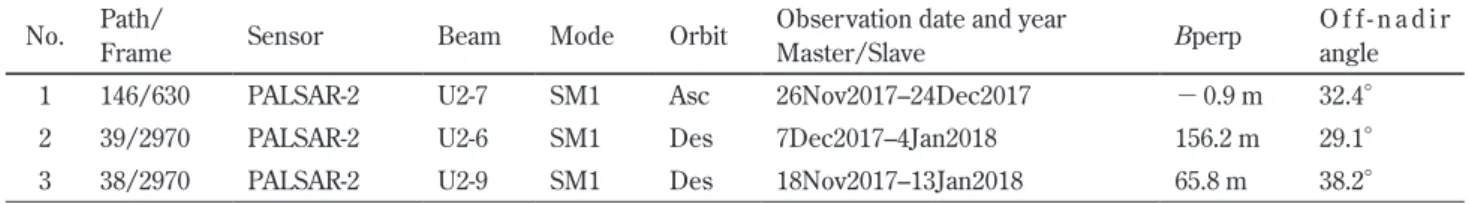
(5) Detection of Ground Deformation after the Xinmo Rock Avalanche in Sichuan, China, using 2.5-D Analysis Based on PALSAR-2 InSAR image. into the adjusted obser vation period (hereinafter, mea-. ing the unwrapped InSAR images for both ascending and. surement period).. descending. This analysis has already tried in Sato and. The measurement period of the ascending data (#1 in. Une (2016) to detect the ground deformation.. Fig. 2) was from 26 Nov to 24 Dec 2017 (28 days), and for. The geometry of the 2.5-D analysis is shown in Fig. 3.. the descending data (#2 in Fig. 2), it was from 7 Dec 2017. The combination of ascending–descending LoS intersect-. to 4 Jan 2018 (28 days). The measurement period was be-. ed at one point on the ground, and the point was also on. tween 7 Dec, 2017 and 24 Dec 2017 (17 days). Therefore,. the LoS plane (Fig. 3), which is nearly vertical in EW di-. both images were interpolated during these 17 days at the. rection. This enabled the 2D deformation description on. end of 2017.. the LoS plane, and the deformation vector was divided. The observation period of the ascending data (#1 in Fig.. into quasi-EW and up–down (UD) components, and there-. 2) was from 26 Nov to 24 Dec 2017 (28 days), and for the. fore, the 2.5-D analysis yielded deformation data with EW. descending data (#3 in Fig. 2), it was from 18 Nov 2017 to. and UD components (Fujiwara et al. 2000). However, this. 13 Jan 2018 (56 days). The measurement period was be-. analysis does not yield the NS component of the deforma-. tween 26 Nov 2017 and 24 Dec 2017 (28 days). Therefore,. tion.. both images were interpolated during these 28 days at the end of 2017.. In this study, the EW and UD components of the deformation were measured on eight lines (Fig. 1b), which. As shown in Fig. 2, two measurement periods, #1 and #2. contained arrayed points at 45 m intervals. Eight lines. (17 days) and #1 and #3 (28 days), were obtained. These. were selected to cross the entire width of the rock ava-. two periods helped in evaluating whether the same places. lanche.. were or were not deformed. Where the same places were. In Fig. 1b, line #1 is placed on the slope under the bed-. deformed, it was possible to evaluate whether the defor-. rock exposure of the main scarp, and to observe the de-. mation amount increased or decreased between the 17-. formation not only in the main scarp but also in the scarp. day and 28-day results.. in the old landslide, line #1 was extended eastward. Line. 3.5 2.5-D analysis. #2 is on the slope of the main scarp, and lines #3–#6 are in. 2.5-D analysis (Fujiwara et al. 2000) was performed us-. the transportation area (including the east and west scrap-. Table 1 InSAR images produced in this study Path/ Frame. Sensor. Beam. Mode. Orbit. Observation date and year Master/Slave. Bperp. Of f-nadir angle. 1. 146/630. PALSAR-2. U2-7. SM1. Asc. 26Nov2017–24Dec2017. − 0.9 m. 32.4°. 2. 39/2970. PALSAR-2. U2-6. SM1. Des. 7Dec2017–4Jan2018. 156.2 m. 29.1°. 3. 38/2970. PALSAR-2. U2-9. SM1. Des. 18Nov2017–13Jan2018. 65.8 m. 38.2°. No.. Note: Asc, ascending; Des, descending. Fig. 2 Observation date (solid circle) and interpolated date (hollow circle) of the InSAR image. In the figure, left, #1–#3 is correspondent to the column #1-#3 in Table 1. ─ 5 ─. Fig. 3 2.5-D analysis (Fujiwara et al. 2000). ( 5 ).
(6) Hiroshi P. SATO and Masahiro CHIGIRA. ing areas) and upper deposit area. Lines #3 and #6 were. measurement accuracy of the LoS change had a 1.5 cm. also extended westward because of the deformation ob-. root-mean-square error. Therefore, in this study, we ad-. served on the lateral scarp of the old landslide and deposit. opted 1.5 cm as the threshold (i.e., we hypothesized that a. area of the old landslide (not covered by the rock ava-. slope of more than 1.5 cm in LoS change was actually de-. lanche).. formed in the field).. Line #7 is in the lower deposits area; however, line #7. Fringe that infers the local ground deformation was. was selected so as not to cross the Songping River be-. found in Figs. 4d and e, where from blue to red appeared. cause the deformation was effected by river erosion. Line. to the west of line #2 (white open circle A). This fringe in-. #8 was situated along the right bank of the Songping River. dicated that LoS was elongated (ca. 3–5 cm) and the local. and located in the flat deposit area (2,280–2,300 m in ele-. ground deformation could be inferred. The fringe was. vation) and not on the slope. Line #8 was selected to ob-. also shown in the same place in Fig. 4f, but the masked. ser ve the deformation of deposits and to compare the. area was also included in the white open circle A in Fig. 4f.. result of the measurement in line #7 and also in the de-. At the center of line #8 in Figs. 4e and f, fringe from blue to red appeared (white open circle C) but was un-. posit area.. clear in Fig. 4d. This change (LoS, ca. 3–5 cm) indicated. 4. Result. LoS elongation, and considering that line #8 is in the lower. 4.1 InSAR image. flat deposit area, the deformation was not caused by land-. Figures 4a–c show the three InSAR images (Table 1);. slide.. Fig. 4a shows the ascending image, and Figs. 4b and c. At the center of line #7 in Fig. 4f, fringe from blue to. show descending InSAR images over the entire study. purple (small white open circle B) appeared but not wider. area. A comparison of these figures shows the location of. than the fringe in the white open circles A and C. This. buried Xinmo Village, and these three InSAR images were. fringe showed LoS elongation (ca. 2 cm), and the cause of. overlaid on the Xinmo rock avalanche area.. the deformation will be discussed later. The fringe is not. Figure 4d–f show the magnified images of Figs. 4a–c in and around the rock avalanche area, and they also show. clearly identified in Figs. 4d and e. 4.2 Unwrapped InSAR image. the eight lines which contain the arrayed points. Figure. We obtained unwrapped InSAR images #1–#3 in Table 1,. 4e shows the image without strong geometric distortion,. and Fig. 5a shows unwrapped InSAR image #1. In the fig-. but Figs. 4d and f show the image with strong geometric. ure, the units of LoS change were changed from phase. distortion outside of the rock avalanche area. Fig. 4f also. (radian) to length (cm). The black points in the figure are. shows some noise to the west of line #6 in the rock ava-. the selected fixed points used to estimate the phase offset,. lanche area. It is thus appropriate to omit this geometric. and Fig. 5b depicts the estimated phase offset by linear in-. distortion and noise in interpreting the phase change. terpolation. The unwrapped InSAR image in Fig. 5a minus. (fringe).. the estimated phase offset in Fig. 5b yielded the resulting. In Fig. 4, the area whose correlation coefficient is less. removal of phase offset, as shown in Fig. 5c. Hereinafter,. than 0.2 was masked, where they were not precisely cor-. the word unwrapped also includes the processing after. related or land conditions were significantly different be-. the obser vation period adjustment and removal of the. fore and after the rock avalanche. For example, the. phase offset.. masked area extended in the SW of Fig. 4e (outside of the. To produce unwrapped InSAR images #2 and #3, the. rock avalanche area), which indicated that the area was. offset was estimated by spline and linear interpolation, re-. not precisely correlated by the effect of foreshortening.. spectively. Figs. 6a and 7a show unwrapped InSAR image. To interpret and evaluate the fringe in Fig. 4, we re-. #1. Fig. 7a is the same as Fig. 5c, and Figs. 6b and 7b. ferred to Nishiguchi et al. (2017), who compared the LoS. show unwrapped InSAR images #2 and #3, respectively.. change of a PALSAR-2 InSAR image with field-measured. 4.3 Deformation vector by 2.5-D analysis. Global Navigation Satellite System amount of deformation. The EW and UD components of the deformation were. associated with the landslide. They reported that the. calculated by 2.5-D analysis, and the deformation vector. ( 6 ). ─ 6 ─.
(7) Detection of Ground Deformation after the Xinmo Rock Avalanche in Sichuan, China, using 2.5-D Analysis Based on PALSAR-2 InSAR image. Fig. 4 InSAR image of #1-#3 in Table 1 (cross, Xinmo Village) and magnified image. a, b, c is the InSAR image of #1, #2, and #3 in Table 1, and d, e, f is the magnified image of a, b, c, respectively. Polygon in solid gray in d, e, f is the rock avalanche area. Lines #1–#8 including arrayed points are correspondent to the lines in Figs. 6c and 7c.. ─ 7 ─. ( 7 ).
(8) Hiroshi P. SATO and Masahiro CHIGIRA. Fig. 5 Removal of estimated phase offset from the unwrapped data (Sato and Une, 2016). a, unwrapped InSAR image #1 (ascending); b, estimated phase offset for the unwrapped InSAR image; c, estimated phase offset (Fig. 5b) was removed from unwrapped InSAR image (Fig. 5a). Fig. 5c is same as Fig. 7a. Polygon in solid gray is Xinmo rock avalanche area. Lines including arrayed points are correspondent to the lines in Figs. 6c and 7c.. was also depicted on the arrayed points in the eight lines.. amount of maximum deformation in lines #1–#8 (see the. The resulting deformation vector is shown in Fig. 6c (for. location in Fig. 6). In line #2, 22 points were counted for. 17 days relating InSAR images #1 and #2) and in Fig. 7c. 17 days, and 20 points were counted for 28 days. This is. (for 28 days relating InSAR images #1 and #3). Caution. because the InSAR image (Fig. 4f) contained a masked. that EW and UD components show horizontal and vertical. area, and the amount of deformation was not calculated by. component of the vector in the figures, and see the index. 2.5-D analysis therein. In Table 2, no deformation was ob-. in the upper left portion of the figures. In Figs. 6c and 7c,. served in line #1 or lines #3–#6. To the east of line #1,. the results of 2.5-D analysis were also superimposed on. where the scarp of the old landslide is present, no defor-. the geocoded image taken from a UAV (Fan et al. 2017;. mation was measured at the end of 2017. Furthermore, to. Fig. 3b) on 26 July 2017, two days after the rock ava-. the west of lines #3 and #6, which is covered with vegeta-. lanche.. tion, no deformation was measured at the end of 2017 on. Table 2 shows the number of measurement points and. the lateral scarp of the old landslide and deposit area of. Table 2 Deformation amount on the measurement points Measurement period. The number of points (deformation > 1.5 cm). Maximum amount (cm). The number of all points. Line. 17 days. 0. 1.2. 31. #1. 3. 3.6. 22. #2. 0. 0.8. 32. #3. 0. 0.7. 33. #4. 0. 1.1. 33. #5. 0. 1.1. 44. #6. 0. 1.1. 22. #7. 5. 2.8. 19. #8. 28 days. 0. 1.5. 30. #1. 3. 5.7. 20. #2. 0. 1.4. 31. #3. 0. 1.3. 33. #4. 0. 1.2. 33. #5. 0. 1.4. 44. #6. 21. 2.0. 37. #7. 16. 5.3. 19. #8. Note: Measurement period is same as the period shown in Figs. 6 (17 days) and 7 (28 days). ( 8 ). ─ 8 ─.
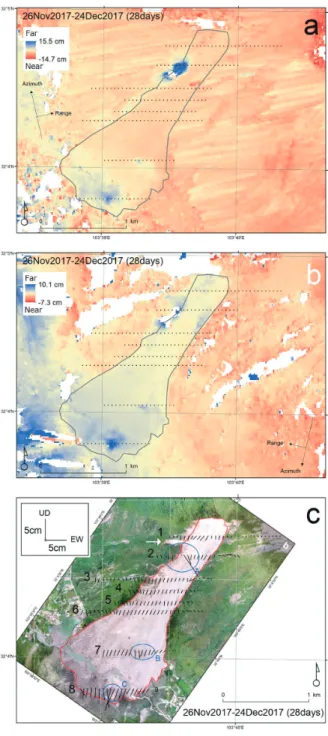
(9) Detection of Ground Deformation after the Xinmo Rock Avalanche in Sichuan, China, using 2.5-D Analysis Based on PALSAR-2 InSAR image. Fig. 6 Result of 2.5-D analysis between 7 Dec 2017 – 24 Dec 2017 (17 days), using unwrapped InSAR images #1 and #2 in Table 1. a, unwrapped InSAR image #1 (ascending); b, unwrapped InSAR image #2 (descending); c, result of 2.5-D analysis, UD and EW component of deformation, respectively. Back image is from Fan et al. (2017; Fig. 3b).. Fig. 7 Result of 2.5-D analysis between 26 Nov 2017 – 24 Dec 2017 (28 days), using unwrapped InSAR image #1 and #3 in Table 1. a, unwrapped InSAR image #1 (ascending); b, unwrapped InSAR image #3 (descending); c, result of 2.5-D analysis, UD and EW component of deformation, respectively. Back image is from Fan et al. (2017; Fig. 3b).. the old landslide.. spectively. The maximum amount of deformation was 3.6. For the 17-day measurement period, the number of measurement points whose deformation amount >1.5 cm. cm in line #2, and the deformation points are included in areas (white open circles) A and C in Fig. 6c.. (hereinafter, deformation points) is presented in Table 2,. For the 28-day measurement period, the numbers of de-. and it was found to be three and five in lines #2 and #8, re-. formation points were 3, 21, and 16 in lines #2, #7, and #8,. ─ 9 ─. ( 9 ).
(10) Hiroshi P. SATO and Masahiro CHIGIRA. respectively, as shown in Table 2. The deformation points in lines #2, #7, and #8 are included in areas (white open circles) A, B, and C in Fig. 7c. In the next section, we will discuss the characteristics of the deformation points in area C, and areas A and B will be described in the Discussion section. 4.4 Deformation in area C As shown in Table 2, the number of deformation points increased from 5 to 16 in line #8 for 17 and 28 days, respectively, and the maximum amount of deformation increased from 2.8 to 5.3 cm for 17 and 28 days, respectively. Comparing the deformation vector in area C in Fig. 6c and Fig. 7c, the characteristics of the deformation amount are more remarkable in area C than in neighboring locations. Given the remarkable deformation vectors appearing in area C continuously for 17 and 28 days, the deformation occurred in area C, though it seems that the deformation amount itself is overestimated in line #8 for the 28-day period. By interpreting the contour map depicted in Fan et al. (2017, Fig. 8), this deformation occurred in the deposit area, and deposit compaction is thought to have cause the downward-dominant deformation.. 5. Discussion This section focuses on the ground deformation on the slope under the bedrock exposure of the main scarp related to line #1 and in the main scarp (area A) and lower deposits area (area B) related to lines #2 and #7, respectively (Figs. 6c and 7c). 5.1 Deformation on the slope under the bedrock exposure of the main scarp Line #1 was assigned to the slope under the bedrock exposure of the main scarp of the Xinmo rock avalanche, and Table 2 shows that the number of deformation points is zero for the 17- and 28-day periods, respectively. The maximum amount of deformation was 1.5 cm (1.0 cm eastward and 1.1 cm downward), as shown in vector D in Fig. 8a. Because no point in line #1 exceeded the threshold of 1.5 cm, it is not possible to conclude that the bedrock beneath the exposure of the main scarp is widely deformed. Zhao et al. (2018) indicated that there are buckling folds with fractures and warp by buckling on the slope under the bedrock exposure of the main scarp in the field. However, Fan et al. (2017) stated that the GBSAR monitoring ( 10 ). Fig. 8 Result of 2.5-D analysis (partially magnified Figs. 6c or 7c). Back image is from Fan et al. (2017 ; Fig. 8b). In the figure, Fan et al. (2017) classified landform as I: main scarp, II: transportation, III, deposits area, VI: west sliding body. a Deformation vectors on the slope under the bedrock exposure of main scarp, magnified (line #1) Fig. 7c. Measurement period is 26 Nov 2017 – 24 Dec 2017 (28 days). b Deformation vectors, magnified area A (line #2) in Fig. 6c. Measurement period is 7 Dec 2017 – 24 Dec 2017 (17 days). Ellipsoid #1 is the EW trending sub-scarp (Zhao et al. 2018) yielded after the rock avalanche, and ellipsoid #2 is in the central valley of main scarp. c Deformation vectors magnified (line #7) Fig. 7c. Measurement period is 26 Nov 2017 – 24 Dec 2017 (28 days). Ellipsoid shows bedrock exposure on the minor scarp.. ─ 10 ─.
(11) Detection of Ground Deformation after the Xinmo Rock Avalanche in Sichuan, China, using 2.5-D Analysis Based on PALSAR-2 InSAR image. data did not show a significant displacement on the slope. fied as the deformation amount of 5.7 cm (3.2 cm eastward. for six days from June 29, 2017, our 2.5-D analysis also did. and 4.7 cm downward) in Fig. 7c, which was the maxi-. not reveal a significant displacement on the slope, and it is. mum deformation amount for the 28-day period (i.e., the. therefore thought that this stable condition on the slope. amount increased). These deformation vectors represent. under the bedrock exposure of the main scarp was at least. the deformation of the edge of the landslide body at the. maintained at the end of 2017.. 135 m EW width. Moreover, it is thought that deforma-. 5.2 Deformation in area A. tion amount was too large to give high coherence in Fig.. As Zhao et al. (2018) stated, an EW trending sub-scarp. 7c for the location assigned to vectors E and F in Fig. 8b.. was yielded after the Xinmo rock avalanche. They indicat-. Fan et al. (2017) stated that the maximum amount of de-. ed that there was a landslide body beneath the sub-scarp. formation was 145 mm, which departed from the bedrock. on the western flank, and Fan et al., 2017 classified the. for six days beginning on June 29, 2017. They also sug-. landslide body (debris mass) as a west-sliding body (land-. gested that it cannot be excluded in the evaluation of fur-. form VI). The sub-scarp is shown as a white arrow be-. ther events or progressive failure more generally.. tween lines #1 and #2 in Figs. 6c and 7c. Fig. 8b indicated. Therefore, our measurement result agreed with their. the magnified Fig. 6c in area A, and the sub-scarp is delin-. measurements and estimations.. eated by black dot ellipsoid #1. This area was a focus of. In Fig. 7c, the central valley floor of the main scarp is. rescue teams to ensure the safety of local people near the. delineated by ellipsoid #2, which is immediately east of. rock avalanche deposition area and to prevent a second-. vector G, and no deformation was measured. As a result,. ary disaster (Fan et al. 2017).. the bedrock was not deformed there.. The five measurement points from the westernmost to. 5.3 Deformation in area B. the fifth point in line #2 were assigned to the landslide. At the lower deposits area of the Xinmo rock avalanche,. body (Figs. 6c and 7c), and the amount of deformation at. deformation was detected. Figure 8c shows the deforma-. the fifth point was 0.9 cm in Fig. 6c and 1.5 cm in Fig. 7c. tion vectors for 28 days, and significant deformation vec-. (i.e., the amount increased). The fifth point showed vec-. tors were found as H, I, and J in Fig. 8c. The deformation. tor K in Fig. 8b, which was just west of vector E in Fig. 8a.. amount was 1.7 cm (0.0 cm eastward and 1.7 cm down-. Fan et al. (2017) did not clearly discuss the deformation. ward), 2.0 cm (0.2 cm eastward and 2.0 cm downward),. amount of the landslide body itself, though according to. and 1.6 cm (0.6 cm westward and 1.6 cm downward), re-. the 2.5-D analysis, the landslide body appeared to be sta-. spectively. Deformation vectors H and J slightly exceeded. ble at least at the end of 2017. Fan et al. (2017) suggested. the threshold of 1.5 cm, and the deformation vector in. that the landslide body was stabilized after the rock ava-. area B tends to record downward remarkably, different. lanche as it encountered a natural obstacle (N 46°E/47°. from the deformation vectors in area A. According to Su et al. (2017; Fig. 5), the deposit thick-. NW anti-inclined plane). However, at the eastern edge of the landslide body fac-. ness is ca. 15 m and more around area B; therefore, it is. ing the central valley of the main scarp, significant defor-. thought that the deformation vectors in Fig. 8c were pri-. mation vectors were found, depicted as E, F, and G in Fig.. marily caused by the compaction of debris deposits. Fan. 8b. The amounts of deformation at these points were 3.6. et al. (2017) identified a minor scarp (2,400–2,480 m in el-. cm (1.8 cm eastward and 3.1 cm downward), 3.1 cm (2.1. evation) above area B, where bedrock was denuded. In. cm eastward and 2.3 cm downward), and 3.6 cm (2.1 cm. the same minor scarp, Zhao et al. (2018) also reported. eastward and 2.9 cm downward), respectively, with 3.6 cm. small open fractures in the bedrock. If such fractures wid-. being the maximum amount of deformation in line #2 for. ened and distorted the bedrock, the deformation vectors. 17 days and 5.7 cm for 28 days. Vectors E and F were also. in Fig. 8c may have been caused by the bedrock under the. identified in Fig. 6c, but because the coherence assigned. ground. However, the main scarp and the transportation. to the measurement points was less than 0.2 (masked. and upper deposit areas did not indicate deformation. No. area), the deformation amount of vectors E and F was not. deformation was measured on the lateral scarp of the old. calculated by 2.5-D analysis in Fig. 7c. Vector G is identi-. landslide or the deposit area of the old landslide. Further-. ─ 11 ─. ( 11 ).
(12) Hiroshi P. SATO and Masahiro CHIGIRA. more, line #8 also indicated the deformation in the flat de-. et al. (2017) attributed the stability of the landslide body to. posit area, and therefore, the deformation in line #7 was. a natural obstacle (N 46°E/47°NW anti-inclined plane),. attributed to debris deposit compaction.. the eastern edge of the landslide body was deformed in the 135 m EW width. Though bedrock was covered with a. 6. Conclusion. thin layer of debris and it is not possible to observe and. Three InSAR images were produced from six PALSAR-2. interpret the bedrock fractures by field survey or on the. data obtained after the Xinmo rock avalanche. The PAL-. photo images, our measurements revealed no deforma-. SAR-2 data observed using the L-band (the wavelength of. tion in the central valley of the main scarp located to the. the microwave was ca. 23 cm) are not skewed by vegeta-. east of the landslide body.. tion cover, and therefore, they are suitable in detecting the. Not only the main scarp but also the transportation and. deformation of slopes covered with vegetation in humid. upper deposit areas did not indicate deformation, and no. climate like those in the Asian region. The earliest obser-. deformation was measured on the lateral scarp of the old. vation date was November 18, 2017, 147 days after the. landslide and deposit area of the old landslide.. rock avalanche. Then, the three InSAR images (one is ob-. In area B, the analysis revealed that the lower deposit. served on ascending, and two are observed on descend-. area was deformed at a maximum amount of 2.0 cm. On. ing orbits) were produced. Clear fringe from blue to red. the bedrock exposed on the minor scarp above area B,. was identified in and out of the rock avalanche area (in ar-. Zhao et al. (2018) observed small open fractures in the. eas A and C in Figs. 4d and f, respectively), but fringe at. bedrock. If the hidden bedrock under the debris deposit. the lower deposits area (in area B in Fig. 4d) was unclear.. also had such fractures widen and distorted, our analysis. Once unwrapped InSAR images were obtained, two. might have detected deformation caused by the hidden. combinations of ascending–descending unwrapped InSAR. bedrock gravitational deformation. However, considering. images were obtained for 17- and 28-day periods.. that the deposit thickness was 15 m and thicker around. 2.5-D analysis using the combination of ascending–descending unwrapped InSAR images yielded the EW and. area B, the deformation was not caused by bedrock distortion but by compaction of debris deposits.. UD components of deformation, which revealed that the. The 2.5-D analysis did not give the NS component of the. slope under the bedrock exposure of the main was not de-. deformation, and it did not supply the basic information. formed (stable) at the end of 2017, even where buckling. for the NS direction helpful in modeling the deformation. from fracture and warping from buckling on the slope. process for the rock avalanche, like Zhao et al. (2018).. were identified in the field after the rock avalanche. How-. However, the analysis could reveal the location of non-de-. ever, it is important to monitor the main scarp from the. formed (stable) and deformed areas. Specifically, the im-. perspective of whether the deformation amount of 1.5 cm. portant deformation area at the end of 2017 was identified. of vector D (Fig. 8a) at its maximum did or did not in-. on the eastern edge of the landslide body on the west. crease and whether the deformation was propagated. flank of the rock avalanche. The meritorious characteris-. through neighboring measurement points or not.. tics of satellite SAR remote sensing data are that they are. The analysis also revealed that the ground deformation. repeatedly observed and were archived over a wide area,. was measured in area A, B, and C in the rock avalanche. and they can be used to mitigate second and third slope. area. Because area C is located in the flat deposit area on. disasters after the rock avalanche. Thus, this type of satel-. the right bank of the Songping River, the deformation is. lite SAR data will hopefully be used in monitoring this. caused by debris compaction.. rock avalanche area and others in the future.. In area A, the analysis revealed that the landslide body, which was composed of debris mass, was not deformed (stable) at the end of 2017, but the east edge of the landslide body was deformed downward and eastward at maximum amounts of 3.6 (vector E in Fig. 8b) and 5.6 cm for the 17- and 28-day period at the end of 2017. Though Fan ( 12 ). Acknowledgement This study was supported by KAKEN 17H02973, Principal Researcher, Prof. Chigira, DPRI, Kyoto Univ. ALOS-2/ PALSAR-2 data used in this study were provided by JAXA in the framework of JAXA’s Landslide Disaster Working Group and PIXEL (PALSAR Interferometry Consortium to Study our. ─ 12 ─.
(13) Detection of Ground Deformation after the Xinmo Rock Avalanche in Sichuan, China, using 2.5-D Analysis Based on PALSAR-2 InSAR image. Evolving Land surface) under a cooperative research contract with ERI, Univ. of Tokyo. The ownership of PALSAR and. PALSAR-2 data belongs to METI (Ministry of Economy, Trade and Industry, Japan) and JAXA.. References Chen CW, Zebker HA (2002): Phase unwrapping for large SAR interferograms: Statistical segmentation and generalized network models. IEEE Transactions on Geoscience and Remote Sensing 40: 1709-1719. Chen K-T, Wu J-H (2018): Simulating the failure process of the Xinmo landslide using discontinuous deformation analysis. Engineering Geology 239: 269-281. Chigira M, Xiyong W, Siyuan Z (2017): Xinmocun Rock avalanche induced by rainfall in Songping area, Maoxien, Sichuan, China, 24 June 2017. http://www.dpri.kyoto-u. ac.jp/news/9380/ Dong J, Zhang L, Li M, Yu Y, Liao M, Gong J, Luo H (2018): Measuring precursor y movements of the recent Xinmo landslide in Mao Countr y, China with Sentinel-1 and ALOS-2 PALSAR-2 datasets. Landslides 15: 135-144. Fan X., Xu Q, Scaringi, G, Dai L, Li W, Dong X, Zhu X, Pei X, Dai K, Havenith H-B (2017): Failure mechanism and kinematics of the deadly June 24th 2017 Xinmo landslide, Maoxian, Sichuan, China. Landslides 14: 2129-2146. Fujiwara S, Nishimura T, Murakami M, Nakagawa H, M. Tobita M, Rosen PA (2000): 2.5-D surface deformation of M6.1 earthquake near Mt Iwate detected by SAR interferometry. Geophysical Research Letters 27: 2049-2052. Goldstein and Werner CL (1998): Rader interferogram filtering for geophysical application. Geophysical Research Letters, 25: 4035-4038. Hungr O, Leroueil S, Picarelli L (2014): The Varnes classification of landslide types, an update. Lnadslides 11: 167-194. Intrieri E, Raspini F Fumagali A, Lu P, Conte SD, Farina P, Allievi J, Ferretti A, Casagli N (2018): The Maoxian landslides as seen from space: detecting precursors of failure with Sentinel-1 data. Landslides 15: 123-133. Jones LM, Han W, Hauksson E, Jin A, Zhang Y, Luo Z (1984): Focal mechanism and aftershock locations of the Songpang earthquakes of August 1976 in Sichuan, China. Journal of Geophysical Research: Solid Earth, 89 (B9): 76977707.. Nishiguchi T, Tsuchiya S, Imaizumi F (2017): Detection and accuracy of landslide movement by InSAR analysis using PALSAR-2 data. Landslides, 14: 1483-1490. Ozawa T, Fujita E, Ueda H (2016): Crustal deformation associated with the 2016 Kumamoto Earthquake and its effect on the magma system of Aso volcano. Earth, Planets and Space, 68: 186. Ren J, Xu X, Zhang S, Yeats RS, Chen J, Zhu A (2018): Surface rupture of the 1933 M7.5 Diexi earthquake in eastern Tibet: implications for seismogenic tectonics. Geophysical Journal International, 212: 1627-1644. Sato HP , Harp EL (2009): Interpretation of earthquake-induced landslides triggered by the 12 May 2008, M7.9 Wenchuan ear thquake in the Beichuan area, Sichuan Province, China using satellite imagery and Google Earth. Landslides, 6: 153–159. Sato HP, Une H (2016): Detection of the 2015 Gorkha earthquake-induced landslide surface deformation in Kathmandu using InSAR images from PALSAR-2 data. Ear th, Planets and Space, 68: 47. Sato HP (2017): InSAR image interpretation on the collapsed slope in 2017, Xinmo Village, Sichuan Province, China. Proceedings of the General Meeting of the Association of Japanese Geographers, P024. https://doi.org/10.14866/ ajg.2017a.0_100087 (in Japanese with English abstract) Su LJ, Hu KH, Zhang WF, Wang J, Lei Y, Zhang CL, Cui P, Pasuto A, Zheng QH (2017): Characteristics and triggering mechanism of Xinmo landslide on 24 June 2017 in Sichuan, China. Journal of Mountain Science 14: 1689-1700. Wang LS, Yang LZ, Li TB, Xu XN, Wang XQ, Cui J (2008): Diexi earthquake-induced landslide, Min River, Sichuan Province (1933). In: Huang R, Xu Q (eds) Catastrophic landslide in China 57-93. Science Press, Beijing ISBN: 978703223500 (in Chinese) Zhao S, Chigira M, Wu X (2018): The Xinmo rock avalanche preceded by gravitational slope deformation in Diexi, Maoxian, Sichuan, China. Engineering Geology 246: 187-197.. ─ 13 ─. ( 13 ).
(14)
(15)
図


+2

関連したドキュメント
The denoising results for pixels near singularities are obtained by nonlocal means in spatial domain to preserve singularities while the denoising results for pixels in smooth
Kaplick´ y shows H¨ older continuity of velocity gradients and pressure for (1.1) with p ∈ [2, 4) under no slip boundary conditions. Based on the same structure of the proof and
Since the data measurement work in the Lamb wave-based damage detection is not time consuming, it is reasonable that the density function should be estimated by using robust
The explicit treatment of the metaplectic representa- tion requires various methods from analysis and geometry, in addition to the algebraic methods; and it is our aim in a series
We have avoided most of the references to the theory of semisimple Lie groups and representation theory, and instead given direct constructions of the key objects, such as for
Ground Application: Make a broadcast application of Impose Herbicide in a minimum of 2 gallons of spray per acre using ground application equipment. Calibrate the sprayer to
Fig.5 The number of pulses of time series for 77 hours in each season in summer, spring and winter finally obtained by using the present image analysis... Fig.6 The number of pulses
Amount of Remuneration, etc. The Company does not pay to Directors who concurrently serve as Executive Officer the remuneration paid to Directors. Therefore, “Number of Persons”
