Evaluation Methods for the Measurement of Lower Leg Edema in Healthy Young
Adults
Masahiro Nishimura,* Toshiaki Kato* and Sho Onodera†
*Division of Medical Science in Sports and Exercise, Department of Medical Education, School of Medicine, Faculty of Medicine, Tottori University, Tottori 680-8550, Japan, †Department of Health and Sports Science, Faculty of Health Science and Technology, Kawasaki University of Medical Welfare, Kurashiki 701-0193, Japan
ABSTRACT
Background In recent years, objective quantitative evaluations have become particularly important. Both qualitative and quantitative evaluations are also avail-able for edema. It is thought that the technical problem of quantitative evaluation can be solved by using a simple and reproducible method. Several studies have evaluated various methods for measuring edema. Limitations, such as weaknesses, measurement com-plexity, and errors, have been identified. Therefore, this study aimed to consider a simple and effective measure-ment method for the quantitative evaluation of edema.
Methods This study was a prospective, observational study. The subjects were 15 healthy adults (2 male and 13 female). Measurements were performed on the subjects’ right lower leg once in the morning and once in the afternoon, with a minimum interval of 4 hours.
Results The actual volume of the lower leg was correlated with all indices except the ultrasonic echo findings for subcutaneous tissue. The intra-subject and inter-subject reliabilities for the indices using digital im-ages were very high. The lower leg volume was greater significantly in the afternoon from the morning.
Conclusion The leg circumference was measured by utilizing a tape, while the width and volume were measured by utilizing digital imaging suitable for quan-titatively evaluating edema. Furthermore, swelling of the lower leg with time can occur in the absence of daily exercise.
Key words circumference; diagnostic imaging; ede-ma; leg
Edema is a condition characterized by the accumulation of excess interstitial fluid in the subcutaneous tissue; it can occur as a symptom of many differential diseases. Edema can be broadly classified as generalized edema or localized edema according to the location and as pitting or non-pitting edema according to its character-istics.1 Generalized edema can be caused by
abnormali-ties in the kidney, heart, liver, or endocrine glands, while localized edema can be caused by obstructed venous or lymphatic flow or by inflammation.1 Edema
is a common symptom, but it can be caused by a wide range of conditions such as deep vein thrombosis and hereditary angioedema, some of which require immedi-ate treatment.
In recent years, testing methods for lymphedema have advanced. It is now possible to verify its definitive diagnosis and severity along with the appropriateness of its management method and effectiveness of treat-ment.2, 3 Medical examinations for edema include
nota-tion of a patient’s history, visual inspecnota-tion, palpanota-tion, circumference measurement, and volume measurement. The water displacement method is the gold standard technique for measuring edema of the limb. This method is definitive for volume measurement based on Archimedes’ principle; however, it has some limita-tions.4, 5 There are both technical and hygiene concerns
associated with this method5–7; for example, technical
issues regarding the size of the water tank to soak the upper or lower limbs and in adequately collecting the displaced water during measurement. Therefore, the volume is calculated by measuring the circumference of the limb using a tape. Another method involves performing edema evaluation at the measurement site. Other methods include the use of a Perometer5 and
bioimpedance.8 To date, the measurement of volume
using the water displacement method and that of limb circumference using a tape6, 9–11 have been investigated
as methods for evaluating edema. Weaknesses have been identified from the findings of previous studies, including the complexity of the measurement process and the influence of measurement errors.10, 12 However,
few studies have compared and examined the different measurement methods.13 In recent years, objective Corresponding author: Masahiro Nishimura, PhD
mnishimura@tottori-u.ac.jp Received 2020 July 29 Accepted 2020 September 9 Online published 2020 November 24
Abbreviations: AC, ankle circumference; AWB, ankle width from the back; FOE, figure of eight; LAW, lateral ankle width; LLV, lower leg volume; MC, maximum circumference; MLW, maximum lower leg lateral width; MWB, maximum lower leg width from the back; STA, skin thickness at the ankle; STM, skin thickness at the maximum
quantitative evaluations have become particularly im-portant.5 Both qualitative and quantitative evaluations
are also available for edema. It is thought that the tech-nical problem of quantitative evaluation can be solved by using a simple and reproducible method. Therefore, to clarify the measurement method suitable for the quantitative evaluation of edema, the following were our objectives. Our primary objective was to examine the relationship between the actual lower leg volume and circumference, measured using a tape; determine the thickness of the skin using the echo method; measure the lower leg width using digital images; and calculate the lower leg volume based on the lower leg width mea-sured on digital images. Our secondary objective was to examine the relationship between the leg circumference and length as an indicator to establish a simplified and valid measurement method. Our tertiary objective was to compare the swelling before and after using the mea-surement of the actual lower leg volume.
SUBJECTS AND METHODS Subjects
The subjects were 15 healthy (2 male and 13 female) adults. Measurements were taken twice a day (once in the morning and once in the afternoon, with a mini-mum of 4 hours between measurements). This study was conducted with the approval of the Medical Ethics Committee of Tottori University (approval number 18A163). The purpose of the research, the methods used, and research participation and withdrawal condi-tions were fully explained to participants, and written consent was obtained from each participant. The evalu-ation of edema-measuring methods was conducted after confirming that the exclusion criteria were not violated after obtaining consent.
Procedure
Measurements taken included the lower leg circumfer-ence using a tape, subcutaneous tissue thickness (from the epidermis to the fascia) using ultrasonic echo, and lower leg width using images taken with a digital camera. Subsequently, volume was measured by placing the lower leg into a water tank and then measuring the volume displaced, considering the influence of water pressure on the lower leg.
Measurements
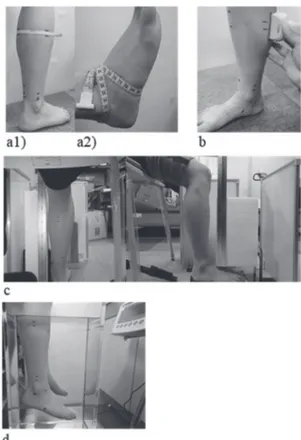
Figure 1 shows the experimental setting according to each method of measurement.
The circumference of the lower leg was measured at two points, the maximum circumference of the lower leg (MC) and the circumference of the ankle (AC), while
ensuring that the subject was in a sitting position with the ankle joint at a 90° angle. Both measurement points were marked with a pen. A tape measure (Abbott Japan LLC., Tokyo, Japan) was used to take measurements at these two locations. The landmarks were marked with a pen above and below the position of the tape (12-, 3-, 6-, and 9-o’ clock positions) during the first measurement. The second, third, and afternoon measurements were taken according to the landmarks, with care to squeeze the skin.
The circumference of the ankle joint was also measured using the figure of eight (FOE) method.6, 9, 10
Landmark measurements were marked at the following places: between the tibialis anterior tendon and lateral malleolus, navicular tuberosity, at the base of the fifth metatarsal, at the distal tip of the medial malleolus, and at a point on the distal tip of the lateral malleolus. The measurement started from between the tibialis anterior muscle and the malleolus. The FOE method6, 9, 10 was
used to calculate the average value of three length measurements, starting from the tibialis anterior muscle
Fig. 1. Experimental settings according to each measurement method. a1): Measurement of circumference, a2): measurement of FOE, b: measurement of skin thickness using the ultrasonic echo method, c: photographing the lower leg using a digital camera, d: measurement of lower leg volume using the water displacement method.
up to the lateral malleolus, passing through all positions sequentially, and returning to the beginning.
Skin thickness was measured using the ultrasonic echo method with a superficial high-frequency linear probe (Ultrasound Diagnostic Equipment; Canon Medical Systems Corporation, Tochigi, Japan), with the subject in a sitting position with the ankle joint at 90°.
The measurements were taken in the long-axis direction so that the line marked when measuring the circumference was at the center of the probe. The maxi-mum and ankle measurement points were located above the medial gastrocnemius (measuring skin thickness at the maximum point, or STM) and above the Achilles tendon (measuring skin thickness at the ankle point, or STA). The probe position was marked with a pen so that measurement positions remained consistent.
To measure leg width, images were taken from the back of the frontal plane and the outside of the sagittal plane using a digital camera (Compact digital camera, Olympus Corporation, Tokyo, Japan) while maintaining an ankle joint angle of 90°. Subsequently, computer analysis was performed using the open-source image analysis software ImageJ (NIH, Bethesda, MD).14 The
image resolution of the digital camera was 12 mega-pixels. The distance between each leg and the camera lens was 500 mm, and the height of the center of the lens was 350 mm.15, 16 In previous studies,15, 16 a slight
distortion was seen at the edges of each image. This was not considered a limitation in our study; any distor-tion displayed was consistent across all images, and therefore, all images were assessed under comparable conditions. A JIS standard ruler was placed at the center of the lower leg and viewed from each direction, and a 1-cm measurement was used as a scale on the analysis screen to perform depth correction. The upper line marked by the ankle circumference (maximum lower leg width from the back, or MWB, and maximum lower leg lateral width, or MLW) was used as a reference, and the horizontal width (ankle width from the back, or AWB, and lateral ankle width, or LAW) was analyzed within the line measuring the maximum leg circumfer-ence. Using these measured values, the volume of the truncated cone was calculated every 5 cm; the estimated back volume, lateral volume from both directions, and average volumes were also calculated.
Lower leg volume (LLV) was measured by the water displacement method using Archimedes’ prin-ciple. First, a water tank (Experimental acrylic water tank [special order] W200 × D300 × H500 mm, Takei Scientific Instruments Co., Ltd., Niigata, Japan) was placed on a general-purpose electronic balance (GP-61K, A&D Company Limited, Tokyo, Japan), and water
temperature was set to 30°C at 26,000.0 g. The mass on the balance was tared to zero, and leg mass was mea-sured when the subject put his/her lower leg in the water tank. This method of measuring the mass without the overflow of water from the tank was based on previous study.7 The mass was corrected by the water
tempera-ture immediately after measurement and then converted to a volume measurement. An electronic balance with a high weighing capacity of 61 kg, minimum display of 0.1 g, and linearity of ± 0.5 g was used. The subject sat down along a designated line on the lifting bed. The examiner operated the lifting bed in such a way that the marked point on the leg (marked when the maximum leg circumference of the subject was measured) was completely immersed. When the foot was immersed in the water tank, care was taken to ensure that it did not touch the wall. All measurements were performed on the right lower leg.
Statistical analysis
Data are shown as means ± standard deviations. A paired t-test was used for the before-and-after compari-son of all measurements, and the relationships between all measurements were analyzed using Pearson’s cor-relation coefficient. The intraclass corcor-relation coefficient (ICC) was determined for all measurement methods. Statistical analysis was performed using SPSS Statistics 24 (IBM, Armonk, NY), and the significance level was set to < 0.05.
RESULTS
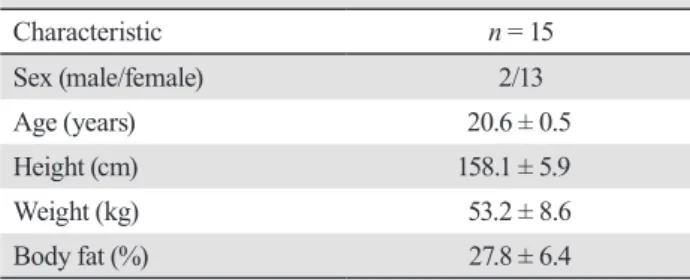
The characteristics of all subjects included in this study are shown in Table 1. The average age of the subjects was 20.6 ± 0.5 years. The LLVs calculated from the mass of the lower limbs had strong correlations with AC (r = 0.763, P < 0.001), FOE (r = 0.865, P < 0.001), AWB (r = 0.771, P < 0.001), back volume (r = 0.726, P < 0.001), lateral volume (r = 0.846, P < 0.001), and aver-age volume (r = 0.805, P < 0.001). Its correlations with MC (r = 0.611, P < 0.001), MLW (r = 0.573, P < 0.05),
Table 1. Characteristics of patients
Characteristic n = 15 Sex (male/female) 2/13 Age (years) 20.6 ± 0.5 Height (cm) 158.1 ± 5.9 Weight (kg) 53.2 ± 8.6 Body fat (%) 27.8 ± 6.4
and LAW (r = 0.680, P < 0.001) were moderate, whereas weak with MWB (r = 0.496, P < 0.01) (Fig. 2). MC also had a significant correlation with MWB (r = 0.943, P < 0.001), a strong correlation with AC (r = 0.794, P < 0.001), and moderately strong correlations with FOE (r = 0.643,
P < 0.001) and MLW (r = 0.639, P < 0.001). Likewise,
AC had a significant correlation with LAW (r = 0.960, P < 0.001) and strong correlations with FOE (r = 0.877, P < 0.001) and AWB (r = 0.716, P < 0.001).
The ICC (1, 1) was 0.99–1.0 for all indices, and the
Fig. 2. Diagram showing the correlations of lower leg volume. Correlation between LLV and a: MC, b: AC, c: FOE, d: STM, e: STA, f: MWB, g: MLW, h: AWB, i: LAW, j: Back Volume, k: Lateral Volume, and l: Average Volume.
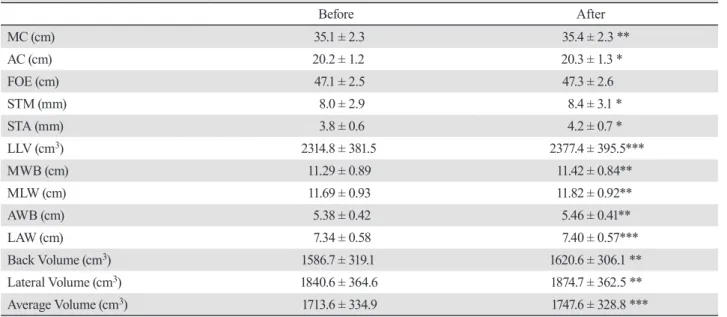
ICC (2, 1) was 0.99 for measurement of the leg width using digital images. ICC (1,1) indicates the intra-subject reliability, whereas ICC (2, 1) indicates the inter-subject reliability. The before-and-after comparison data of all indices are shown in Table 2. The values of LLV were significantly higher in the afternoon than in the morning.
DISCUSSION
LLV correlated to all indices except STM and STA using the echo method, suggesting that these indices except STM and STA may reflect LLV, although the accuracy may differ. The intra-subject reliability in all indices and inter-subject reliability for the indices using digital images were very high and were evaluated to be great17 and deemed accurate. LLV measurement by
the water displacement method was based on previous research, and the method of measuring volume without overflow of water was used to simplify the measur-ing method.7 Therefore, this study also confirmed
that repeated measurements can be easily performed. However, in some instances, LLV could not be mea-sured using water displacement due to the following challenges: the weights of the water tank and water must be measured initially; a high-accuracy weighing scale that can measure in grams is required, but such a scale is expensive; some subjects’ legs could not be immersed in water owing to skin inflammation, and therefore, results could not be obtained. Although the
water tank used in this study had an optimal size that is required for immersing one lower leg, size was one of the problems associated with this procedure because the weight of the water tank containing water was more than 26 kg.
The maximum circumference of the lower leg, ankle circumference measured using the tape, and ankle circumference calculated using the FOE method highly correlated with the lower thigh volume, and it was considered that the swelling could be evaluated. The relationship between the FOE method and LLV was similar to that reported in previous studies.6 In addition,
it was reported that the measurement error was large when the circumference was calculated using a tape.12
Therefore, in this study, to minimize the error due to de-viation of the measurement position of MC and AC, the landmark was marked with a pen above and below the measurement position of the tape (12-, 3-, 6-, and 9-o’ clock positions) when measured for the first time. The second, third, and afternoon measurements were taken according to the landmark and with care not to press the skin. Thus, it was possible to reduce the measurement error.
The measurements from ultrasonic echo method in this study did not correlate with actual lower limb volume. Our data showed that it might be challeng-ing to use the ultrasonic echo method to evaluate the degree of orthostatic edema with variations in the skin thickness of the lower leg in young healthy adults.
Table 2. Before-and-after comparison for each index
Before After MC (cm) 35.1 ± 2.3 35.4 ± 2.3 ** AC (cm) 20.2 ± 1.2 20.3 ± 1.3 * FOE (cm) 47.1 ± 2.5 47.3 ± 2.6 STM (mm) 8.0 ± 2.9 8.4 ± 3.1 * STA (mm) 3.8 ± 0.6 4.2 ± 0.7 * LLV (cm3) 2314.8 ± 381.5 2377.4 ± 395.5*** MWB (cm) 11.29 ± 0.89 11.42 ± 0.84** MLW (cm) 11.69 ± 0.93 11.82 ± 0.92** AWB (cm) 5.38 ± 0.42 5.46 ± 0.41** LAW (cm) 7.34 ± 0.58 7.40 ± 0.57*** Back Volume (cm3) 1586.7 ± 319.1 1620.6 ± 306.1 ** Lateral Volume (cm3) 1840.6 ± 364.6 1874.7 ± 362.5 ** Average Volume (cm3) 1713.6 ± 334.9 1747.6 ± 328.8 ***
Quantitative data are shown as means ± standard deviations. Paired t-test. *P < 0.05, **P < 0.01 and ***P < 0.001. AC, ankle circum-ference; AWB, ankle width from the back; FOE, figure of eight; LAW, lateral ankle width; LLV, lower leg volume; MC, maximum circumference; MLW, maximum lower leg lateral width; MWB, maximum lower leg width from the back; STA, skin thickness at the ankle; STM, skin thickness at the maximum.
However, the possibility of the ultrasonic echo method for edema evaluation cannot be ruled out. We believe that the technology used to obtain these measurements may play a role in this. Although there is no definitive diagnosis of lymphedema, confirmation of edema using ultrasonography is common place.2 Ultrasonography is
non-invasive and useful for the determination of edema and its differentiation from venous thrombosis. It is also useful in confirming the distribution of water in the sub-cutaneous tissue and in assessing the degree of increase in fibrosis/adipose tissue.18 Additionally, it has been
re-ported useful in determining the existence of deep vein thrombosis or venous return insufficiency, conditions which are difficult to distinguish.19 Skin thickness can
be evaluated using images at the time of examination, when edema is large, it is possible that edema can be observed more accurately and thus be used as a practi-cal index by evaluating all of these elements. Further studies including patients with a larger degree of edema are warranted.
The lower leg volume calculated using the lower leg width measured from imaging data highly corre-lated with the LLV determined from the water displace-ment method, the gold standard technique for edema measurement. In addition, the lower leg width and ankle width measured using imaging data were correlated with the MC and AC. Although this study assessed data collected from only 15 subjects, it is thought that the outcomes may be very useful in suggesting a method for evaluating generalized edema.
It is also reported that a photograph of the affected area may be taken for examination and follow-up of the edematous site.8 The measurement of leg width using
digital image data is a non-invasive method that can be performed. Equipment necessary for this measurement method is relatively accessible, and the recording of test results in the form of an image is effective in a variety of clinical settings. If the joint angle, limb position, distance from the camera, and scale placement can be specified and standardized, then this technique may also be used for upper limb examination. As it is also useful for before-and-after comparison, we believe this method could be widely applicable. Even if the appropriate medical equipment cannot be used or is not available in a nursing home, it is possible to use a digital camera to record any observation. Although the use of digital imaging does not go beyond the possibilities, various problems such as errors are encountered; however, it was thought that digital imaging could be developed into a smartphone-based application that can easily measure swelling. However, when taking photographs, there is an increased potential for measurement error;
for example, the distance between the lens and the mea-surement position may be large. Although this approach was not adopted in this study, further improvement would be to capture a photograph of the leg from a distance that allows the evaluation of foot edema.
LLV showed significantly higher values in the afternoon than in the morning. Measurement days for patients were typical, without intense exercise or any restrictions in behavior. It was confirmed that everyday life without exercise resulted in swelling of the lower leg as time progressed. This finding was consistent with the results of a previous study.4 Although not shown, it was
also suggested that there were large individual differ-ences among the subjects’ swelling levels from morning to afternoon. A previous study using the questionnaire method reported that the cold disorder and edema were associated. Moreover, only a few studies on the gender- and age-based differences of edema are available for review,20 thus warranting further evaluations.
This study indicated that each index measured using a tape as well as digital images was effective for the quantitative evaluation of edema. Further, swelling of the lower legs with time can occur in the absence of daily exercise. It is believed that edema evaluation may be more effective when an appropriate measure-ment method is employed. Notably, the measuremeasure-ment errors decreased following the increase in the number of landmarks on the lower legs while measuring the circumference. Additionally, the recorded images can not only be used for documentation but also as a non-invasive primary evaluation method of edema.
In this study, we examined the possibility of iden-tifying valid measurement methods, but the number of subjects was small, and the ratio of men to women was biased. Moreover, healthy adults, rather than patients with edema, were examined. The circumference mea-sured using a tape, as well as leg width and leg volume, measured using digital images, can be considered useful tools in the follow-up observation of edema. Further studies including patients with a larger degree of edema are warranted.
Acknowledgments: This study was funded by a Grant-in-Aid for Scientific Research C of the Japan Society for the Promotion of Science (16K11913).
REFERENCES
1 Dantsiji M, Hoshimi M, Katano H, Tomozawa Y, Hisaoka T, Ohhira M. The Clinical Points of Evaluation for patients with Edema in Physical Therapy. J Phys Ther. 2004;21:251-5. 2 Ogawa Y. The Diagnosis of Peripheral Lymphedema. J Jpn
Coll Angiol. 2010;50:705-10.
3 Yabuki Y, Maegawa J. Evaluation of severity and function for lymphedema, and effect of lymphaticovenous anas-tomosis. Journal of Clinical and Experimental Medicine. 2017;262:1151-5.
4 Watanabe R, Saito A, Ogasawara Y, Komori A, Nemoto N, Yakabi A, et al. Evaluation of the accuracy of lower leg volume and edema of lower leg measured by a water displace-ment method. Rigakuryoho Kagaku. 2019;34:823-6. DOI: 10.1589/rika.34.823
5 Yoshimura S, Tsuji T, Okitsu T, Liu M. Reliability and validity of the PerometerTM for measuring limb volume in individuals with and without lymphedema. Japanese Journal of Lymphology. 2016;39:31-6.
6 Hiroshige Y, Urabe Y, Kawano D, Mito K, Kawabata Y. Comparison of the Clinical Usefulness of Various Methods for Foot and Ankle Circumference Measurement. J Phys Ther Sci. 2018;33:215-8. DOI: 10.1589/rika.33.215
7 Nakamura T, Goda N, Shirai K, Kusuhara T, Yamamoto Y. Development of human limb volume meter for evaluation of edema. Bull Fac Health Sci Okayama Univ Med Sch. 2003;14:31-5.
8 Framework L. Best Practice for the Management of Lymph-oedema. London: MEP Ltd; 2006.
9 Esterson PS. Measurement of ankle joint swelling using a figure of 8. J Orthop Sports Phys Ther. 1979;1:51-2. DOI: 10.2519/jospt.1979.1.1.51, PMID: 18810189
10 Hayes S, Cornish B, Newman B. Comparison of methods to diagnose lymphoedema among breast cancer survivors: 6-month follow-up. Breast Cancer Res Treat. 2005;89:221-6. DOI: 10.1007/s10549-004-2045-x, PMID: 15754119
11 Tatro-Adams D, McGann SF, Carbone W. Reliability of the figure-of-eight method of ankle measurement. J Orthop Sports Phys Ther. 1995;22:161-3. DOI: 10.2519/ jospt.1995.22.4.161, PMID: 8535474
12 Ohori Y, Ishizaka M, Itokazu M, Sadakiyo K, Kubo A, Endo Y. Longitudinal Changes in Body Composition and Circumference of the Lower Extremity after Jones Fracture. Rigakuryoho Kagaku. 2018;33:769-73. DOI: 10.1589/ rika.33.769
13 Toshima M, Morino Y. Water Distribution Changes in Complex Decongestive Treatment for Leg Lymphedema: Quantitative Evaluation by Direct Segmental Multi-frequency Bioimpedance Analysis. The Japanese Journal of Phlebology. 2020;31:1-7. DOI: 10.7134/phlebol.19-18
14 Schneider CA, Rasband WS, Eliceiri KW. NIH Image to ImageJ: 25 years of image analysis. Nat Methods. 2012;9:671-5. DOI: 10.1038/nmeth.2089, PMID: 22930834
15 Kawano T, Nishida S, Mizuno T. The Japanese journal of ergonomics. 2001;37(suppl):320-1. DOI: 10.5100/jje.37. Supplement_320
16 Kawano T, Nishida S, Hashimoto M, Tada T, Iwata K, Onosato M. Evaluation method for leg-rerelated fatigue during standing work tasks (4th report). Proceedings of JSPE Semestrial Meeting. 2005;2005:749-750. DOI: 10.11522/ pscjspe.2005A.0.749.0
17 Imai I, Shiomi T. Reliability of evaluation in physical therapy studies. Rigakuryoho Kagaku. 2004;19:261-5. DOI: 10.1589/ rika.19.261
18 Niimi K, Hirai M, Iwata H, Miyazaki K. Ultrasonographic Findings and the Clinical Results of Treatment for Lymph-edema. The Japanese Journal of Phlebology. 2013;24:287-94. DOI: 10.7134/phlebol.24.287, PMID: 25593621
19 Matsuo H. Could lymphedema be evaluated by ultrasonogra-phy? Angiology Frontier. 2013;12:103-106,181.
20 Harita N, Horie N, Shudo T, Kageyama M, Hatakeyama H. Age affects the relationship between cold disorder and edematous constitution. Recent Progress of Kampo Medicine in Obstetrics and Gynecology. 2013;24:287-94.