Introduction
Green tea is a popular beverage in Asian countries,
mainly in Japan, China and India. The relationship
between tea consumption and human cancer incidence is
an important concern. Several epidemiological studies
(Gao et al., 1994; Katiyar and Mukhtar, 1996; Kato et al.,
1990; Kono et al., 1988; Oguni et al., 1992; Ohno et al.,
1995; Yang et al., 1993) showed a lower risk of certain
types of cancers among people who consume a large
amount of green tea.
The hot water extract from green tea (GTE) is known to
possess various beneficial pharmacological and
physiolog-ical effects, such as antibacterial (Fukai et al., 1991; Toda
et al., 1991; 1992), antiviral (Green, 1949; Nakayama et al.,
1990; 1993), antifungal (Okubo et al., 1991), antioxidative
(Matsuzaki and Hara, 1985; Osawa et al., 1988),
antihe-molysin (Ikigai et al., 1990; Okubo et al., 1989),
antimuta-genic (Apotolides et al., 1996; Jain et al., 1989; Wang et al.,
1989) and antitumor (Katiyar et al., 1993a; 1993b; Wang et
al., 1992; 1994) activities. These effects of GTE are
Environ. Mutagen Res., 27: 177-184 (2005)
Original Article
Suppressive effect of (-)-epigallocatechin gallate on
7,12-dimethylbenz[
a
]anthracene-induced chromosome aberrations
in rat bone marrow cells
Yoshiaki Ito
*Kobe Institute of Health, 4-6 Minatojima-Nakamachi, Chuo-ku, Kobe 650-0046, Japan
Summar y
The suppressive effect of (-)-epigallocatechin gallate (EGCG), the major polyphenolic constituent
present in green tea, on 7,12-dimethylbenz[a]anthracene (DMBA)-induced chromosome
aberra-tions (CA) in rat bone marrow cells was studied. Rats given EGCG before the DMBA injection
dis-played a considerably suppressed frequency of DMBA-induced CA in their bone marrow cells. The
suppressive effect of EGCG (60 mg/kg body weight) given 24 h before was observed 24, 30, 48 and
72 h after the DMBA injection, but not at the early period (6, 12 and 18 h) after the DMBA
treat-ment. On the other hand, EGCG (60 mg/kg body weight) given 0.5 h before DMBA suppressed
DMBA-induced CA at all periods after the DMBA injection. The suppression of EGCG given 24 h
or 0.5 h before was observed for all doses of DMBA (25, 50, 75 and 100 mg/kg) investigated. EGCG
given at 60 mg/kg body weight 0.5 h before the DMBA injection showed greater suppressive effect
than the same dose given 24 h before. The suppressive effect of EGCG given 0.5 h before was
dose-dependent in the range of 20 ─ 60 mg/kg body weight. Methyl methanesulfonate (MMS:
direct-act-ing carcinogen)-induced CA were not suppressed by EGCG.
The administration of dehydroepiandrosterone (DHEA), a typical substrate for hydroxysteroid
sulfotransferases, 0.5 h before DMBA injection also significantly suppressed DMBA-induced CA but
DHEA given 24 h before did not.
These results suggest that EGCG has two different suppression mechanisms for DMBA-induced
CA depending on the administration time. The suppression of DMBA-induced CA by EGCG given
24 h or 0.5 h before may result from the modification of microsomal enzyme system or the
inhibi-tion of sulfotransferase activity by EGCG, respectively.
Keywords
: (-)-epigallocatechin gallate, 7,12-dimethylbenz[a]anthracene, methyl methanesulfonate,
chromosome aberration, rat bone marrow cells
*E-mail: [email protected]
Received: July 11, 2005, revised: October 14, 2005, accepted: October 14, 2005
thought to be due to polyphenolic constituents contained
in green tea. (-)-Epigallocatechin gallate (EGCG) is one of
the main green tea polyphenols (GTP).
We have previously reported (Ito et al., 1989) that the
administration of GTE or GTP mixture before aflatoxin B
1(AFB
1) injection in rats significantly suppressed AFB
1-induced chromosome aberrations (CA) in bone marrow
cells. Furthermore, we have reported (Ito and Ito, 2001)
the suppressive effect of EGCG on AFB
1-induced CA in rat
bone marrow cells. EGCG given 24 h before the AFB
1injection suppressed AFB
1-induced CA but not when
given 2 h before; the same was true for GTE or GTP
mix-ture. This suppression seems to be due to modification of
the microsomal enzyme system by EGCG.
In this study, we investigated the suppressive effect of
EGCG on CA induced by 7,12-dimethylbenz[a]anthracene
(DMBA: indirect-acting carcinogen, as is AFB
1) and by
methyl methanesulfonate (MMS: direct-acting
carcino-gen, needs no metabolic activation).
Materials and Methods
1. Chemicals
EGCG was purchased from Kurita Kogyo Co. (Tokyo,
Japan). DMBA, dehydroepiandrosterone (DHEA) and
colchicine were obtained from Wako Pure Chemicals Co.
(Tokyo, Japan), MMS was from Aldrich (Milwaukee, WI),
and dimethyl fulfoxide (DMSO: spectrophotometric
grade) was from E. Merck A.G., (Darmstadt, F.R.G.).
2. Animal experiments
Male rats of the Wistar strain (Charles River Japan,
Inc., Kanagawa, Japan), aged 28 ─ 35 days and weighing 80
─ 110 g, were used. Each experimental group consisted of
at least 6 rats. They were kept in an air-conditioned room
and fed diet (Oriental MF; Oriental Yeast Co., Ltd., Tokyo,
Japan) and water ad libitum.
DMBA and MMS were dissolved in DMSO or in water,
respectively. They were administered by i.p. injection.
EGCG and DHEA were dissolved in water or sesame oil,
respectively. These were administered by gastric
instilla-tion to lightly ether-anesthetized rats at various times
before the carcinogen injection. Colchicine (0.3 mg/rat)
was injected i.p. 1 h before sacrifice. Chromosome
speci-mens were prepared from the femoral bone marrow by
the conventional method (Sugiyama, 1971) at various
times after the carcinogen injection, stained in 2%
Giemsa solution (pH 6.8) for 15 min, and then analyzed
microscopically.
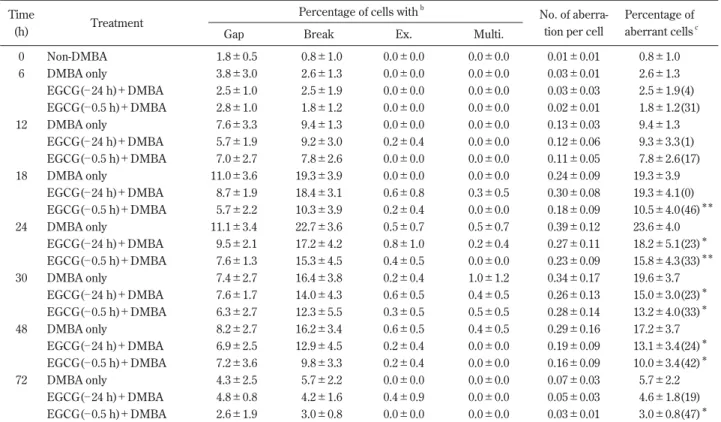
Table 1 Specific details of rat bone marrow cell CA at various times after DMBA injection and EGCG pretreatmentsa
Time
Treatment
Percentage of cells withb
No. of aberra- Percentage of
(h) Gap Break Ex. Multi. tion per cell aberrant cellsc
0 Non-DMBA 1.8±0.5 0.8±1.0 0.0±0.0 0.0±0.0 0.01±0.01 0.8±1.0 6 DMBA only 3.8±3.0 2.6±1.3 0.0±0.0 0.0±0.0 0.03±0.01 2.6±1.3 EGCG(─ 24 h)+DMBA 2.5±1.0 2.5±1.9 0.0±0.0 0.0±0.0 0.03±0.03 2.5±1.9(4) EGCG(─ 0.5 h)+DMBA 2.8±1.0 1.8±1.2 0.0±0.0 0.0±0.0 0.02±0.01 1.8±1.2(31) 12 DMBA only 7.6±3.3 9.4±1.3 0.0±0.0 0.0±0.0 0.13±0.03 9.4±1.3 EGCG(─ 24 h)+DMBA 5.7±1.9 9.2±3.0 0.2±0.4 0.0±0.0 0.12±0.06 9.3±3.3(1) EGCG(─ 0.5 h)+DMBA 7.0±2.7 7.8±2.6 0.0±0.0 0.0±0.0 0.11±0.05 7.8±2.6(17) 18 DMBA only 11.0±3.6 19.3±3.9 0.0±0.0 0.0±0.0 0.24±0.09 19.3±3.9 EGCG(─ 24 h)+DMBA 8.7±1.9 18.4±3.1 0.6±0.8 0.3±0.5 0.30±0.08 19.3±4.1(0) EGCG(─ 0.5 h)+DMBA 5.7±2.2 10.3±3.9 0.2±0.4 0.0±0.0 0.18±0.09 10.5±4.0(46)** 24 DMBA only 11.1±3.4 22.7±3.6 0.5±0.7 0.5±0.7 0.39±0.12 23.6±4.0 EGCG(─ 24 h)+DMBA 9.5±2.1 17.2±4.2 0.8±1.0 0.2±0.4 0.27±0.11 18.2±5.1(23)* EGCG(─ 0.5 h)+DMBA 7.6±1.3 15.3±4.5 0.4±0.5 0.0±0.0 0.23±0.09 15.8±4.3(33)** 30 DMBA only 7.4±2.7 16.4±3.8 0.2±0.4 1.0±1.2 0.34±0.17 19.6±3.7 EGCG(─ 24 h)+DMBA 7.6±1.7 14.0±4.3 0.6±0.5 0.4±0.5 0.26±0.13 15.0±3.0(23)* EGCG(─ 0.5 h)+DMBA 6.3±2.7 12.3±5.5 0.3±0.5 0.5±0.5 0.28±0.14 13.2±4.0(33)* 48 DMBA only 8.2±2.7 16.2±3.4 0.6±0.5 0.4±0.5 0.29±0.16 17.2±3.7 EGCG(─ 24 h)+DMBA 6.9±2.5 12.9±4.5 0.2±0.4 0.0±0.0 0.19±0.09 13.1±3.4(24)* EGCG(─ 0.5 h)+DMBA 7.2±3.6 9.8±3.3 0.2±0.4 0.0±0.0 0.16±0.09 10.0±3.4(42)* 72 DMBA only 4.3±2.5 5.7±2.2 0.0±0.0 0.0±0.0 0.07±0.03 5.7±2.2 EGCG(─ 24 h)+DMBA 4.8±0.8 4.2±1.6 0.4±0.9 0.0±0.0 0.05±0.03 4.6±1.8(19) EGCG(─ 0.5 h)+DMBA 2.6±1.9 3.0±0.8 0.0±0.0 0.0±0.0 0.03±0.01 3.0±0.8(47)*
aChromosome specimens were prepared at various times after 100 mg DMBA/kg body weight was injected. A dose of 60 mg EGCG/kg body
weight was orally given 24 h or 0.5 h before the DMBA injection. Values are means±SD.
bEx., exchange; Multi., multiple CA: cells having more than 10 aberrations. c
Cells with gaps are not included in the percentage of aberrant cells. Figures in the parenthesis indicate the suppression percent.
*
Statistical significance (p<0.05) of the difference from the rat group given only DMBA was determined by Student’s t-test.
**
3. Chromosome analysis
Metaphase cells with one or more CA were scored from
50 well-spread metaphases per rat (therefore 300
metaphases per experimental group). Gaps were defined
as achromatic lesions in one or both chromatids not
exceeding the width of a chromatid, and breaks as a
dis-continuity greater than the width of a chromatid,
irrespec-tive of whether or not the distal fragment was dislocated.
Cells with multiple CA were defined as cells in which the
number of CA was too great to count (numerous, above
10). Cells were classified into 1 of 4 categories according
to the degree of CA: cells with gaps only, cells with
breaks, cells with exchanges, and cells with multiple CA.
In the tabulated data, the column headed “percentage of
aberrant cells” gives the percentage of damaged cells in
the total population of cells analyzed. Damaged cells
include the cells with breaks, exchanges and multiple CA,
but not the cells with gaps. The severity of damage within
a cell is also given as the number of aberrations per cell;
cells with multiple CA were counted as 10 aberrations.
The suppression rate was calculated from the frequency
of aberrant cells.
Results
1. DMBA-induced CA and suppression by EGCG
DMBA-induced CA consisted mainly of gaps and
breaks. Cells with multiple CA or exchanges were
observed infrequently. On the other hand, the rats which
had received DMSO without DMBA showed only a few
gaps and breaks in their bone marrow cells. Cells with
exchange or multiple CA were not observed. The
frequen-cy of aberrant cells in the bone marrow of rats injected
with DMBA increased with the lapse of time from
expo-sure, as did the number of aberrations per cell. Maximum
levels were seen 24 h after the DMBA injection, after
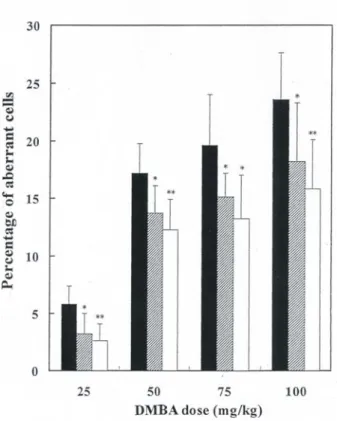
which they declined (Table 1, Fig. 1). The frequency of
aberrant cells induced by DMBA increased in proportion
to the dose of DMBA (Fig. 2).
Rats given EGCG 24 h before the DMBA injection
dis-played a considerably suppressed frequency of CA in their
bone marrow cells. The suppression was observed 24, 30,
48 and 72 h after the DMBA injection but no suppressive
)
Fig. 1 Variation of the frequency of aberrant cells in bone marrow of rats (■) receiving only the DMBA injection, rats ( ) given EGCG 24 h before and rats (□) given EGCG 0.5 h before the DMBA injection. Chromosome specimens were prepared at various times after 100 mg DMBA/kg body weight was injected i.p. A dose of 60 mg EGCG/kg body weight was orally given 24 h or 0.5 h before the DMBA injection. Values represent the mean±SD. Significant differ-ence from corresponding control group (**
p<0.01, *
p< 0.05).
Fig. 2 Relationship between the DMBA dose and the frequency of
aberrant cells in the bone marrow of rats (■) receiving only the DMBA injection, rats ( ) given EGCG 24 h before and rats (□) given EGCG 0.5 h before the DMBA injection. Chromosome specimens were prepared 24 h after various doses of DMBA were injected i.p. A dose of 60 mg EGCG/kg body weight was orally given 24 h or 0.5 h before the DMBA injection. Values represent the mean±SD. Significant difference from corresponding control group (**
p<0.01, *
effect was observed at early periods (6, 12 and 18 h) after
the DMBA injection (Fig. 1). On the other hand, rats
which received EGCG 0.5 h before the DMBA injection
showed a considerable suppression of CA at all periods
after the DMBA injection (Fig. 1). The number of
aberra-tions per cell showed the same tendency as the frequency
of aberrant cells (Table 1). The significant suppression by
EGCG was observed for all doses (25, 50, 75 or 100
mg/kg) of DMBA investigated (Fig. 2). In studying the
effect of EGCG pretreatment time on DMBA-induced CA,
there was a clear cycling function with 2 points of
maxi-mal effect at 24 h and 0.5 h (Fig. 3). The suppressive effect
of EGCG given 0.5 h before the DMBA injection was
greater than that of EGCG given 24 h before the DMBA
5 10 15 20 25 30 ─72 ─48 ─24 ─18 ─6 ─2 ─0.5 2 6
Time of EGCG treatment (h)
P
ercen
ta
g
e
o
f a
b
erra
n
t cel
ls
Fig. 3 Effect of EGCG treatment time on the frequency of aberrant cells induced by DMBA. Chromosome specimens were pre-pared 24 h after 100 mg DMBA/kg body weight was inject-ed i.p. A dose of 60 mg EGCG/kg body weight was orally given at various times before or after the DMBA injection. Each point represents the mean±SD.
5 10 15 20 25 30 35 0 20 40 60 120
EGCG dose (mg/kg)
Percentage of aberrant cells
Fig. 4 Relationship between the EGCG dose and the frequency of
aberrant cells induced by DMBA. Chromosome specimens were prepared 24 h after 100 mg DMBA/kg body weight was injected i.p. EGCG was orally administered at various doses 0.5 h before the DMBA injection. Each point repre-sents the mean±SD.
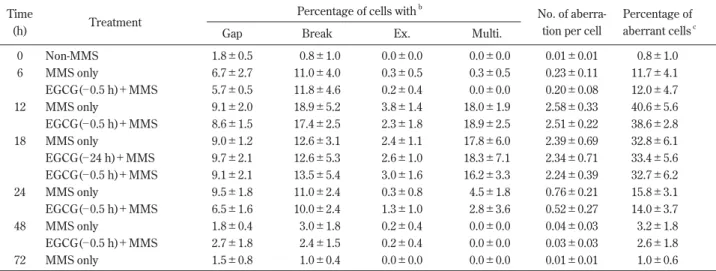
Table 2 Specific details of rat bone marrow cell CA at various times after MMS injection and EGCG pretreatmentsa
Time
Treatment
Percentage of cells withb
No. of aberra- Percentage of
(h) Gap Break Ex. Multi. tion per cell aberrant cellsc
0 Non-MMS 1.8±0.5 0.8±1.0 0.0±0.0 0.0±0.0 0.01±0.01 0.8±1.0 6 MMS only 6.7±2.7 11.0±4.0 0.3±0.5 0.3±0.5 0.23±0.11 11.7±4.1 EGCG(─ 0.5 h)+MMS 5.7±0.5 11.8±4.6 0.2±0.4 0.0±0.0 0.20±0.08 12.0±4.7 12 MMS only 9.1±2.0 18.9±5.2 3.8±1.4 18.0±1.9 2.58±0.33 40.6±5.6 EGCG(─ 0.5 h)+MMS 8.6±1.5 17.4±2.5 2.3±1.8 18.9±2.5 2.51±0.22 38.6±2.8 18 MMS only 9.0±1.2 12.6±3.1 2.4±1.1 17.8±6.0 2.39±0.69 32.8±6.1 EGCG(─ 24 h)+MMS 9.7±2.1 12.6±5.3 2.6±1.0 18.3±7.1 2.34±0.71 33.4±5.6 EGCG(─ 0.5 h)+MMS 9.1±2.1 13.5±5.4 3.0±1.6 16.2±3.3 2.24±0.39 32.7±6.2 24 MMS only 9.5±1.8 11.0±2.4 0.3±0.8 4.5±1.8 0.76±0.21 15.8±3.1 EGCG(─ 0.5 h)+MMS 6.5±1.6 10.0±2.4 1.3±1.0 2.8±3.6 0.52±0.27 14.0±3.7 48 MMS only 1.8±0.4 3.0±1.8 0.2±0.4 0.0±0.0 0.04±0.03 3.2±1.8 EGCG(─ 0.5 h)+MMS 2.7±1.8 2.4±1.5 0.2±0.4 0.0±0.0 0.03±0.03 2.6±1.8 72 MMS only 1.5±0.8 1.0±0.4 0.0±0.0 0.0±0.0 0.01±0.01 1.0±0.6
aChromosome specimens were prepared at various times after 75 mg MMS/kg body weight was injected. A dose of 60 mg EGCG/kg body
weight was orally given 24 h or 0.5 h before the MMS injection. Values are means±SD.
bEx., exchange; Multi., multiple CA: cells having more than 10 aberrations. cCells with gaps are not included in the percentage of aberrant cells.
injection. The suppressive effect of EGCG was
dose-dependent in the range of 20 ─ 60 mg/kg body weight;
higher EGCG doses (120 mg/kg) produced no additional
suppression (Fig. 4). Rats given only EGCG (180 mg/kg)
without carcinogen displayed no induction of CA in their
bone marrow cells (data not shown).
2. MMS-induced CA and effect of EGCG
The frequency of MMS-induced CA in rat bone marrow
cells after MMS injection also increased with time and
was at the maximum level 12 h post-injection, decreasing
thereafter (Table 2). Cells with multiple CA or exchanges
induced by MMS were at a higher frequency compared
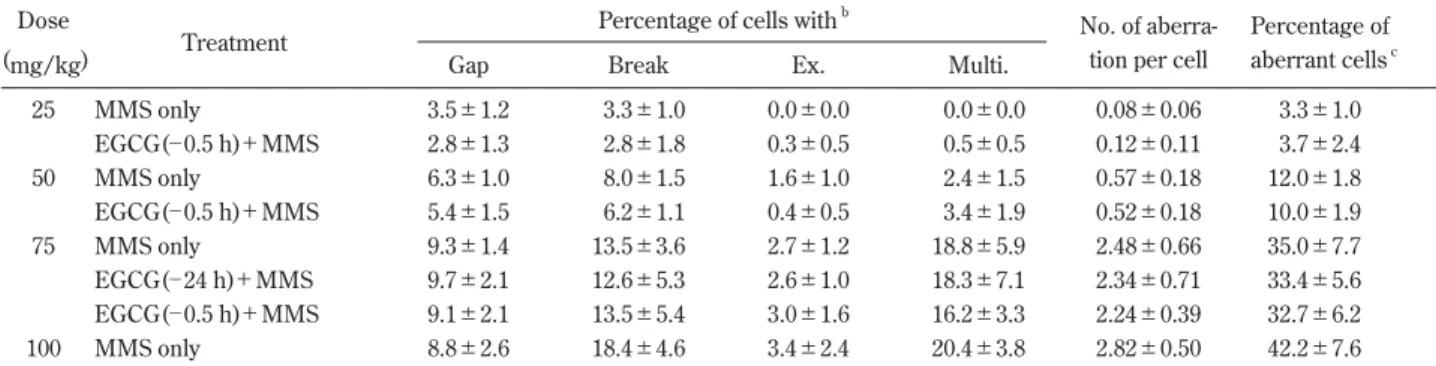
with DMBA. The frequency of aberrant cells induced by
MMS increased in proportion to the dose of MMS (Table
3). MMS-induced CA were not suppressed significantly by
EGCG given 24 h or 0.5 h before the MMS injection
(Table 2).
3. Suppression of DMBA-induced CA by DHEA
DHEA, a typical substrate for hydroxysteroid
sulfo-transferases, significantly suppressed DMBA-induced CA
when given at 0.5 h before DMBA injection but not at 24 h
(Table 4).
Discussion
Polycyclic aromatic hydrocarbons (PAH) are ubiquitous
environmental pollutants. DMBA is one of the most
potent carcinogenic PAH and can induce in experimental
animals not only skin tumors (Boyland et al., 1965;
Kinoshita and Gelboin, 1972; Slaga et al., 1979) but also
leukemia (Huggins and Sugiyama, 1966) and mammary
cancers (Huggins et al., 1961; Russo and Russo, 1991).
DMBA, in common with other PAH or AFB
1, requires
metabolic activation by hepatic microsomal enzyme
sys-tems to exert its mutagenic or carcinogenic activity. Two
ultimate carcinogenic metabolites of DMBA, a bay region
diol-epoxide (DMBA-trans-3,4-diol-1,2-epoxide)
(Huber-man et al., 1979; Moschel et al., 1977) and
7-hydroxy-methyl-12-methylbenz[a]anthracene (7-HMBA) sulfate
ester (Watabe et al., 1982; 1985), are well known. DMBA
is metabolized by cytochrome P450 (CYP) enzymes and
microsomal epoxide hydrolase into both inert metabolites
and electrophilic metabolites capable of producing DNA
adducts. CYP1B1 oxidizes DMBA to DMBA-3,4-epoxide,
which is hydrolysed by microsomal epoxide hydrolase to
DMBA-3,4-diol. This metabolite is further oxidized by
either CYP1A1 or CYP1B1 to the ultimate carcinogenic
Table 3 Specific details of rat bone marrow cell CA after various doses of MMS with or without EGCG pretreatmenta
Dose
Treatment
Percentage of cells withb
No. of aberra- Percentage of
(mg/kg) Gap Break Ex. Multi. tion per cell aberrant cellsc
25 MMS only 3.5±1.2 3.3±1.0 0.0±0.0 0.0±0.0 0.08±0.06 3.3±1.0 EGCG(─ 0.5 h)+MMS 2.8±1.3 2.8±1.8 0.3±0.5 0.5±0.5 0.12±0.11 3.7±2.4 50 MMS only 6.3±1.0 8.0±1.5 1.6±1.0 2.4±1.5 0.57±0.18 12.0±1.8 EGCG(─ 0.5 h)+MMS 5.4±1.5 6.2±1.1 0.4±0.5 3.4±1.9 0.52±0.18 10.0±1.9 75 MMS only 9.3±1.4 13.5±3.6 2.7±1.2 18.8±5.9 2.48±0.66 35.0±7.7 EGCG(─ 24 h)+MMS 9.7±2.1 12.6±5.3 2.6±1.0 18.3±7.1 2.34±0.71 33.4±5.6 EGCG(─ 0.5 h)+MMS 9.1±2.1 13.5±5.4 3.0±1.6 16.2±3.3 2.24±0.39 32.7±6.2 100 MMS only 8.8±2.6 18.4±4.6 3.4±2.4 20.4±3.8 2.82±0.50 42.2±7.6
aChromosome specimens were prepared at 18 h after various doses of MMS were injected. A dose of 60 mg EGCG/kg was orally given 24 h or
0.5 h before the MMS injection. Values are means±SD.
bEx., exchange; Multi., multiple CA: cells having more than 10 aberrations. cCells with gaps are not included in the percentage of aberrant cells.
Table 4 Suppression of DMBA-induced CA by DHEAa
Treatment Percentage of cells with
b
No. of aberra- Percentage of
Gap Break Ex. Multi. tion per cell aberrant cellsc
DMBA only 9.8±2.9 23.0±5.1 0.4±0.9 0.4±0.9 0.39±0.15 23.8±4.9
DHEA(─ 0.5 h, 30 mg/kg)+DMBA 8.2±2.9 16.7±3.8 0.7±0.8 0.3±0.5 0.32±0.06 17.7±3.3(26)*
DHEA(─ 0.5 h, 60 mg/kg)+DMBA 8.8±1.7 14.8±3.2 0.0±0.0 0.2±0.4 0.26±0.09 15.0±3.3(37)**
DHEA(─ 24 h, 60 mg/kg)+DMBA 9.1±1.4 22.9±4.9 0.4±0.5 0.5±0.7 0.42±0.14 23.8±5.4
aChromosome specimens were prepared 24 h after 100 mg DMBA/kg body weight was injected. DHEA dissolved in sesame oil was orally
given 24 h or 0.5 h before the DMBA injection. Values are means±SD.
bEx., exchange; Multi., multiple CA: cells having more than 10 aberrations.
cCells with gaps are not included in the percentage of aberrant cells. Figures in the parenthesis indicate the suppression percent. *
Significantly different from the rat group given only DMBA (p<0.05).
**
metabolite, DMBA-3,4-diol-1,2-epoxide (Miyata et al.,
1999). The first step of another pathway of DMBA
metabolic activation is the hydration of the position 7
methyl group. DMBA is metabolized by hepatic
microso-mal cytochrome P450 CYP1A1 to 7-HMBA (Christou et
al., 1984; Wilson et al., 1984), which is transformed to
reactive 7-HMBA sulfate ester by hepatic sulfotransferase.
7-HMBA sulfate ester is nonenzymatically converted into
DMBA-7-methylene carbonium ion which rapidly reacts
with endogenous substrates such as DNA and protein
(Watabe et al., 1983; 1985).
In the present study, we have investigated the
suppres-sive effect of EGCG, the major polyphenolic constituent of
green tea, on DMBA-induced CA in rat bone marrow
cells. EGCG given before the DMBA injection
significant-ly suppressed DMBA-induced CA. The suppressive effect
of EGCG given 24 h before was observed 24, 30, 48 and 72
h after the DMBA injection, but no suppressive effect at
the early period (6, 12 and 18 h) after the DMBA
treat-ment. On the other hand, EGCG given 0.5 h before the
DMBA injection suppressed DMBA-induced CA at all
periods after the DMBA injection (Fig. 1). Rats given
EGCG 0.5 h before DMBA showed greater suppressive
effects than rats given EGCG 24 h before DMBA. We
have been studying the suppressive effect of
antimuta-gens on carcinogen-induced CA for more than 20 years,
and EGCG is the first antimutagen that displays two
tem-poral points of maximal action. This result suggests that
EGCG has two different suppression mechanisms for
DMBA-induced CA depending on the administration time.
However, the suppression mechanism of EGCG has not
yet been elucidated sufficiently.
We have previously reported (Ito et al., 1982; 1984;
Sugiyama et al., 2002) that the administration of Sudan III,
an inducer of drug-metabolizing enzymes, 24 h before the
DMBA injection potently suppressed DMBA-induced CA,
although its administration 2 h before did not. The
sup-pression of DMBA-induced CA by Sudan III was observed
at all periods after the DMBA treatment. It was suggested
that the suppressive effect of Sudan III is due to the
induc-tion of cytochrome P450 and GST by Sudan III in rat liver.
However, the administration of EGCG 24 h before
sacri-fice did not result in a significant increase in cytochrome
P450 content or GST activity (Ito and Ito, 2001). Sohn et
al. (1994) and Bu-Abbas et al. (1994) have reported that
rats administered GTE for 4 or 6 weeks displayed no
sig-nificant increase in total cytochrome P450 content in the
liver, but did display a significant increase in O-dealkylase
activity of ethoxyresorufin (CYP1A1), methoxyresorufin
(CYP1A2) and pentoxyresorufin (CYP2B1). Of the phase
II enzymes, UDP-glucuronyltransferase was increased,
but GST was not.
The peak in the percentage of aberrant cells induced by
DMBA seems to shift from 24 h to 18 h by EGCG given 24
h before the DMBA injection (Fig. 1), that is to say,
EGCG given 24 h before seems to accelerate the rate of
DMBA metabolism in rat liver. Furthermore, CA induced
by MMS or n-butyl-N-nitrosourea (data not shown), a
direct-acting carcinogen which does not require metabolic
activation by microsomal enzyme systems, were not
sup-pressed by EGCG. Therefore, the suppression of
DMBA-induced CA by EGCG given 24 h before may result from
the modification of microsomal enzyme systems.
We have previously reported (Ito and Ito, 2001) that
EGCG given 24 h before an AFB
1injection significantly
suppressed AFB
1-induced CA but EGCG given 2 h before
did not. The suppression of AFB
1-induced CA by EGCG
was also observed only at the late period (18, 24 and 48 h)
after the AFB
1injection and was explained by the
modifi-cation of microsomal enzyme system, that is, the
adminis-tration of EGCG decreased the active metabolites of AFB
1reaching target cells by the modulation of AFB
1metabolism in rat liver and consequently suppressed
AFB
1-induced CA. The major ultimate metabolite of AFB
1is considered to be AFB
1-2,3-epoxide (Schoenhard et al.,
1976; Schoental, 1970; Swenson et al., 1977). Recent
evi-dence indicates that cytochromes P450 CYP3A2 and
CYP2C11 are responsible for AFB
1-epoxidation.
Inactivation of AFB
1to AFM
1is mediated via CYP1A1 and
CYP1A2; these cytochrome P450 species are not
responsi-ble for AFB
1-epoxidation. Similarly, AFQ
1formation is
mediated via CYP3A2 and CYP2B (Eaton and Gallagher,
1994; Buetler et al., 1996). Furthermore, Qin et al. (1997)
have reported that the pretreatment of rats with 0.5%
green tea in their drinking water for 2 or 4 weeks did not
produce a significant increase in cytochrome P450 content
but enhanced microsome-mediated formation of non-toxic
hydroxylated metabolites of AFB
1by 2 ─ 3 fold. These
reports support our explanation.
Surh et al. (1991) reported that the sulfotransferase
activity for 7-HMBA was strongly inhibited by DHEA, a
typical substrate for hydroxysteroid sulfotransferases.
DHEA given 0.5 h before the DMBA injection
significant-ly suppressed DMBA-induced CA but DHEA given 24 h
before did not (Table 4). Therefore, the suppression of
DMBA-induced CA by EGCG given 0.5 h before may be
due to the inhibition of sulfotransferase activity by EGCG.
Further studies are needed for clarification.
References
Apotolides, Z., D.A. Balentine, M.E. Harbowy and J.H. Weisburger (1996) Inhibition of 2-amino-1-methyl-6-phenylimidazo[4,5-b]pyri-dine (PhIP) mutagenicity by black and green tea extracts and polyphenols, Mutat. Res., 359, 159-163.
Boyland, E., P. Sims and C. Huggins (1965) Induction of adrenal damage and cancer with metabolites of 7,12-dimethylbenz[a] anthracene, Nature (London), 207, 816-817.
Selective induction of rat hepatic CYP1 and CYP4 proteins and of peroxisomal proliferation by green tea, Carcinogenesis, 15, 2575-2579.
Buetler, T.M., T.K. Bammler, J.D. Hayes and D.L. Eaton (1996) Oltipraz-mediated changes in aflatoxin B1biotransformation in rat
liver: implications for human chemoprevention, Cancer Res., 56, 2306-2313.
Christou, M., N.M. Wilson and C.R. Jefcoate (1984) Role of sec-ondary metabolism in the metabolic activation of 7,12-dimethyl-benz[a]anthracene by rat liver microsomes, Carcinogenesis, 5, 1239-1247.
Eaton, D.L. and E.P. Gallagher (1994) Mechanisms of aflatoxin car-cinogenesis, Annu. Rev. Pharmacol. Toxicol., 34, 135-172. Fukai, K., T. Ishigami and Y. Hara (1991) Antibacterial activity of tea
polyphenols against phytopathogenic bacteria, Agric. Biol. Chem., 55, 1895-1897.
Gao, Y.T., J.K. McLaughlin, W.J. Blot, B.T. Ji, Q. Dai and J.F. Fraumeni Jr. (1994) Reduced risk of esophageal cancer associated with green tea consumption, J. Natl. Cancer Inst., 86, 855-858. Green, R.H. (1949) Inhibition of multiplication of influenza virus by
extracts of tea, Proc. Soc. Exp. Biol. Med., 71, 84-85.
Huberman, E., M.W. Chou and S.K. Yang (1979) Identification of 7,12-dimethylbenz[a]anthracene metabolites that lead to mutagen-esis in mammalian cells, Proc. Natl. Acad. Sci. USA, 76, 862-866. Huggins, C.B. and T. Sugiyama (1966) Induction of leukemia in rat
by pulse doses of 7,12-dimethylbenz[a]anthracene, Proc. Natl. Acad. Sci. USA, 55, 74-81.
Huggins, C.B., L.C. Grand and F.P. Brillantes (1961) Mammary can-cer induced by a single feeding of polynuclear hydrocarbons, and its suppression, Nature (London), 189, 204-207.
Ikigai, H., M. Toda, S. Okubo, Y. Hara and T. Shimamura (1990) Relationship between the anti-hemolysin activity and the structure of catechins and theaflavins (in Japanese), Jpn. J. Bacteriol., 45, 913-919.
Ito, Y. and M. Ito (2001) Suppressive effect of (-)-epigallocatechin gallate on aflatoxin B1-induced chromosome aberrations in rat
bone marrow cells, J. Health Sci. 47, 248-257.
Ito, Y., S. Maeda, K. Souno, N. Ueda and T. Sugiyama (1984) Induction of hepatic glutathione transferase and suppression of 7,12-dimethylbenz[a]anthracene-induced chromosome aberra-tions in rat bone marrow cells by sudan III and related azo dyes, J. Natl. Cancer Inst., 73, 177-183.
Ito, Y., S. Maeda, T. Fujihara, N. Ueda and T. Sugiyama (1982) Suppression of 7,12-dimethylbenz[a]anthracene-induced chromo-some aberrations in rat bone marrow cells after treatment with sudan III and related azo dyes, J. Natl. Cancer Inst., 69, 1343-1346. Ito, Y., S. Ohnishi and K. Fujie (1989) Chromosome aberrations
induced by aflatoxin B1in rat bone marrow cells in vivo and their
suppression by green tea, Mutat. Res., 222, 253-261.
Jain, A.K., K. Shimoi, Y. Nakamura, T. Kada, Y. Hara and I. Tomita (1989) Crude tea extracts decrease the mutagenic activity of N-methyl-N’-nitro-N-nitrosoguanidine in vitro and in intragastric tract of rats, Mutat. Res., 210, 1-8.
Katiyar, S.K. and H. Mukhtar (1996) Tea in chemoprevention of can-cer: Epidemiologic and experimental studies (Review), Int. J. Oncol., 8, 221-238.
Katiyar, S.K., R. Agarwal and H. Mukhtar (1993a) Protective effects of green tea polyphenols administered by oral intubation against chemical carcinogen-induced forestomach and pulmonary neopla-sia in A/J mice, Cancer Lett., 73, 167-172.
Katiyar, S.K., R. Agarwal, M.T. Zaim and H. Mukhtar (1993b)
Protection against N-nitrosodiethylamine and benzo[a]pyrene-induced forestomach and lung tumorigenesis in A/J mice by green tea, Carcinogenesis, 14, 849-855.
Kato, I., S. Tominaga, A. Matsuura, Y. Yoshii, M. Shirai and S. Kobayashi (1990) A comparative case-control study of colorectal cancer and adenoma, Jpn. J. Cancer Res., 81, 1101-1108.
Kinoshita, N. and H.V. Gelboin (1972) Aryl hydrocarbon hydroxy-lase and polycyclic hydrocarbon tumorigenesis: Effect of the enzyme inhibitor 7,8-benzoflavone on tumorigenesis and macro-molecule binding, Proc. Natl. Acad. Sci. USA, 69, 824-828. Kono, S., M. Ikeda, S. Tokudome and M. Kuratsune (1988) A
case-control study of gastric cancer and diet in Northern Kyushu, Japan, Jpn. J. Cancer Res., 79, 1067-1074.
Matsuzaki, T. and Y. Hara (1985) Antioxidative activity of tea leaf catechins (in Japanese), Nippon Kogeikagaku Kaishi, 59, 129-134. Miyata, M., G. Kudo, Y.H. Lee, T.J. Yang, H.V. Gelboin, P.
Fernandez-Salguero, S. Kimera and F.J. Gonzalez (1999) Targeted disruption of the microsomal epoxide hydrolase gene: Microsomal epoxide hydrolase is required for the carcinogenic activity of 7,12-dimethylbenz[a]anthracene, J. Biol. Chem., 274, 23963-23968. Moschel, R.C., W.M. Baird and A. Dipple (1977) Metabolic activation
of the carcinogen 7,12-dimethylbenz[a]anthracene for DNA bind-ing, Biochem. Biophys. Res. Commun., 76, 1092-1098.
Nakayama, M., M. Toda, S. Okubo and T. Shimamura (1990) Inhibition of influenza virus infection by tea, Lett. Appl. Microbiol., 11, 38-40.
Nakayama, M., K. Suzuki, M. Toda, S. Okubo, Y. Hara and T. Shimamura (1993) Inhibition of the infectivity of influenza virus by tea polyphenols, Antiviral Res., 21, 289-299.
Oguni, I., S.J. Chen, P.Z. Lin and Y. Hara (1992) Protection against cancer risk by Japanese green tea, Prev. Med., 21, 332-348. Ohno, Y., K. Wakai, K. Genka, K. Ohmine, T. Kawamura, A.
Tamakoshi, R. Aoki, M. Senda, Y. Hayashi, K. Nagao, S. Fukuma and K. Aoki (1995) Tea consumption and lung cancer risk: A case-control study in Okinawa, Japan, Jpn. J. Cancer Res., 86, 1027-1034.
Okubo, S., H. Ikigai, M. Toda and T. Shimamura (1989) The anti-haemolysin activity of tea and coffee, Lett. Appl. Microbiol., 9, 65-66.
Okubo, S., M. Toda, Y. Hara and T. Shimamura (1991) Antifungal and fungicidal activities of tea extract and catechin against Trichophyton (in Japanese), Jpn. J. Bacteriol., 46, 509-514. Osawa, T., M. Namiki and S. Kawakishi (1988) Role of dietary
antiox-idants in protection against oxidative damage, In: Y. Kuroda, D.M. Shankel, M.D. Waters (Eds), Antimutagenesis and Anticarcino-genesis Mechanisms II, Plenum Press, New York and London, pp. 139-153.
Qin, G., P. Gopalan-Kriczky, J. Su, Y. Ning and P.D. Lotlikar (1997) Inhibition of aflatoxin B1-induced initiation of
hepatocarcinogene-sis in the rat by green tea, Cancer Lett., 112, 149-154.
Russo, J. and I.H. Russo (1991) Mammary tumorigenesis, Prog. Exp. Tumor Res., 33, 175-191.
Schoenhard, G.L., D.J. Lee, S.E. Howell, N.E. Pawlowski, L.M. Libbey and R.O. Sinnhuber (1976) Aflatoxin B1metabolism to
afla-toxicol and derivatives lethal to Bacillus subtilis GSY1057 by rain-bow trout (Salmo gairdneri) liver, Cancer Res., 36, 2040-2045. Schoental, R. (1970) Hepatotoxic activity of retrosine, senkirkine and
hydroxyl-senkirkine in newborn rats, and the role of epoxides in carcinogenesis by pyrrolizidine alkaloids and aflatoxins, Nature (London), 227, 401-402.
Harvey (1979) Potent tumor-initiating activity of the 3,4-dihydrodi-ol of 7,12-dimethylbenz[a]anthracene in mouse skin, Cancer Res., 39, 1934-1936.
Sohn, O.S., A. Surace, E.S. Fiala, J.P. Richie, S. Colosimo Jr., E. Zang and J.H. Weisburger (1994) Effects of green and black tea on he-patic xenobiotic metabolizing systems in the male F344 rat, Xenobiotica, 24, 119-127.
Sugiyama, T. (1971) Specific vulnerability of the largest telocentric chromosome of rat bone marrow cells to 7,12-dimethylbenz[a]anthracene, J. Natl. Cancer Inst., 47, 1267-1275. Sugiyama, T., M. Osaka, K. Koami, S. Maeda, N. Ueda (2002)
7,12-DMBA-induced rat leukemia: a review with insights into future research, Leukemia Res., 26, 1053-1068.
Surh, Y.J., A. Liem, E.C. Miller and J.A. Miller (1991) Age- and sex-related differences in activation of the carcinogen 7-hydroxymethyl-12-methylbenz[a]-anthracene to an electrophilic sulfuric acid ester metabolite in rats: Possible involvement of hydroxy-steroid sulfotransferase activity, Biochem. Pharmacol., 41, 213-221.
Swenson, D.H., J.K. Lin, E.C. Miller and J.A. Miller (1977) Aflatoxin B1-2,3-oxide as a probable intermediate in the covalent binding of
aflatoxin B1and B2to rat liver DNA and ribosomal RNA in vivo,
Cancer Res., 37, 172-181.
Toda, M., S. Okubo, H. Ikigai, T. Suzuki, Y. Suzuki and T. Shimamura (1991) The protective activity of tea against infection by Vibrio cholerae O1, J. Appl. Bacteriol., 70, 109-112.
Toda, M., S. Okubo, H. Ikigai, T. Suzuki, Y. Suzuki, Y. Hara and T. Shimamura (1992) The protective activity of tea catechins against experimental infection by Vibrio cholerae O1, Microbiol. Immunol., 36, 999-1001.
Wang, Z.Y., M.T. Huang, T. Ferraro, C.Q. Wong, Y.R. Lou, K. Reuhl, M. Iratropoulos, C.S. Yang and A.H. Conney (1992) Inhibitory
effect of green tea in the drinking water on tumorigenesis by ultra-violet light and 12-O-tetradecanoyl-phorbol-13-acetate in skin of SKH-1 mice, Cancer Res., 52, 1162-1170.
Wang, Z.Y., M.T. Huang, Y.R. Lou, J.G. Xie, K.R. Reuhl, H.L. Newmark, C.T. Ho, C.S. Yang and A.H. Conney (1994) Inhibitory effects of black tea, green tea, decaffeinated black tea, and decaf-feinated green tea on ultraviolet B light-induced skin carcinogene-sis in 7,12-dimethylbenz[a]anthracene-initiated SKH-1 mice, Cancer Res., 54, 3428-3435.
Wang, Z.Y., S.J. Cheng, Z.C. Zhou, M. Athar, W.A. Khan, D.R. Bickers and H. Mukhtar (1989) Antimutagenic activity of green tea polyphenols, Mutat. Res., 223, 273-285.
Watabe, T., T. Fujieda, A. Hiratsuka, T. Ishizuka, Y. Hakamata and K. Ogura (1985) The carcinogen, 7-hydroxymethyl-12-methyl-benz[a]anthracene, is activated and covalently binds to DNA via a sulphate ester, Biochem. Pharmacol., 34, 3002-3005.
Watabe, T., T. Ishizuka, M. Isobe and N. Ozawa (1982) A 7-hydroxymethyl sulfate ester as an active metabolite of 7,12-dimethylbenz[a]anthracene, Science, 215, 403-405.
Watabe, T., T. Ishizuka, T. Fujieda, A. Hiratsuka and K. Ogura (1985) Sulfate esters of hydroxymethyl-methyl benz[a]anthracenes as active metabolites of 7,12-dimethylbenz[a]anthracene, Jpn. J. Cancer Res., 76, 684-698. Watabe, T., T. Ishizuka, Y. Hakamata, T. Aizawa and M. Isobe (1983)
Covalent binding of the proximate carcinogen, 7-hydroxymethyl-12-methylbenz[a]anthracene (7-HMBA) to rat liver cytosolic pro-tein via 7-HMBA sulphate, Biochem. Pharmacol., 32, 2120-2122. Wilson, N.M., M. Christon, C.R. Turner, S.A. Wrighton and C.R.
Jefcoate (1984) Binding and metabolism of benzo[a]pyrene and 7,12-dimethylbenz[a]anthracene by seven purified forms of cytochrome, P450, Carcinogenesis, 5, 1475-1483.
Yang, C.S. and Z.Y. Wang (1993) Tea and cancer, J. Natl. Cancer Inst., 85, 1038-1049.