The Effect of Public Transportation on Traffic
Accidents in Aging Japan : Using Municipal
Panel Data
journal or
publication title
Annual review of the institute for advanced
social research
number
17
page range
39-57
year
2020-03-31
!!!!!!!!!!!!!!!!!!!!!!!!!!!!!!!!!!!!!!!!!!!!!!!!!!!!!!!!!!!!!!!!!!!!!!!!!!!!!!!!!!!!!!!!!!!!!!!!!!!!!!!!!!!!!!!!!!!!!!!!!!!!!!!!!!!!!!!!!!!!!!!!!!!!!!!!!!!!!!!!!!!!!!!!!!!!!!!!!!!!!!!!!!!!!!!!!!!!!!!!!!!!!!!!!!!!!!!!!!!!!!!!!!!!!!!!!!!!!!!!!!!!!!!!!!!!!!!!!!!!!!!!
" 論 文 "
Abstract
In Japan, the recent decline in public transport services has increased people’s reliance on motor vehicles, especially in rural areas. Older adults are no exception. Despite their importance to the daily lives of older people who do not have their own vehicles, many public transport services have ceased operation or had their numbers of routes reduced (e.g., buses). Thus, with the aging of the population, traffic accidents caused by older people have become increasingly common. In order to reduce the frequency of such accidents, we need to clarify the relationship between traffic accidents and the convenience of public transportation. Therefore, using municipal panel data on the numbers of traffic accidents, demographic structure, and living environment, we empirically analyze the factors that affect such accidents. The results reveal that (i) the larger the number of population density in a municipality, the lower the frequency of traffic accidents, and (ii) the higher the ratio of older residents in a municipality, the higher the frequency of traffic accidents. Moreover, we find that the number of bus stops and the number of train passengers have negative effects on the frequency of traffic accidents, implying that better public transit services reduces the frequency of traffic accidents.
Key words : Traffic accident, Aging society, Panel data analysis, Fixedeffects model, Hybrid model JEL Classification : C13 C81 R41
1. Introduction
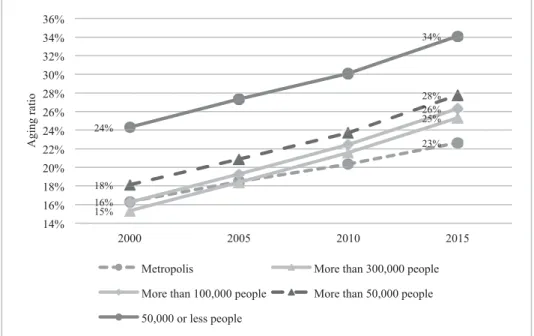
Japan is facing serious problems related to the aging of its population. Figure 1 shows the age ratio1) by municipality population size for the period 2000 to 2015. Overall, the ratios show a
parallel increasing trend of approximately 10 percent over the past decade. In particular, note the high ratio of older adults2) in cities with a population of 50,000 or less. In 2015, the ratio of
the population in these municipalities to that of the whole country was 15.8 percent3). However,
in terms of the number of municipalities, these rural municipalities account for 45.6 percent of the total. In other words, almost half of all Japanese municipalities face problems related to ──────────────
*Graduate School of Economics, Kwansei Gakuin University
1)The ratio is calculated by dividing 65 age or older population by the entire population. 2)Older adults or older people mean 65 age or older.
3)Calculated by the author from the National census (2015).
The Effect of Public Transportation on Traffic Accidents in Aging Japan
―Using Municipal Panel Data―
depopulation and a high aging ratio. In addition, in these rural areas, many public transport services have ceased operation or had their numbers of routes reduced (e.g., buses), owing to the budget deficit that has accompanied the population decline. In 2016, more than 60 percent of local bus operators and more than 70 percent of regional railway operators had a budget deficit (Ministry of Land, Infrastructure, Transport and Tourism, 2018). Prior to motorization (i. e., the spread of motor vehicles in society), municipalities with small populations did not provide convenient public transport. Since then, it has become relatively common for Japanese people to own their own vehicles. This implies that the main users of public buses are older adults and students (Nihon Bus Association, 2018). However, the number of young bus passengers has been decreasing, largely because Japan is experiencing a declining birth rate. Furthermore, the advent of motorization has increased the number of older adults with a motor vehicle license. Together, these trends have led to a decrease in the use of public transportation, particularly in rural areas. As a result, the convenience of public transportation has decreased further in such areas since the 1970s (Tanaka, 2009).
The aforementioned reduction in the convenience of public transportation has increased the degree of dependence on private vehicles, particularly in rural areas (Ministry of Land, Infrastructure, Transport and Tourism, 2018). In urban areas, which include many commercial facilities and hospitals, residents can go shopping or visit a doctor on foot. However, with fewer
Figure 1 Trend of growth in older population in Japan
Source : National Institute of Population and Social Security Research (2015), Statistics Bureau, Ministry of Internal Affairs and Communications (2015)
Note : “Metropolis” refers to the Tokyo metropolitan area and designated cities. Designated cities are as of 2016. Population classification is based on 2015.
such facilities in rural areas, private vehicles become indispensable to residents. The average number of vehicles4) per person in Japan in 2015 was 0.62 (median=0.65).5) Viewed by
prefecture, Gunma is highest (0.77), and Tokyo is lowest (0.27). Furthermore, in Tokyo, the number of vehicles per person decreased between 2005 and 2015 by 11.8 percent ; in the same period, the national average increased by 8.3 percent. These values clearly indicate the differences in major transportation between rural and urban areas.
According to an annual report on Japan’s aging society, in all areas other than the Tokyo metropolitan area, older adults prefer to drive vehicles by oneself when going shopping. Then, traffic accidents involving or caused by older adult has become a major problem in Japan. Figure 2 shows the number of traffic accidents caused by older adults, and the ratio of such accidents to the total number of traffic accidents. As shown, the number of traffic accidents caused by older adults has decreased, but the ratio of such accidents to the total has increased. In addition, the total number of traffic accidents decreased by 44 percent over the decade up to 2018, when there were 430,601 recorded accidents. This decrease is attributed to technology improvements, strict vehicle safety standards, a revision of the driving license regulations, and a decrease in the number of young drivers (Oguchi, 2016). Nevertheless, traffic accidents caused by older adults decreased by only 12 percent in the same period. In general, our neurological
──────────────
4)Passenger vehicles only (i.e., excluding commercial vehicles and motorcycles).
5)Calculated by the author from the National census (2015) and Automobile Inspection & Registration Information Association (2015).
Figure 2 Trend of older traffic accidents in Japan
Source : Transportation Bureau, Police Agency (2018), Statistics Bureau, Ministry of Internal Affairs and Communications (2018)
and physical abilities decline as we age, thus increasing the risk that older drivers will cause accidents (DucNghiem et al., 2016 ; Evans, 1991). Note that this does not imply that older adults should be prohibited from driving, especially in rural areas, which lack convenient public transportation as an alternative. Thus, it is an urgent task for us to introduce technologies and establish safe traffic systems with older drivers before entering the further aging society.
The remainder of the paper is organized as follows. Section 2 describes the purpose of this study and reviews the existing literature. Section 3 presents our estimation methods, and Section 4 describes the data. Section 5 discusses the estimation results. Lastly, Section 6 concludes the paper.
2. Purpose of the Study
This study examines the effects of public transportation, demographic factors, and the living environment on the number of traffic accidents, focusing particularly on the effects of population aging. There are two strands of literature in this field.
First, many studies have investigated how a driver’s age affects the risk and possibility of accidents. Such works have found that (i) the risks associated with older drivers are high (Caird et al., 2005 ; French et al., 1993), (ii) the number of accidents increases with age (Evans, 1991), and (iii) the fatality rate in the event of an accident increases with age (Islam and Mannering, 2006). In their research, Evans (1995) and Islam and Mannering (2006) used data on traffic accidents, including accidents involving older drivers. However, in order to determine the relationship between the behavior of older adults and the occurrence of traffic accidents, we must also include data on older adults who are not involved in such accidents. Caird et al. (2005) and French et al. (1993) surveyed drivers using a questionnaire survey. As a result, their samples include data on older adults who were not involved in accidents. Furthermore, in addition to drivers, traffic accidents can be caused by pedestrians or bicycles ; thus, we also need data on the demographic structure and road environment. In this study, we investigate the relationship between older drivers and traffic accidents, by area.
Second, numerous works have investigated how the attributes of roads and their surrounding environment affect the frequency of traffic accidents. Using the number of traffic accidents as the dependent variable, several factors (e.g., heavy traffic, many lanes, highway, and commercial area) have been identified as having a significant effect on the frequency of such accidents (Chengye and Ranjitkar, 2013 ; Morichi et al., 1993 ; Watanabe and Nakamura, 2015). Kishino and Myojin (1997) used a persontripsurvey6) to investigate the trends in traffic
accidents involving older adults in terms of hours and means of transportation (e.g., vehicle, ──────────────
6)A survey of daily traffic behavior in terms of purpose, means of transportation, and action time zone. Here, a trip refers to moving from a start point to a specified end point (destination).
motorcycle, and walk). Their findings show that the risk of an older adult being involved in a traffic accident is higher when they go to hospital on foot between 9 a.m. and 12 p.m. ; furthermore, between 8 p.m. and midnight, their mortality rate is three times higher than any other period. As such, the study identifies the means of transportation and hours in which older adults are more likely to encounter an accident. However, these studies do not examine the relationship between the frequency of traffic accidents and the convenience of public transportation in the corresponding area, nor do they consider the demographic structure of the area where accidents have occurred. In an aging society, having access to convenient public transportation is important for those who no longer find it easy to drive a vehicle. Additionally, the convenience of public transportation is related to the frequency of driving a vehicle ; thus, it is conceivable that it is also related to the occurrence of traffic accidents. Therefore, this is the focus of this study.
Using panel data on traffic accidents in Japanese municipalities, we empirically examine whether factors related to aging affect the incidence of traffic accidents. We use demographic data (e.g., the numbers of older adults and older households) as independent variables to identify the relationship between population aging and traffic accidents. In addition, we incorporate data on public transportation (e.g., the number of bus stops and train passengers) and on the living environment (e.g., the number of hospital beds and road construction cost). We employ fixedeffects and hybrid models, using the number of traffic accidents in a municipality as the dependent variable. By verifying the causes of traffic accidents, including causes related to aging, our findings contribute to the design of better traffic regulations and safety measures, which are necessary in an aging society.
3. Estimation Methods
This study uses municipal panel data for two time points, 2005 and 2015. A panel data analysis can distinguish between within and betweencluster variation, resulting in estimation results that are free of bias. Focusing on collisions at intersections, Dong et al. (2014) analyzed the factors of traffic accidents using panel data on 603 intersections, and the roads around the intersections, in five time points. In contrast, we examine all kinds of traffic accidents7). The
estimation equation is given by
#$'"!!!%"%"%$'!!&#&!&$!($!$$', (1)
where the dependent variable#$'is the number of traffic accidents in municipality $($=1, 2, . ──────────────
. . , n) in year(((=2005, 2015). The independent variables denoted by %'(vary with time, and
are as follows : population density, number and percentage of child residents, number and percentage of older residents, number of older households, number of older license holders, number of stations, number of passengers, number of vehicles owned, number of hospital beds, and road construction cost. The independent variable#'denotes the number of bus stops, which
also affects traffic accidents and is a timeinvariant variable of individual'; it varies between clusters, but not within clusters. Then, )'is a random effect, denoting the heterogeneity of
unobserved betweencluster variation, !, ", and #are parameter estimates, and %'(is an error
term.
A fixedeffects model is suitable when the independent variables and the random effect are correlated ("")'#%'(&#'#%"!). The model takes the difference from the mean. Thus, the
independent variable #'is eliminated from the estimation (#'%#'), because#'does not vary
with time and does not exhibit withincluster variation. The random effect )'is eliminated for a
similar reason ()'%)') (Stock and Watson, 2016). This is the biggest advantage of the fixed
effects model. Furthermore, because the model focuses on withincluster variation, the parameter it estimates is this variation (Wooldridge, 2016). On the other hand, a disadvantage of the model is that we cannot verify the effects of timeinvariant variables. In such a case, a hybrid model is useful, because it eliminates any omittedvariable bias, while retaining time invariant variables (Schunck and Perales, 2017 ; Miwa and Yamamoto, 2012). While the hybrid model is a type of randomeffect model, the equation uses the mean values of the variables, which may vary within clusters. Thus, it obtains results equivalent to those of a fixedeffects model.
When using a hybrid model, we need to make several assumptions. First, the unobserved heterogeneity )'and the mean of %'(over two periods, for each municipality%', are correlated
(Schunck and Perales, 2017) :
)'%$%'$*', (2)
where%'and*'are assumed to be uncorrelated (""*'#%'#%!). Then,
&'(%"%'($##'$)'$%'( (3)
%"%'($##'$$%'$*'$%'(, (4)
where the estimated parameter $is the difference between the within and betweencluster variation, and is defined as follows :
Thus, (4) can be rewritten as
&'(#!%'("!!!!!$"%'""#'")'"#'(. (6) The heterogeneity of unobserved betweencluster variation is controlled by %', and the
estimated parameter!is equivalent to the fixedeffects parameter !#":
!#!#"#!$. (7)
Thus, we have that
&'(#!$%'("!!!!!$"%'""#'")'"#'(. (8)
Moreover, (8) is rewritten as
&'(#!$!%'(!%'""!!%'""#'")'"#'(, (9)
where )'and #'(are composite error terms, identical to those in the randomeffects model. In
the hybrid model, using the deviation of timevarying variables %'(in the estimation equation
makes it possible to distinguish between within and betweencluster variation.
On the other hand, several previous studies have used Poisson or negativebinominal models to analyze traffic accidents (Chengye and Ranjitkar, 2013 ; Gianfranco et al., 2018 ; Watanabe and Nakamura, 2015). These models are suitable for zeroinflated count data. Although our dependent variable is a type of count data, the ratio of “0” is very low (0.8 percent in 2005, and 2.3 percent in 2015). Thus, we consider that fixedeffects and hybrid models are appropriate.
4. Data
The data are summarized in Table 1. Here, we analyze data on traffic accidents in Japan, taken from annual reports of traffic accident statistics. Although various types of data on traffic accidents exist, we examine the number of traffic accidents, because these are the only data disaggregated by municipality. Our sample contains data on 1861 municipalities8).
──────────────
8)In Japan, since the 2000s, many municipalities have been merged and divided. Therefore, in this analysis, for the municipalities that have been merged after 2005, we use the postunification municipality for the 2005 data. Conversely, for the municipalities that have been divided after 2005, we use the predivision municipality for the 2015 data. Additionally, five municipalities of Tomioka, Okuma, Futaba, Namie, and Iidate in the Fukushima Prefecture were excluded from the database because there were no residents after the 2011 Great East Japan Earthquake.
We select two points in time9), 2005 and 2015, to create the panel data. Data about the
population are obtained from the national census. We use the area of a municipality to calculate the population density. Here, “child residents” refers to the population of children aged 0 to 14, and “older residents” refers to adults aged 65 and older. The relative proportions of these two groups of the overall population are calculated by dividing their respective populations by the overall population. As pedestrians, children and older adults are more likely to be involved in traffic accidents10) than other age groups are ; therefore, these variables may have a positive
effect on traffic accidents. The number of older households is calculated as the sum of households comprising a single older person and those comprising an older married couple. The number of older people who hold a driver’s license is obtained from driver’s license statistics. Because these data are prefectural data, we divide the values proportionately to the municipalities’ older adult population. In addition, because data on the number of older people with a driver’s license were not available for 2005, we use the data for 2008 instead. The Road Traffic Act as it related to older drivers did not change between 2001 and 2009. Therefore, we consider the substitution to be appropriate. The numbers of older households and license holders may have a positive effect on traffic accidents.
Furthermore, improvements in public transportation services are considered to reduce traffic accidents. Therefore, we adopt the total number of railway stations and the total number of passengers in each municipality as independent variables. These data are obtained from the National Land Information, which contains data on the number of stations for 2006 and 2015. ──────────────
9)The National Census is conducted every five years.
10)The number of traffic accidents involving pedestrians per 1000 population, by age group, are as follows : age 0 to 14 : 5.1 ; age 16 to 64 : 3.7 ; age 65 and older : 5.3. Calculated by the author from the National census (2015) and Traffic Accident Statistics Annual Report (2015).
Table 1 Data summary
Data item Data source
Number of traffic accidents Traffic Accident Statistics Annual Report (2005, 2015) Density (population/area of
municipalities)
National Census (2005, 2015)
Area survey by prefectures and municipalities (2015) Population, Younger population, Older
population, Number of older households National Census (2005, 2015) Number of older license holders Driver’s license statistics (2008, 2015)
Number of passengers The number of passengers for each station data (2011, 2015) Number of stations Railway data (2006, 2015)
Number of vehicles owned Number of vehicles owned by prefecture and vehicle type (2005, 2015) Road construction cost Financial settlement situation by municipality (2004, 2005, 2014, 2015) Number of hospital beds Survey of Medical Institutions (2005, 2015)
Thus, we use the data for 2006 instead of that for 2005. For the same reason, we use data on the number of passengers for 2011 instead of that for 2005. The number of stations and passengers may have a negative effect on traffic accidents. In addition, we expect the number of bus stops to have a negative effect on traffic accidents. The number of bus stops includes those on bus routes operated by private companies and the public sector, as well as also those of community and ondemand buses. Community buses are managed by municipalities to ensure transportation is available for their residents. Ondemand bus services are also managed by municipalities, but are provided when required rather than operated on a schedule. Because we have data on the number of bus stops for 2010, we use this s a timeinvariant variable in the hybrid model. Next, the number of vehicles owned is prefectural data ; thus, we divide the values by the population over the age of 15 in each municipality. The number of vehicles owned may have a positive effect on traffic accidents. Finally, the road construction costs are obtained from the financial settlement records of each municipality ; here, we use the costs for 2004, 2005, 2014, and 2015 because we adopt lagged variables in the estimations. Improvements to roads may reduce traffic accidents.
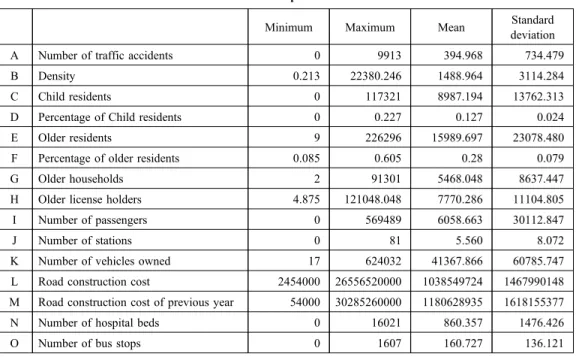
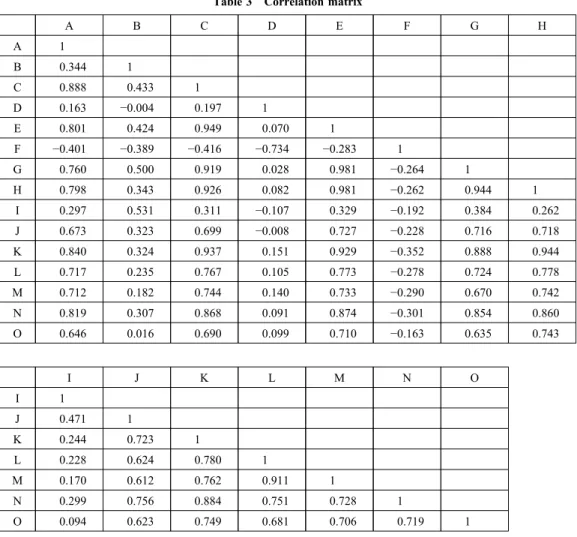
The number of hospital beds is measured as the number of beds in all hospitals located in a municipality. Here, we use the number of beds in a hospital as a proxy for hospital size, and consider that people drive often to a hospital to visit family or friends, which leads to greater number of traffic accidents. Table 2 presents the descriptive statistics, and Table 3 presents correlation matrix. Variables related to the population are highly correlated with each other. In
Table 2 Descriptive statistics
Minimum Maximum Mean deviationStandard
A Number of traffic accidents 0 9913 394.968 734.479
B Density 0.213 22380.246 1488.964 3114.284
C Child residents 0 117321 8987.194 13762.313
D Percentage of Child residents 0 0.227 0.127 0.024
E Older residents 9 226296 15989.697 23078.480
F Percentage of older residents 0.085 0.605 0.28 0.079
G Older households 2 91301 5468.048 8637.447
H Older license holders 4.875 121048.048 7770.286 11104.805
I Number of passengers 0 569489 6058.663 30112.847
J Number of stations 0 81 5.560 8.072
K Number of vehicles owned 17 624032 41367.866 60785.747
L Road construction cost 2454000 26556520000 1038549724 1467990148
M Road construction cost of previous year 54000 30285260000 1180628935 1618155377
N Number of hospital beds 0 16021 860.357 1476.426
particular, the numbers of older households and older license holders are strongly correlated, each of which is estimated separately. In addition, we conduct separate estimations for those variables that did not have data for the applicable year and/or municipality.
5. Results
5.1 Fixed-effects model
First, we estimate both a randomeffects model and a fixedeffects model11). Then, we verify the
estimation using the Hausman test, which reveals that a fixedeffects model should be adopted for all estimates. In addition, the correlation between the random effect #"and the value !!,
obtained by multiplying the independent variable by the estimated parameter, is high. This ──────────────
11)We use Stata/SE 15. for the analysis.
Table 3 Correlation matrix
A B C D E F G H A 1 B 0.344 1 C 0.888 0.433 1 D 0.163 −0.004 0.197 1 E 0.801 0.424 0.949 0.070 1 F −0.401 −0.389 −0.416 −0.734 −0.283 1 G 0.760 0.500 0.919 0.028 0.981 −0.264 1 H 0.798 0.343 0.926 0.082 0.981 −0.262 0.944 1 I 0.297 0.531 0.311 −0.107 0.329 −0.192 0.384 0.262 J 0.673 0.323 0.699 −0.008 0.727 −0.228 0.716 0.718 K 0.840 0.324 0.937 0.151 0.929 −0.352 0.888 0.944 L 0.717 0.235 0.767 0.105 0.773 −0.278 0.724 0.778 M 0.712 0.182 0.744 0.140 0.733 −0.290 0.670 0.742 N 0.819 0.307 0.868 0.091 0.874 −0.301 0.854 0.860 O 0.646 0.016 0.690 0.099 0.710 −0.163 0.635 0.743 I J K L M N O I 1 J 0.471 1 K 0.244 0.723 1 L 0.228 0.624 0.780 1 M 0.170 0.612 0.762 0.911 1 N 0.299 0.756 0.884 0.751 0.728 1 O 0.094 0.623 0.749 0.681 0.706 0.719 1
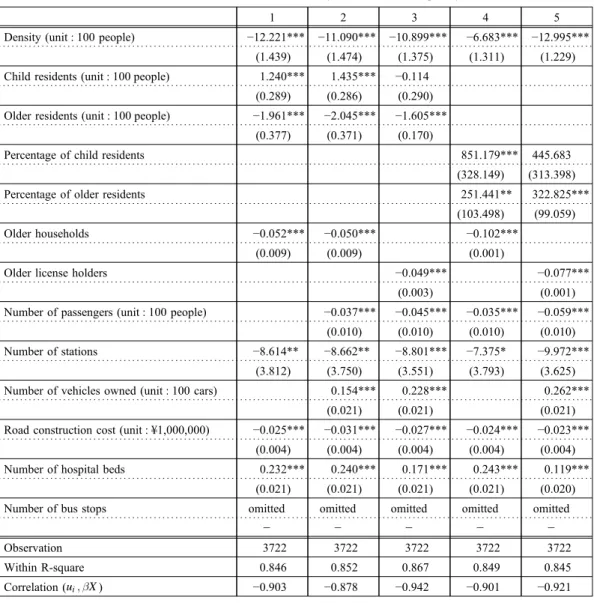
shows the correlation between the unobserved and the observed variables (Miwa, 2013). Therefore, a fixedeffects model is suitable for this estimation. The results for the random effects model are omitted for brevity. Table 3 shows the estimation results for the frequency of traffic accidents. The first column uses only those variables for which data were available for the applicable year and municipality. The second column adds two further variables, and checks whether they have an effect. The third column replaces older households with older license holders. Finally, the fourth and fifth columns use the percentages of child and older residents.
Table 4 Fixed-effects model for analysis of accident frequency
1 2 3 4 5
Density (unit : 100 people) −12.221*** −11.090*** −10.899*** −6.683*** −12.995***
(1.439) (1.474) (1.375) (1.311) (1.229)
Child residents (unit : 100 people) 1.240*** 1.435*** −0.114 (0.289) (0.286) (0.290) Older residents (unit : 100 people) −1.961*** −2.045*** −1.605***
(0.377) (0.371) (0.170)
Percentage of child residents 851.179*** 445.683
(328.149) (313.398)
Percentage of older residents 251.441** 322.825***
(103.498) (99.059)
Older households −0.052*** −0.050*** −0.102***
(0.009) (0.009) (0.001)
Older license holders −0.049*** −0.077***
(0.003) (0.001)
Number of passengers (unit : 100 people) −0.037*** −0.045*** −0.035*** −0.059***
(0.010) (0.010) (0.010) (0.010)
Number of stations −8.614** −8.662** −8.801*** −7.375* −9.972***
(3.812) (3.750) (3.551) (3.793) (3.625)
Number of vehicles owned (unit : 100 cars) 0.154*** 0.228*** 0.262***
(0.021) (0.021) (0.021)
Road construction cost (unit : ¥1,000,000) −0.025*** −0.031*** −0.027*** −0.024*** −0.023***
(0.004) (0.004) (0.004) (0.004) (0.004)
Number of hospital beds 0.232*** 0.240*** 0.171*** 0.243*** 0.119***
(0.021) (0.021) (0.021) (0.021) (0.020)
Number of bus stops omitted omitted omitted omitted omitted
− − − − −
Observation 3722 3722 3722 3722 3722
Within Rsquare 0.846 0.852 0.867 0.849 0.845
Correlation (#""!!) −0.903 −0.878 −0.942 −0.901 −0.921
Note : Unit of density, child residents, older residents and number of passengers are per 100 people. Unit of number of vehicles owned is per 100 cars. Unit of road construction cost is per ¥1,000,000. Values in parentheses are standard errors. The superscripts ***, **, *indicate statistical significance at the 1 percent, 5 percent, and 10 percent levels.
The estimation results reveal that several variables are significant12). First, the higher is the
population density, the less frequently traffic accidents occur. In densely populated areas, the facilities that people need frequently are often available within walking distance of people’s residences ; thus, there is less need to own a private vehicle. It is also possible that fewer accidents occur in dense areas as a result of drivers’ riskaversion behavior, because driving in such areas requires greater care. Conversely, in less dense areas, drivers’ riskcompensation behavior may increase the frequency of traffic accidents.
The estimates from the first and second columns reveal that the larger the number of child residents, the larger the frequency of accidents. In all countries, children are known to be at a greater risk than other age groups are of being involved in an accident. However, despite its importance, our estimation results show that this issue has yet to be resolved satisfactorily. Next, the relationship between the frequency of traffic accidents and the number of older residents is negative and significant at the 1% level, as are those with the numbers of older households and older license holders. This is an unexpected result, because the percentage of accidents involving older residents has been increasing in Japan, owing to its aging society. We are particularly interested in the number of older license holders, because traffic accidents involving or caused by this group are a major problem. It may be that safety measures related to older drivers are effective in decreasing the number of accidents in which they are involved. The training of older drivers has been regulated since 2001 by the Road Traffic Act, Article 1014, which states that a person must update his/her driver’s license when 70 years old or older. In addition, we expected the frequency of accidents to increase with the number of older households, who need to do their own shopping, and so must go out frequently. The estimates from the fourth and fifth columns support this expectation, consistent with the recent trend in Japan. The statistics on traffic accidents show that the absolute number of accidents involving older residents is decreasing ; however, the percentage of accidents involving this group is increasing, because the number of traffic accidents is decreasing overall.
With regard to the effects of public transportation on the frequency of traffic accidents, we find the following. First, the number of passengers has a negative and significant relation with the frequency of traffic accidents. Similarly, the number of stations is inversely related to the frequency of traffic accidents. These results indicate that the convenience of public transport is effective in decreasing traffic accidents. In an area where many people use trains, there is less need to drive a vehicle. Conversely, in an area not serviced by convenient public transport, people are more likely to drive their own vehicles. Such areas tend to be rural in nature, where many public transport services are no longer running or are being reduced in scope, thus ──────────────
12)Some variables have high correlations (e.g., child residents and older residents, older residents and older households). Thus, we excluded variables of child residents and older households from estimations, but these additional estimations did not affect the results of our analysis in Table 4.
increasing the dependence on private vehicles. Our results show that the number of owned vehicles is positively and significantly related to the frequency of accidents at the 1% level. Thus, municipalities in which more residents need to drive their own vehicles experience a higher frequency of traffic accidents. Recall that the number of owned vehicles per person is higher in rural areas than it is in urban areas. Therefore, it is possible that rural areas, with their less convenient public transportation systems, experience a greater number of accidents. The number of bus stops does not vary over time ; thus, we are not able to determine its effect on the number of accidents.
The higher the road construction cost, the lower the frequency of traffic accidents. Thus, an investment in road construction could decrease the incidence of traffic accidents. Table 4 shows only those costs for the applicable year ; however, the costs from the previous year also have a negative and significant relation with the frequency of traffic accidents, which is a good reflection of the existing safety measures. Finally, the relation between the number of hospital beds and the frequency of accidents is statistically positive and significant at the 1% level in all estimations. This variable indicates the size of a hospital in a municipality. Larger hospitals also attract patients (and, thus, visitors) from outside the municipality. As a result, we expect to the frequency of accidents to increase in areas with larger hospitals.
We have analyzed the factors that affect the frequency of traffic accidents from a population dynamics perspective and by considering the living environment of each municipality. It is important to identify the effect of a population change on the frequency of traffic accidents. However, we cannot do so here, because the data do not vary over time. The fixedeffects model eliminates unobserved heterogeneity and the timeinvariant variable. Therefore, we cannot analyze the effect of the number of bus stops on traffic accidents. Here, we use the number of bus stops as a proxy for the convenience of a municipality’s public transportation system. In addition, the fixedeffects model focuses on withincluster variation, and so cannot be used to estimate betweencluster variation. Hence, in the next section, we use a hybrid model to estimate the timeinvariant variable and the betweencluster variation.
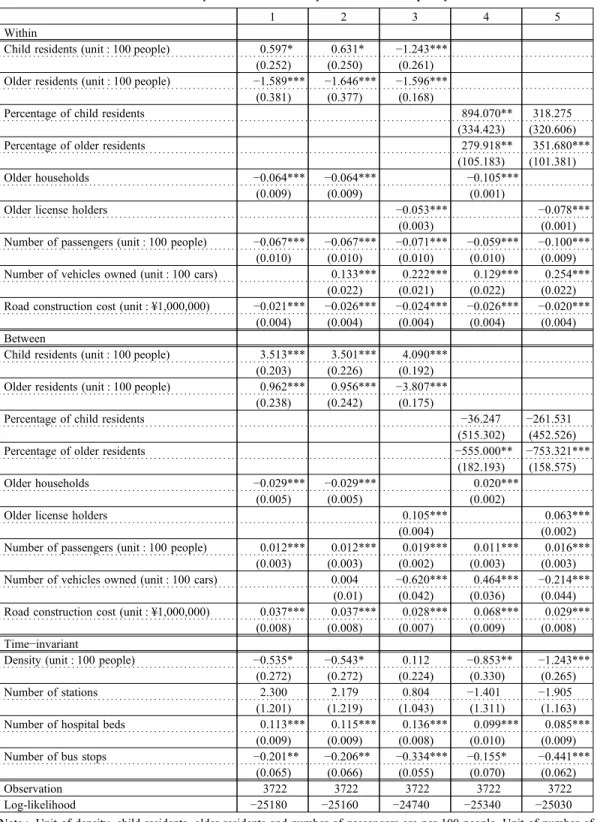
5.2 Hybrid models
Tables 5 shows the estimation results for the frequency of traffic accidents based on the hybrid models. The top rows show the withincluster variation, the middle rows show the between cluster variation, and the bottom rows show the timeinvariant variables. Because the change ratio of the density, number of hospital beds, and number of stations are small, STATA adjudges these variables to be time invariant. The panel data are based on two time points, between which, the living environment may not have changed significantly ; thus, the changes ratio tend to be small. The columns in Table 5 are defined in the same way as those in Table 4. The estimation results for the withincluster variation are equivalent to those of the fixed
Table 5 Hybrid models for analysis of accident frequency
1 2 3 4 5
Within
Child residents (unit : 100 people) 0.597* 0.631* −1.243*** (0.252) (0.250) (0.261) Older residents (unit : 100 people) −1.589*** −1.646*** −1.596***
(0.381) (0.377) (0.168)
Percentage of child residents 894.070** 318.275
(334.423) (320.606)
Percentage of older residents 279.918** 351.680***
(105.183) (101.381)
Older households −0.064*** −0.064*** −0.105***
(0.009) (0.009) (0.001)
Older license holders −0.053*** −0.078***
(0.003) (0.001)
Number of passengers (unit : 100 people) −0.067*** −0.067*** −0.071*** −0.059*** −0.100***
(0.010) (0.010) (0.010) (0.010) (0.009)
Number of vehicles owned (unit : 100 cars) 0.133*** 0.222*** 0.129*** 0.254***
(0.022) (0.021) (0.022) (0.022)
Road construction cost (unit : ¥1,000,000) −0.021*** −0.026*** −0.024*** −0.026*** −0.020***
(0.004) (0.004) (0.004) (0.004) (0.004)
Between
Child residents (unit : 100 people) 3.513*** 3.501*** 4.090*** (0.203) (0.226) (0.192) Older residents (unit : 100 people) 0.962*** 0.956*** −3.807***
(0.238) (0.242) (0.175)
Percentage of child residents −36.247 −261.531
(515.302) (452.526)
Percentage of older residents −555.000** −753.321***
(182.193) (158.575)
Older households −0.029*** −0.029*** 0.020***
(0.005) (0.005) (0.002)
Older license holders 0.105*** 0.063***
(0.004) (0.002)
Number of passengers (unit : 100 people) 0.012*** 0.012*** 0.019*** 0.011*** 0.016***
(0.003) (0.003) (0.002) (0.003) (0.003)
Number of vehicles owned (unit : 100 cars) 0.004 −0.620*** 0.464*** −0.214***
(0.01) (0.042) (0.036) (0.044)
Road construction cost (unit : ¥1,000,000) 0.037*** 0.037*** 0.028*** 0.068*** 0.029***
(0.008) (0.008) (0.007) (0.009) (0.008)
Time−invariant
Density (unit : 100 people) −0.535* −0.543* 0.112 −0.853** −1.243***
(0.272) (0.272) (0.224) (0.330) (0.265)
Number of stations 2.300 2.179 0.804 −1.401 −1.905
(1.201) (1.219) (1.043) (1.311) (1.163)
Number of hospital beds 0.113*** 0.115*** 0.136*** 0.099*** 0.085***
(0.009) (0.009) (0.008) (0.010) (0.009)
Number of bus stops −0.201** −0.206** −0.334*** −0.155* −0.441***
(0.065) (0.066) (0.055) (0.070) (0.062)
Observation 3722 3722 3722 3722 3722
Loglikelihood −25180 −25160 −24740 −25340 −25030
Note : Unit of density, child residents, older residents and number of passengers are per 100 people. Unit of number of vehicles owned is per 100 cars. Unit of road construction cost is per ¥1,000,000. Values in parentheses are standard errors. The superscripts ***, **, * indicate statistical significance at the 1 percent, 5 percent, and 10 percent levels.
effects model ; accordingly, we focus on the timeinvariant variable and the betweencluster variation. First, the relation between the number of bus stops and the frequency of accidents is negative and statistically significant in all estimations, implying that the convenience of public transportation affects the frequency of traffic accidents. In Japan, many bus routes are no longer being serviced, owing to budget deficits and fewer passengers as a result of the aging population. Therefore, more people are driving their own vehicles, further reducing the number of bus passengers and bus stops. This is particularly problematic for older adults, who cannot walk as far to reach a bus stop, and so must drive to reach shops, doctors, and so on. These results show that areas with better public transport systems have fewer traffic accidents. Thus, even in the event of a budget deficit, maintaining public transport plays an important role.
For the betweencluster variation, the results reveal that municipalities with aboveaverage numbers of child and older residents experience more traffic accidents than other municipalities do. First and second columns show that the betweencluster variation is positive and significant at the 1% level for the numbers of child and older residents, as is the withincluster variation for the number of child residents. However, the estimated parameter for the betweencluster variation is larger than that of the withincluster variation, indicating that a larger number of child residents in a municipality has a greater effect on the number of accidents than population variation does. On the other hand, more accidents occur in municipalities with a high older population, although the number of traffic accidents decreases with an increase in the age of the population. In terms of the withincluster variation, a higher percentage of older residents is associated with a higher frequency of accidents. For the betweencluster variation, municipalities with an aboveaverage percentage of older residents have fewer traffic accidents than other municipalities do. Municipalities with a high percentage of older residents tend to be rural, which experience fewer accidents than urban areas do. Betweencluster variation does not eliminate inherent individual factors. Therefore, we consider that the rural effect dominates that of having a high proportion of older adults in the population.
6. Conclusion
In this study, we use panel data on traffic accidents in Japan to empirically examine the factors that affect the frequency of traffic accidents in each municipality. We estimate the frequency of traffic accidents using two methods. The first employs a fixedeffects model, and the second uses a hybrid model. The number of traffic accidents in each municipality is the dependent variable. Our estimates include factors related to population aging. Prior studies on the risks associated with older adult drivers tend to focus on drivers who have had an accident, or consider the driver only. However, to identify the relation between older people and traffic accidents, we also need data on older adults who have not been involved in an accident, and
those who live in surrounding areas. Therefore, we include data on older adults who live in areas in which accidents have occurred, which resolves any remaining sample selection bias. Moreover, few studies have investigated how the convenience of public transportation affects traffic accidents. The convenience of public transportation is low in rural areas, making private vehicles indispensable to residents’ daily lives. In addition, these areas have higher ratios of older adults in the population, and thus more older drivers. Therefore, it is possible that the convenience of public transportation affects the number of traffic accidents in a municipality ; thus, we focus on this effect here.
Our results reveal that municipalities with higher population densities have fewer traffic accidents. Such municipalities tend to be urban in nature, with required amenities often within walking distance, making private vehicles less necessary. Furthermore, we find that the number of older residents has a negative and significant effect on the frequency of accidents. The number of accidents caused by older people decreases with the overall number of accidents. This is affected particularly by improvements in safety technology and stronger traffic laws. Nevertheless, having a higher percentage of older residents tends to increase the frequency of traffic accidents. Japan is an aging society. Thus, it is conceivable that the proportion of traffic accidents caused by older residents will increase as the population continues to age. In addition, our estimation shows that the number of hospital beds is positive and significant. In general, older people tend to go to hospitals more often than younger people do. The hospitalization rate (i.e., the number of people hospitalized because of injury or sickness per 1000 population) in Japan is 390.2. However, for those aged 65 and older, this rate is 686.7, and for those aged 75 and older, the rate increases to 727.8 (Ministry of Health, Labor and Welfare, 2016). This greatly exceeds the overall rate for the population. As noted earlier, in all areas except Tokyo metropolitan areas, older people go shopping by driving their own vehicles. It is conceivable that it is same when visiting a hospital. Because older people tend to visit hospitals more frequently, they are at greater risk of being involved in a traffic accident. Note that we could not analyze the effect of shopping on traffic accidents ; this is left to future work. Public transportation plays an important role in the number of traffic accidents. Our results show that municipalities with more bus stops and passengers have fewer accidents. Conversely, the number of vehicles owned has a positive and statistically significant relation with traffic accidents. These results imply that traffic accidents could be reduced if more people use public transportation.
However, public transportation services in rural areas are being canceled or reduced, owing to budget deficits resulting from the aging population. The Housing and Land Survey shows that 33% of houses are more than 2 km from the nearest station. As a result, rural residents are more likely to drive, with older adults being no exception. Traffic accidents caused by older drivers are becoming a serious problem in Japan, where the training of such drivers when
updating their licenses is regulated by the Road Traffic Act. If a driver does not pass the training and test, his/her license is revoked. Our results reveal that the number of older license holders has a negative and significant relation with the frequency of traffic accidents. The law related to training older drivers was enacted in 1998, and subsequently made stricter in a revision. In addition, the Japanese government is considering a new system for drivers over the age of 75 that restricts them to driving vehicles with safety functions. It may be that training older drivers is effective in terms of reducing the number of traffic accidents in which they are involved. However, fewer than 1% of trainees fail the test. Furthermore, older adults in rural areas need a private vehicle for transport. Thus, their licenses cannot simply be removed. Instead, we need to improve relevant safety measures to prevent such accidents. Furthermore, we need to secure a convenient alternative means of transportation for older adults, especially those in rural areas. On the other hand, local public transportation operators are struggling under budget deficits, and in urban areas, tend to lack sufficient drivers. Therefore, increasing the number of transport systems is not straightforward. Tanaka (2009) investigated public transportation issues, focusing on older residents in rural areas. The study found that maintaining a bus route places a significant financial burden on municipalities ; thus, a municipality’s public transportation system must be appropriate for its size. As a potential solution, ondemand buses provide a convenient means of transport for older adults, and do not require a large budget. Because these buses are provided only when necessary, they better meet the needs of users. Furthermore, these buses provide a doortodoor service, making them particularly convenient. Thus, to better prepare for the continued aging of the population, we need to introduce technologies and establish safe traffic systems for older adults that provide realistic alternatives to driving a private vehicle.
Acknowledgements
The author would like to thank professors Keisaku Higashida and Hisaki Yamaga from Kwansei Gakuin University for their useful comments and constructive suggestions to improve the paper. Also, I am grateful to anonymous referees. This research is supported by Research Institute of Economy, Trade and Industry (RIETI).
References
Automobile Inspection & Registration Information Association, 2005 and 2015, “Number of vehicles owned by prefecture and vehicle type.”
Cabinet Office, 2018, “Annual Report on the Ageing Society.”
Caird, J, Edwards, C and Creaser, J, 2005, “Older Driver Failures of Attention at Intersections : Using Change Blindness Methods to Assess Turn Decision Accuracy,” HUMAN FACTORS, 47(2) : 235249.
Chengye, P and Ranjitkar, P, 2013, “Modelling Motorway Accidents using Negative Binomial Regression,” Journal of
the Eastern Asia Society for Transportation Studies, 10 : 19461963.
Dong, C, Clarke, D, Yan, X, Khattak, A and Huang, B, 2014, “Multivariate randomparameters zeroinflated negative binomial regression model : An application to estimate crash frequencies at intersections,” Accident Analysis and
DucNghiem, N, HoangTung, N, Kojima, A and Kubota, H, 2016, “Traffic safety of elderly road user : The global trend and the Japanese case,” Journal of Japan Society of Civil Engineers, Ser. D3 (Infrastructure Planning and Management,) 72(5) Special Issue : 12491264.
Evans, L, 1991, “Older driver risks to themselves and to other road users,” Transportation Research Record, 1325 : 34 41.
French, D, West, R, Elander, J and Wilding, J, 1993, “Decisionmaking style, driving style, and selfreported involvement in road traffic accidents,” ERGONOMICS, 36(6) : 627644.
Geospatial Information Authority of Japan, Ministry of Land, Infrastructure, 2015, “Transport and Tourism, Area Survey by Prefectures and Municipalities.”
Gianfranco, F, Soddu, S and Fadda, P, 2018, “An accident prediction model for urban road networks,” JOURNAL OF
TRANSPORTATION SAFETY & SECURITY, 10(4) : 387405.
Institute for Traffic Accident Research and Data Analysis, 2005 and 2015, “Traffic Accident Statistics Annual Report.” Islam, A and Mannering, F, 2006, “Driver aging and its effect on male and female singlevehicle accident injuries :
Some additional evidence,” Journal of Safety Research, 37 : 267276.
Kishino, K and Myojin, S, 1993, “An Analysis of Traffic Accident of the Elderly,” Proceedings of infrastructure
planning, 14 : 695701.
Kitamura, Y, 2005, Panel data analysis, Iwanami Shoten.
Ministry of Health, Labor and Welfare, 2005 and 2015, “Survey of Medical Institutions.”
Ministry of Internal Affairs and Communications, 2014, “List of designated cities,” (http : //www.soumu.go.jp/main_ sosiki/jichi_gyousei/bunken/shitei_toshiichiran.html, 9/11/2019.)
Ministry of Land, Infrastructure, Transport and Tourism, 2018, “White paper on land, infrastructure, transport and tourism in Japan.”
Miwa, S, 2013, “Panel data basics and applications,” Sociological Theory and Methods, 28(2) : 355366.
Miwa, S and Yamamoto, K, 2012, “The “WithinSubject” Effects of Intragenerational Class Mobility on Subjective Social Status,” Sociological Theory and Methods, 27(1) : 6383.
Morichi, S, Hyodo, T and Hamaoka, H, 1993, “A study on traffic accident analysis based on GIS,” Journal of Japan
Society of Civil Engineers, 16(1) : 961968.
National Institute of Population and Social Security Research, 2015, “Regional Population Projections for Japan.” National Land Information Division, National Spatial Planning and Regional Policy Bureau, Ministry of Land,
Infrastructure, 2006 and 2015, “Railway data.”
National Land Information Division, National Spatial Planning and Regional Policy Bureau, Ministry of Land, Infrastructure, 2010, “Bus stop data.”
National Land Information Division, National Spatial Planning and Regional Policy Bureau, Ministry of Land, Infrastructure, 2011 and 2015, “The number of passengers for each station data.”
Nihon Bus Association, 2018, “Japanese bus business.”
Oguchi, T, 2016, “Achieving safe road traffic the experience in Japan,” IATSS Research, 39 : 110116.
Schunck, R and Perales, F, 2017, “Within and betweencluster effects in generalized linear mixed models : A discussion of approaches and the xthybrid command,” The Stata Journal, 17 : 89115.
Statistics Bureau, Ministry of Internal Affairs and Communications, 2013, “Housing and Land Survey.” Statistics Bureau, Ministry of Internal Affairs and Communications, 2018, “Population Census.” Statistics Bureau, Ministry of Internal Affairs and Communications, 2005 and 2015, “National Census.”
Statistics Bureau, Ministry of Internal Affairs and Communications, 2004, 2005, 2014 and 2015, “Financial settlement situation by municipality.”
Stock, J and Watson, M, 2007, Introduction to Econometrics, 2nd edition, Pearson Education. (Translated by Miyao, R, 2015, Kyoritsu Shuppan.)
Tanaka, K, 2009, “Issues and Reviews of Public Transportation in Intermediate and Mountainous Areas,” Association of
Economic Geographers, 55 : 3348.
Transportation Bureau, Police Agency, 2018, “Traffic accident occurrence situation of Statistics on road traffic.” Transportation Bureau, Driver’s License Division, National Police Agency, 2005, 2008 and 2015, “Driver’s license
statistics.”
Watanabe, K and Nakamura, H, 2015 “Statistical model analysis on traffic accident factors based on road traffic and social environmental conditions,” Journal of Japan Society of Civil Engineers, Ser. D3 (Infrastructure Planning and Management), 71(5) : 889901.
Wooldridge, J, 2016, Introductory Econometrics : A Modern Approach, 6th edition, Cengage Leaning.