Japan Advanced Institute of Science and Technology
JAIST Repository
https://dspace.jaist.ac.jp/Title Meta-synthesis Approach to Exploring Constructing Integrated Transportation System in China
Author(s) Xijin, TANG; Kun, NIE; Yijin, LIU Citation
Issue Date 2005-11
Type Conference Paper
Text version publisher
URL http://hdl.handle.net/10119/3827
Rights ⓒ2005 JAIST Press
Description
The original publication is available at JAIST Press http://www.jaist.ac.jp/library/jaist-press/index.html, IFSR 2005 : Proceedings of the First World Congress of the International
Federation for Systems Research : The New Roles of Systems Sciences For a Knowledge-based Society : Nov. 14-17, 2037, Kobe, Japan, Symposium 4, Session 1 : Meta-synthesis and Complex Systems Meta-synthesis Approach
Meta-synthesis Approach to Exploring Constructing Integrated Transportation System in
China
Xijin TANG1 Kun NIE1 2 and Yijin LIU1
1Academy of Mathematics and Systems Science
Chinese Academy of Sciences, Beijing 100080 PRCHINA {xjtang, niekun, yijunliu}@amss.ac.cn
2School of Knowledge Science, Japan Advanced Institute of Science and Technology
1-1 Asahidai, Nomi, Ishikawa 923-1292, JAPAN ABSTRACT
In this paper, meta-synthesis system approach is applied to a consulting project on exploring constructing integrated transportation system in China. A series of group argumentations had been held to discuss what the concerned topics were. Group argumentation environment (GAE) is applied to help such group divergent thinking process for developing qualitative hypotheses for further analytical work. With some assumptions, a multi-agent system model is then developed for passenger traffic simulation to show the different response in transportation system based on different conditions such as passenger behaviors, system capacity, travel distance and traffic price. Instead of solving traditional transportation problems, such kind of work aims to provide a different perspective toward transportation planning research in China.
Keywords: meta-synthesis, group argumentation, multi-agent system, simulation, transportation
1. INTRODUCTION
Transportation system is a typical complex system. Currently in China five available transportation modes, railway, highway, airway, waterway and pipe lines, are independently managed by different government departments based on their own strategic goals. To meet the continuously increasing demands from the socioeconomic development for a harmony and well-off living society, a national integrative transportation system instead of individual operating units for different transportation modes has been under consideration to deal with a number of problems in the current national transportation framework [1]. Both traditional and emerging problems, such as structure conflicts, bring uncertainties toward the development of each transportation mode and construction of comprehensive transportation. A variety of research towards this focus had been undertaken, one of which was on theory, directions and methods about the integrated transportation system construction, which was expected
to provide guidelines and coordination for other practical research work. The participants with diverse disciplines for such research project held many discussion meetings to exchange opinions and define the pathway toward the project goals; even there are many discussions about the definition and contents of a so-called integrated or comprehensive transportation system, which is obviously totally different from an aggregation of current 5 independent transportation systems. Such kind of opinion exchange meetings facilitates participants to think of many original diverse ideas about what kind of an integrated transportation system is appropriate for the national development and move outward into a variety of perspectives.
In this paper, a computerized tool group argumentation
environment (GAE) is applied to help such group
divergent thinking process and analyze those brainstorming results for developing qualitative hypothesis for further analytical work, which is the initial step to apply meta-synthesis system approach to the issue of constructing integrated transportation system. Then a multi-agent system model is developed for passenger traffic simulation to show the different response in transportation system based on different conditions such as passenger behaviors, system capacity, travel distance and traffic price. Instead of solving traditional transportation problems, such modeling by rule aims to provide a different perspective toward transportation planning research in China. At first, basic ideas of meta-synthesis approach to issue of constructing integrated transportation system is addressed.
2. META-SYNTHETIC MODELING TOWARD CONSTRUCTING INTEGRATED
TRANSPORTATION SYSTEM
Proposed by the Chinese system scientist Qian Xuesen (Tsien HsueShen) around early 1990s, meta-synthesis system approach (MSA) is oriented to tackle with complex system problems. The method emphasizes the synthesis of collected information and knowledge of
various kinds of experts, and combining quantitative methods with qualitative knowledge. Transportation system is a giant complex system, even considering individual transportation mode. Lots of different kinds of modeling work have been done toward different topics and issues in different kinds of transportation system under different purposes. Research on multi-modal or inter-modal transportation modeling has also been done while is only regarded as a good start of combination of two transportation modes in practice. How to build an integrated transportation system is a big issue in discussion due to different perspectives by different domain experts and managers who are affected by their own departmental interests and knowledge scopes. It is necessary to develop a systemic scenario about the concerned issue instead from one perspective. Then meta-synthesis system approach is applied.
Mainly, there are three kinds of meta-synthesis, i) qualitative meta-synthesis; ii) qualitative-quantitative meta-synthesis; iii) meta-synthesis from qualitative hypothesis to quantitative validation [2]. Qualitative meta-synthesis produces assumptions or hypotheses about the unstructured problems, i.e. to expose some qualitative relations or structures of the concerned problems. A variety of computerized tools, such as group support systems (GSS), creativity support systems, could be used to support idea generation which is the origin for qualitative meta-synthesis. The second kind of meta-synthesis denotes to conduct quantitative analysis based on assumptions drawn from qualitative meta-synthesis. This kind of work is what system analysts and system engineering people do in their daily work and have already been studied widely and deeply, and supported by most DSS and expert systems from AI field [3]. The third kind of meta-synthesis is to validate the results from the second one. If the validation is successful, solutions toward original unstructured problem are acquired. If not, new perspectives need to be explored by three kinds of meta-synthesis for another structuring process.
According to meta-synthetic modeling strategies referred in [4], 6 categories of modeling activities may be undertaken for different facets of integrated transportation system.
I. Modeling by mechanism, such as econometric models to predict the whole year operation of national economy or specific economic zone, input-output models for demand forecast of transportation capacity, etc.
II. Modeling by analogy. For example, for strategic development of national transportation system, considering the situations of other countries, such as USA and Japan as their per capita incomes were
over 1000 US dollars. Case based reasoning is also an advanced technique.
III. Modeling by data, such as various statistic models which could be developed to forecast traffic increase, etc.
IV. Modeling by learning, such as those knowledge discovery and data-mining models. Modeling by learning is still based on data, while it emphasizes a higher level work to expose hidden knowledge embedded in large amount of data. Human involvement is also emphasized to absorb experts’ knowledge for improvement of modeling process. Neural network models belong to this category and could also be used in forecasting.
V. Modeling by rule. This category refers to multi-agent system (MAS) simulations which have offered an interesting methodological issue and an innovative tool for specifying and validating behavioral individual models that are believed to be the origin of emergent social and organizational phenomena during the last decade. Given different rules about individual (agent) behaviors, the behaviors of macro system which is consisted of collective agents may be changing. Such kind of rule-based modeling may serve as a means to test some assumptions, design and examine what will be happened.
VI. Modeling by evolutionary scenario, such as evolutionary models, which may be helpful to investigate and explore the complexity, such as chaos and fractal, in transportation and economy. Above modeling activities may be under assumptions given by qualitative meta-synthesis. Next our developed computerized tool is applied to support group brainstorming for new ideas about comprehensive transportation, which may then justified by quantitative validation.
3. GROUP ARGUMENTATION FOR QUALITATIVE HYPOTHESIS ABOUT INTEGRATED TRANSPORTATION SYSTEM In the consulting project, the participants with diverse disciplines actually include 3 kinds of people, system researchers, management researchers and representatives (analysts) from 3 major transportation modes, railway, highway and airway. Initially, many discussions had been held concerning how to undertake the theoretical research, to which direction, even the definition of integrated transportation system and possible problems. Here we apply one kind of creativity support system Group Argumentation Environment (GAE) to analyze the discussions, which may show the
effectiveness of computerized support for tacit knowledge transfer. As to introduction and details of GAE, please refer to [5].
For better understanding, here we use one group meeting held on October 10, 2002 for demonstration. That meeting is the first group meeting for research. All opinions are summarized into 51 utterances contributed by five participants, whose ID used in GAE is yzliu,
wyang, lihong, ybyang and huo respectively.
Figure 1 shows the visualized structure of whole discussion, which indicates concerns of four participants (yzliu, wyang, lihong, and ybyang) are closer while the ideas of huo’s are much different from others’, since
huo situates far away from the other four participants.
Figure 2 shows a visualized utterances’ structure based on submission sequence. User yzliu contributed 30 utterances, and was the most influential participant during the discussion. Those visualized maps shown in both common viewer and personalized viewer are expected to stimulate participants’ further thinking about the topics and expand the group thinking space.
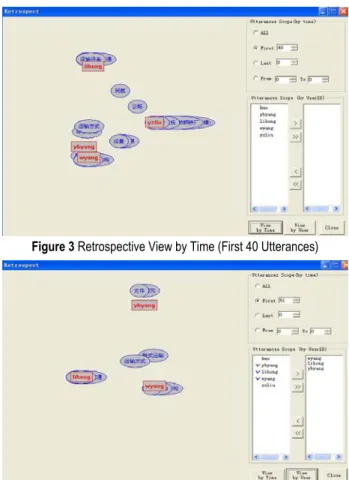
Since it is not an on-line case, retrospective viewer can help participants and others to review the whole process
by a variety of alternatives. Figure 3 displays the group thinking structure based on first 40 utterances, while User huo has not submitted any utterances; concerns of User wyang and ybyang are closer, whatever may not be supported by spatial relations existed only among three participants wyang, lihong, and ybyang, as shown in Figure 4. Such kind of analysis may help to detect micro-community among the participants and then serve as references for selection of appropriate participants in avoid of groupthink during group idea generation process later.
Besides procedural support for group argumentation, GAE also fulfills information processing for outcome analysis, one of which is clustering of all utterances into affinity groups based on the spatial map acquired from personal viewer (Figure 2). Figure 5 shows the affinity list in part as the whole utterance set is categorized into 26 cells via a 16×16 segmentation of the spatial map. The utterances fall into one cell are regarded as one group. Automatic affinity list could be regarded as a rough clustering about participants’ opinions during the brainstorming session. Further processing by human experts could be taken to acquire more reasonable clusters, such as combining some neighbor cells. For example, those utterances within the adjacent Cell
Figure 1Visualized Opinions by keywords at Common Viewer by GAE
Figure 2 Visualized Opinions at Personalized Viewer
Figure 3 Retrospective View by Time (First 40 Utterances)
[row=10, col=6] and Cell [row=10, col=7] reflect participants’ emphasizing concerns on key factors in comprehensive transportation and macro economy and could be grouped into one cluster. Such kind of further processing by human experts based on automatic affinity diagramming also exhibits the ideas of man-machine interaction while human plays principal roles emphasized by meta-synthesis approach.
Group discussions had been taken many times which were very helpful to fix the limited goals with limited resources in humans, money and information and undertake quantitative analytical work which mainly belongs to Type I, II and III. Next we address our endeavors in modeling by rule (Type V) to analyze passenger traffic based on multi-agent system (MAS) simulation.
4. MULTI-AGENT SYSTEM FOR PASSENGER TRAFFIC SIMULATION
As an important part of integrated transportation system, passenger transport is undertaken via four kinds of modes, railway, highway, airway and waterway. In recently years, the competition betwwen railway and highway in passenger transportation is a hot topic for both railway and highway transportation systems development. Limited rationality in human behaviours brings out uncertainties and increase complexity to
practical passenger transport systems. Instead of descriptive and qualitative discussions about the competitive relations between two modes, here we develop a simple MAS model to analyze how different factors of each transportation system affect passengers’ selection of travel means by StarLogo MAS platform developed by MIT [6]. There are many factors affecting passengers’ selection of vehicles, which can be classified into internal and external factors by view of transportation system. External factors may refer to residents’ incomes, industry structure, urbanization, etc. For simplification, internal factors are summarized as 5 indicators, safety, comfort, convenience, speediness and economy (cost), for passenger transport. Here we only consider impacts of internal factors for passenger traffic. 4.1 Modeling of Passenger Traffic
Here, we only consider one kind of agent, passengers, who are categorized into 5 groups by level of incomes as shown in Table 1. Those figures are just hypothesized estimation, not directly from practical investigation. We concentrate on modeling itself.
Table 1 Groups of Agents (Passengers)
Group Income (RMB yuan) Percentage (%) Income growth rate (%) 1 ≥5000 5 5 2 3000-5000 15 10 3 1000-3000 40 20 4 500-1000 25 10 5 <500 15 5
The descriptions of behaviors of each agent is as follows.
1) Motivitation of Traveling. Each agent owns energy which could afford his traveling. Here energy of an agent is defined as 20% of his income. When the energy value reaches a certain point, the agent has possibilities for a trip. Traveling will be at a cost of energy. As
energy is less than the minimum cost for a trip, agent
stops traveling.
2) Scores for Vehicles. Each kind of transport mode has its advantage and disadvantage in passenger transport. Table 2 gives general benchmark for railway and highway.
Table 2. Value of Indicators for Transportation Modes
s a f e t y comfort convenience speediness economy
railway 4 4 3 4 3
highway 4 3 4 4 3
The values come from evaluation of five transportation modes based on statistics and expert evaluations. Some indicators, such as economy and speediness can also be calculated by Equation (1) and (2).
COST = INT (k1* distance / price + 0.5) (1) Speediness = INT (k2 * speed + 0.5) (2) where k1 and k2 are coefficients, here k1 = 0.5, k2 = 1/30, INT denotes the function to convert a decimal number to an integer value. Imj denotes the points of
indicator j for transport mode m, j = 1,2,3,4,5; m = {railway, highway}.
However, different groups of agents have their own prefernecs in vehicles due to differnet levels of incomes. Then we also give subjective weights for 5 indicators as listed in Table 3.
Table 3 Weights of Indicators for Different Groups
Income
Level safety comfort convenience speediness economy
1 3 5 2 4 1
2 5 4 1 3 2
3 2 4 5 1 3
4 3 2 1 5 4
5 4 1 3 2 5
Agent selects one vehicle based on the total scores calculated by
∑
= × = 5 1 ) ( j mj ij im W I T , where i=1,2,3,4,5; mdenotes either railway (r) or highway (h), Tim means
the preference score for transport mode m given by group i (income level). Tir>Tih means the agent prefers
railway.
(3) Rules for Vehicle Selection. Agent makes decision of vehicle selection according to the capacity of transport modes, agent’s preferencs and energy. Table 4 lists rules about agent behaviors.
Table 4. Acting Rules of an Agent
# Description Priority
1 IF energy < MIN(Pr, Ph)
THEN stop traveling 2
2 IFMIN(Pr, Ph) < energy < MAX(Pr, Ph)
THEN select vehicle with lower price 3 3 IF energy > MAX(Pr, Ph) AND Tir > Tih
THEN select railway 4
4 IF energy > MAX(Pr, Ph) AND Tir < Tih
THEN select highway 4
5 IF energy > MAX(Pr, Ph) AND Tir = Tih
THEN select vehicle with lower price 4
6 IF capacity of both modes are full THEN stop traveling
1 7 IF one and only one mode with available
capacity
THEN select that mode
3 (Pr and Ph denote prices for railway and highway
respectively.)
The order for rule search is by sequences 6-> 7-> 1->… ->5, which means to check the system capacity at first, then check the available energy of agent and calculate the total scores of different transport mode. For rule selection, if priority of current rule is higher than that in operation, select current rule; if lower, skip current one; if same, that happens to Rule 2 and 7, it needs to analyze the results of carrying out both rules.
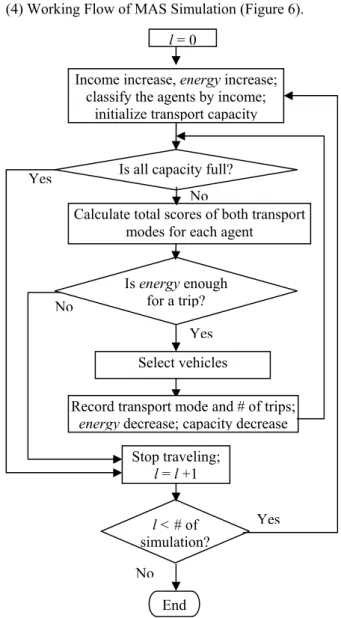
(4) Working Flow of MAS Simulation (Figure 6).
Figure 6. Working Flow of MAS Simulation
Income increase, energy increase; classify the agents by income;
initialize transport capacity Is all capacity full?
Calculate total scores of both transport modes for each agent
Is energy enough for a trip?
Select vehicles Yes No
Record transport mode and # of trips;
energy decrease; capacity decrease
Stop traveling; l = l +1 l < # of simulation? Yes No Yes End No l = 0
In brief summary, the design of simulation process is based on three assumptions: (i) the income of agent increases with time by different growth rates for different income levels; (ii) the income and energy of agent are assigned once in each step of simulation (referring a period of time); (iii) at each step, agent consumes his energy as much as possible.
4.2 Simulation Experiments
Here four tests are taken to observe how different factors of transportation systems affect behaviors of passengers, (i) transport price change; (ii) transport speed change; (iii) safety improvement; and (iv) capacity adjustment. The distance of traveling is 1200 km. Due to the capacity of StarLogo and computer, the maximum number of agents is set to 200. Figures 7-10 show the performance of both transportation systems by different conditions respectively.
Table 5.Simulation experiments design Transport
mode safety comfort convenience speediness economy Price (yuan) Speed km/h) capacity
railway 4 4 3 4 3 180 120 No limit 1 highway 4 3 4 4 3 180 120 No limit railway 4 4 3 4 3 180 120 No limit 2 highway 4 3 4 4 5 120 120 No limit railway 6 4 3 6 3 180 180 No limit 3 highway 4 3 4 4 5 120 120 No limit railway 6 4 3 6 3 180 180 100 4 highway 4 3 4 4 5 120 120 No limit
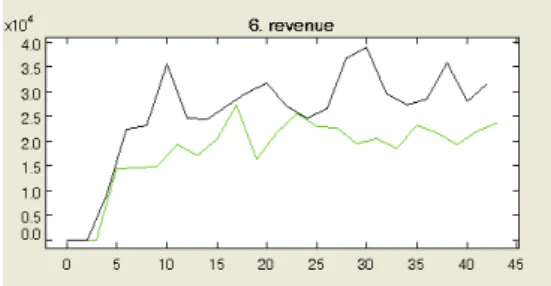
As test condition state 1 was changed to 2, the price of highway dropped from 180 to 120 which affected value of economy of highway jumped up to 5 from 3, then both passenger traffic and income of highway increased quickly while those of railway dropped as shown in Figure 8, which reflects most people prefer more economical vehicles for trip.
Figure 7a. Passenger Traffic for Railway (solid line) and Highway
(light color line) (Test 1)
Figure 7b. Incomes of Transport Systems (Test 1)
Figure 8a. Passenger Traffic (Test 2)
From test condition state 2 to 3, as train speed increased from 120 km/hr to 180 km/hr (value of speediness increased from 4 to 6) as well as safety was improved (4 to 6), passenger traffic in railway system increased again. And traffic amounts of both modes are closer. For experiment 4, the limitation of capacity of railway drove people to travel by highway.
Above experiments studies the competition of passenger traffic in between railway and highway based on MAS simulation [7]. Given different rules about agent behaviors, the performance of both transport system is
changing. Some qualitative results may be drawn from qualitative hypothesis (rules) by simulations which are really beyond those qualitative discussions on competition relations between two transportation modes and may be useful for policy making on resources allocation, transport pricing, and capacity adjustment of transportation system, etc. On the other hand, there are lots of improvements worth endeavors toward MAS model. Currently we do not consider the differences between business traveling and private trips. The reciprocal impacts between agents are also not in consideration.
5. CONCLUDING REMARKS
In this paper, we address the practice of meta-synthesis system approach to a consulting research project on exploring constructing comprehensive transportation system in China. The group discussions among project participants with diverse disciplines, knowledge structures and departmental interests bring both uncertainties and rich ideas toward project implementation. Our developed creativity support tool, GAE, is then applied to help analyze procedure and outcome of group argumentation. Visualized analysis provided by GAE transforms qualitative knowledge into a series of 2-dimenstional maps, which help the participants to understand others’ opinions easier, find common interests, stimulate further thinking, knowledge sharing and ideas generation, expose more uncertainty factors and acquire intuition and insight toward the unstructured issues.
It is still of different views toward the definition of comprehensive transportation, which is definitely regarded as an open giant complex system. Then applying system methodologies to its analysis for a variety of perspectives or a systemic scenario for modeling is required in certain. Here 6 categories of modeling strategies for comprehensive transportation are indicated while basic ideas of modeling by rule for passenger traffic are demonstrated.
The simulation of MAS model for passenger traffic depicts the system performance of individual transport mode with different system conditions and individual behaviors, which shows more reasonable explanations than only qualitative discussions. Endeavors are needed for model improvements with consideration of more practical situations. What we are concerned here is to provide one kind of concepts and demonstrations for complex system problem solving by meta-synthesis approach.
Figure 9a. Passenger Traffic (Test 3)
Figure 9b. Incomes of Transport Systems (Test 3)
Figure 10a. Passenger Traffic (Test 4)
ACKNOWLEDGEMENTS
This work was supported by Natural Sciences Foundation of China (Grant No. 79990580 & 70221001) and Chinese Academy of Engineering. MAS modeling work was finished in 2004. Support from Professor Yuanzhang LIU, who acts as the project leader, is greatly thankful.
REFERENCES
[1] Dong Y. The Construction and Development of Comprehensive Transportation in China, http://jlsygj.gov.cn/htmpag/l10.htm. (in Chinese)
[2] Yu J Y and Tu Y J. Meta-Synthesis - Study of Case,
Systems Engineering - Theory and Practice,
22(5):1-7, 2002. (in Chinese)
[3] Wierzbicki A P, Makowski M and Wessels J. Model-based Decision Support Methodology with Environmental Applications, Kluwer, 2000.
[4] Gu J F and Tang X J. Meta-synthesis approach to Complex System Modeling. European Journal of
Operational Research, 166(3):597-614, 2005.
[5] Tang X J and Liu Y J. Computerized Support for Idea Generation during Knowledge Creating Process, in Cao C-G & Sui Y-F eds. Knowledge Economy
Meets Science and Technology, Tsinghua University
Press, pp81-88, 2004.
[6] http://education.mit.edu/starlogo/
[7] Nie K and Tang X J. Application of MAS in Passenger Traffic Analysis. Management Review, 16(4):3-7, 2004. (in Chinese)