Cargo transportation cost in Vietnam
著者
Ishida Masami
権利
Copyrights 日本貿易振興機構(ジェトロ)アジア
経済研究所 / Institute of Developing
Economies, Japan External Trade Organization
(IDE-JETRO) http://www.ide.go.jp
journal or
publication title
IDE Discussion Paper
year
2019-03
1
INSTITUTE OF DEVELOPING ECONOMIES
IDE Discussion Papers are preliminary materials circulated to stimulate discussions and critical comments
Keywords: Logistics, Transportation Cost, Cargo, Vietnam, Container, Mode of
Transport
JEL Classification: L91, O53, R40
* L Director General of Development Studies Center, IDE-JETRO ([email protected]).
IDE DISCUSSION PAPER No. 744
Cargo Transportation Cost in Vietnam
Masami Ishida*
March 2019
Abstract: This paper analyzes the cargo transportation costs as well as associated time
required for transport in both domestic and international sections of the country. Results are based on questionnaire and interview surveys with 19 freight forwarders. Respondents answered that the cost and time required for cargo transportation vary according to mode of transportation, by container or truck type, and whether it is one-way or a round trip. The number of cargo transportation cost samples included in the analysis was 268 and that of the time required for transportation was 125. This paper also analyzes the relationship of the cargo transportation cost with income level of the origin and destination, the effects of different modes of transport of the whole dataset as well as of the coastal section of the country between Hanoi and Ho Chi Minh City, the effects by country, and the relationship of the time required for transportation by mode of transportation. Together the analyses showed that cross-border transportation costs, especially with Cambodia and Laos, were very much higher; it also showed that the transportation cost of using a 40-foot container is the same as for road transport, but it differs for sea transport. These findings are all verified by econometric analysis.
2
The Institute of Developing Economies (IDE) is a semigovernmental, nonpartisan, nonprofit research institute, founded in 1958. The Institute merged with the Japan External Trade Organization (JETRO) on July 1, 1998. The Institute conducts basic and comprehensive studies on economic and related affairs in all developing countries and regions, including Asia, the Middle East, Africa, Latin America, Oceania, and Eastern Europe.
The views expressed in this publication are those of the author(s). Publication does not imply endorsement by the Institute of Developing Economies of any of the views expressed within.
INSTITUTE OF DEVELOPING ECONOMIES (IDE), JETRO 3-2-2, WAKABA,MIHAMA-KU,CHIBA-SHI
CHIBA 261-8545, JAPAN
©2019 by Institute of Developing Economies, JETRO
No part of this publication may be reproduced without the prior permission of the IDE-JETRO.
3
Cargo Transportation Costs in Vietnam
Masami Ishida
1Abstract
This paper analyzes the cargo transportation costs as well as associated time required for transport in both domestic and international sections of the country. Results are based on questionnaire and interview surveys with 19 freight forwarders. Respondents answered that the cost and time required for cargo transportation vary according to mode of transportation, by container or truck type, and whether it is one-way or a round trip. The number of cargo transportation cost samples included in the analysis was 268 and that of the time required for transportation was 125. This paper also analyzes the relationship of the cargo transportation cost with income level of the origin and destination, the effects of different modes of transport of the whole dataset as well as of the coastal section of the country between Hanoi and Ho Chi Minh City, the effects by country, and the relationship of the time required for transportation by mode of transportation. Together the analyses showed that cross-border transportation costs, especially with Cambodia and Laos, were very much higher; it also showed that the transportation cost of using a 40-foot container is the same as for road transport, but it differs for sea transport. These findings are all verified by econometric analysis.
Keywords: Logistics, Transportation Cost, Cargo, Vietnam, Container, Mode of
Transport
JEL Classification: L91, O53, R40
Introduction
Vietnam is an elongated country from north to south and has two megacities, Hanoi and Ho Chi Minh City, in the north and in the south, respectively. Both cities have surrounding suburbs that serve as important commercial markets and production bases. Goods and materials are needed to be transported between factories and ports/airports, and to be
4
delivered to shops and households. In Vietnam, the coastal inter-city logistics between the north and the south is an interesting case to study, particularly between Hanoi and Ho Chi Minh City, as consignors have four options for shipment: road, railway, ship, and air.
Vietnam’s cross-border logistics with Cambodia, Laos, Thailand, and the South China have progressed with the development of three economic corridors through the Greater Mekong Subregion (GMS) Economic Cooperation Program (Ishida and Isono 2012; Ishida 2019). Outside of the GMS, trade with countries in the Pacific Ocean like the United States, South Korea, Japan, and China are also important.
The Institute of Developing Economies, Japan External Trade Organization (IDE-JETRO), and the Institute of World Economics and Politics, Vietnam Academy of Social Sciences (IWEP-VAAS) jointly conducted questionnaire and interview surveys of freight forwarders, forwarder associations, air cargo operators, and airport terminal operators in Vietnam from September to November in 2017. This paper focuses on the results of the survey with freight forwarders.
The survey focused on the cargo transportation costs as well as time required for transportation for various regions and modes of transport (Ishida et al.2019)2. As for the time required, respondents said that it depended on the level of road infrastructure, traffic rules including speed limit, and also on traffic jams within cities. In addition, for cargo transportation costs, the results were more complicated. This has attracted the attention of international economists who are interested in matters including how transportation costs affect the value of goods and how transportation costs change relative to other known trade barriers (Hummels, 2007). Here, we try to confirm the findings described in Ishida et al. (2019) with evidence-based analyses about cargo transportation costs as well as the time required for transportation through a series of descriptive analyses using econometrics. Key findings of the survey include:
1) Cargo transportation costs and the time required for transportation differed among modes of transport for the coastal section between Hanoi and Ho Chi Minh City by way of Da Nang. The costs of cargo ships and railways were lower than road transportation but the time required for transportation by railway and by ship were longer. The differences in cost between air transportation and other modes of transportation was difficult to confirm because the price per unit for air transportation is not based on 20-ft or 40-20-ft containers, but rather on weight.
2) The transportation costs from Ho Chi Minh City to Hanoi were higher than those from
2 “Cargo transportation cost” is also called as “transportation price,” “transportation charge,” and
5
Hanoi to Ho Chi Minh City.
3) Regarding shipping by sea, the cargo transportation cost from Shanghai to Ho Chi Minh City and Da Nang was higher than the opposite route.
5) Transportation cost was higher, and time required for transportation was longer for cross-border transport, especially in the case of road transport.
6) The difference in transportation price between 20-ft and 40-ft containers was smaller or equal for road because heavier goods tended to be transported by 20-ft containers while lighter goods tended to be transported by 40-ft containers. However, the difference was larger for cargo ships because the space occupied by 20-ft containers was half of that occupied by 40-ft containers.
7) The transportation price for one-way transportation was sometimes higher than round-trip transport; the round-round-trip transportation discount rate was around 10 – 20%.
The purpose of this paper is to take these findings as hypotheses and verify them with econometrics. This paper is composed of four sections except the introduction and concluding remarks. The first section reviews the literature on logistics in Vietnam and cargo transportation cost. The second section describes the methodologies. The third section and the fourth sections show the estimated results of the cargo transportation cost and the time required for transport, respectively. Lastly, concluding remarks summarize the estimated results and discuss the major contribution of this paper.
1. Literature Survey
Before introducing survey results and the findings of this paper’s analyses, we will first review the literature on logistics in Vietnam and cargo transportation cost.
Banomyong et al. (2015) illustrates a comprehensive picture of the logistics system in Vietnam from viewpoints of transportation and logistics infrastructure as well as mode of transport. It depicts the institutional frameworks and the quality of logistics service providers in accordance with semi-structured interviews with policy makers and business associations related to the logistics business in Vietnam. The paper represents two aspects of the logistics system in Vietnam: a lower-quality logistics system provided by local small and medium-sized firms on the one hand, and a limited number of modernized joint-venture logistics providers for international transportation on the other.
Regarding transportation cost, Hummels (2007) shows a long-term declining trend of transportation costs for ocean and air trpansportation by analyzing data between the 1950s and 2004. The paper attributes the declining trend of transportation costs to both a
6
decrease in air transportation costs due to technological advancements in aviation as well as to the containerization of sea transport. Golub and Tomasik (2008) estimates the country-specific international transportation costs of air, maritime, and road transportation for 21 OECD countries. The paper uses the data of road cost per kilogram per kilometer obtained from the United States Department of Transportation from 1990 – 2000. Road costs in Europe are estimated by using the data from the United States. He, Li, and Whalley (2017) builds a general equilibrium trade model using transportation costs between the United States and Canada.
As for transportation costs in developing countries, Limao and Venables (2001) examine the transportation costs of land-locked countries at the level of infrastructure development and geographical features. Christ and Ferrantino (2011) treats the uncertainties of transportation costs and time consumed in Sub-Saharan Africa countries. De (2009) estimates the cross-border transportation costs among India, Pakistan, Bangladesh, Sri Lanka, and Nepal.
Transportation costs have long been an important issue for international economics; one of the major indicators used is the ad valorem transportation cost, the ratio of transportation costs out of imports. However, I try to use more direct methods to measure transportation costs composed not only of international costs, but also of domestic transportation costs. IDE-JETRO (2017) has obtained actual transportation costs for certain sections in Laos and Thailand, including the cost between Bangkok and Vientiane. They also show the minimum, maximum, and averaged costs for such sections, but the number of samples is limited to only five or six firms. This paper conducts questionnaire and interview surveys about the time required and the cargo transportation costs for specific sections in accordance with IDE-JETRO (2017).
2. Methodologies
The sample for the survey includes 19 freight forwarding establishments consisting of 8 local forwarders and 11 foreign forwarders. This includes 9 forwarders located in Hanoi, 7 forwarders in Ho Chi Minh City, and 3 forwarders in Da Nang. One establishment in Hanoi and another one in Ho Chi Minh City belong to the same firm but both of them have their own networks in the north and the south, respectively. Each sample collected the transportation prices for several sections of the country. The total number of such sections was 268. In addition to transportation prices, we calculated the geographical distance of each section from the origin to the destination in accordance with a website of distance calculators. This distance was subsequently used as one of the most important
7
explanatory variables, as previously defined by the iceberg model of Samelson in the1950s (He, Li and Whalley 2017). In order to consider the relationship between income levels of the destination and the origin, we obtained either the gross domestic product (GDP) or gross provincial products (GPP) and the GDP per capita or GPP per capita of both the origin and destination. GPP and GPP per capita were applied to the domestic origins and destinations in Vietnam while GDP and GDP per capita were applied to those in foreign countries. The GPP is calculated based on the monthly average income per capita released by the General Statistics Office (GSO) of Vietnam. The GPP per capita is multiplied by 12 months as well as by population, to yield the GPP. However, the sum of the GPP is actually much lower than the GDP and might be underestimated. Then, the provincial percentage share of the total GPP is multiplied by the GDP (based on ADB Key Indicators) and is converted to dollars. The GPP per capita is further calculated by dividing the modified GPP by the provincial populations. The GDP and GDP per capita in China, Cambodia, Laos, Thailand, South Korea, the United States, and other foreign countries are based on World Development Indicators. Thus, the cargo transportation cost can be expressed as:
ln Price =α +βln distance + ɤln GDP/Cap_o + θln GDP/Cap_d (1) or
ln Price = α + βln distance + ɤln GDP_o + θln GDP_d (2) where price is the transportation price or cost, GDP/Cap_o represents GDP per capita or GPP per capita of the origin, and GDP/Cap_d represents GDP or GPP per capita of the destination. The GDP_o and GDP_d represent GDP or GPP of the origin and of the destination, respectively, and α, β, ɤ, and θ are parameters. This formula is the same as the gravity model but with the transportation cost being different from the quantity or the value of trade. Additionally, the relationship with geographical distance is expected to be positive here while the expectation is negative in the gravity model. Furthermore, the coefficient signs of GDP and GPP per capita are expected to be positive, the same as in the gravity model for price, service cost, and/or the wage levels of the origins and destinations. The GDP and GPP is also considered to be the scale of the markets.
As for the time required for transport, the number of samples was 125, less than that of transportation prices. While transportation prices can vary between 20-ft and 40-ft containers as well as between one-way and round trips, the time required for
8
transportation did not vary between these variables. Thus, the data were integrated for container size and trip type. In addition, the time required for transportation is not affected by GDP or GDP per capita of the origin and the destination. Thus, the time required for transportation can be expressed as:
ln Time = α + βln distance + ɤ dummy variables (3) In addition to the estimation of time required for transport, we also further analyzed the relationship between the cargo transportation price and other variables in accordance with the findings of the descriptive analyses of Ishida et al. (2019) as:
ln Price = α + βln distance + ɤ dummy variables (4)
The dummy variables are composed of mode of transport dummies, coastal dummies, container dummies, country dummies, one-way or return dummy, and transportation section dummies. The mode of transportation dummies are composed of six variables including: domestic transport, access roads, cross-border roads, railways, shipping from door to door (Shipping DtoD), and shipping from port to port (Shipping PtoP). The domestic transportation is one if goods are transported by road between cities in Vietnam except in cases when access roads are used, and is zero in other cases. The access roads dummy is one if goods are transported to/from ports or airports in base cities (Hanoi, Ho Chi Minh City, and Da Nang) and zero in other cases. Cross-border roads is one if either the origin or destination is out of Vietnam, including Phnom Penh, Vientiane, Bangkok, and cities in the South China and the mode of transportation is by road. Railways is one if the goods are transported by railway. For shipping DtoD and PtoP, these categories include cases of shipping trips. But some respondents to the survey replied that the whole cost or price from door to door included road transportation between the port and factory, shop or warehouse, terminal handling charges (THC), and so forth, whereas others replied that the cost included only shipping from port to port. In cases of the former, shipping DtoD is one while in the latter case, the shipping PtoP is one. The coastal dummy is one when if goods are transported among three cities of Hanoi, Ho Chi Minh City and Da Nang by road and by railway, and among Hai Phong Port, Ports in Ho Chi Minh City and Da Nang Port by cargo ship.
The container dummies are composed of three variables including: truck is one if the goods are transported by a truck instead of a trailer with a container. Next, 20-ft container and 40-ft container are each one if goods are transported by a 20-ft container or a 40-ft
9
container, respectively. The country dummies are one when each the origin or destination is a city in a specific country including: Cambodia, Laos, Thailand, China, Korea, Singapore, and the United States. The one-way or return dummy is one if the transportation includes a return trip and is zero in the case of a one-way trip. The transportation section dummies are used for specific sections of the country. For instance, HCMC is one if goods are transported from Ho Chi Minh City to Hanoi, and zero in cases of a trip from Hanoi to Ho Chi Minh City or when other routes are used.
Regarding origins and destinations, some respondents specified the direction of transport; however, in many cases they did not. The cases that they specified are from Ho Chi Minh City to Hanoi (by respondents based in Hanoi) and from Shanghai to Ho Chi Minh City (by respondents based in Ho Chi Minh City). In cases where respondents did not specify the direction, the origin is assumed to be the city where the establishment exists, and the destination is assumed to be another place.
3. Estimated Results
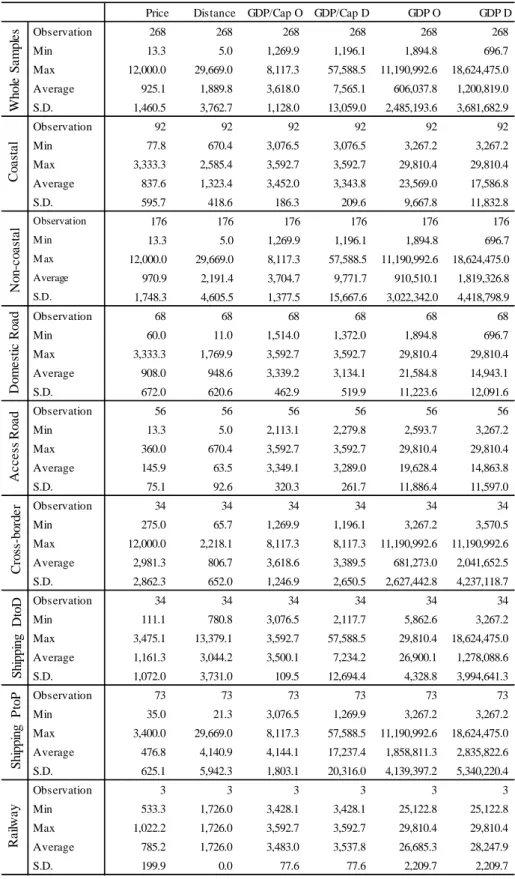
A summary of key statistics from the econometric analysis on cargo transportation cost is shown in Table 1. The price varies from USD 13 to USD 12,000, with an average of USD 925. The average price for coastal transportation between Hanoi and Ho Chi Minh by way of Da Nang is USD 838. The average price from Hanoi to Ho Chi Minh City using a 40-ft container is USD 904, while, that from Ho Chi Minh City to Hanoi is USD 1,813. It is said that this large difference is due to the higher demand for transportation from Ho Chi Minh City to Hanoi (Ishida et al.2019).
Regarding the transportation costs in the literature, Limao and Venables (2001) reported that the transportation cost of non-land-locked countries with Baltimore is USD 4,620 and that of land-locked countries is USD 8,070; the transportation cost of sea routes per 1,000 km is USD 190 and that of land routes is USD 1,380. Furthermore, De (2009) shows that the average transportation cost in South Asia using sea routes is USD 193 and that of land routes is USD 1,328. These values vary depending on the country; the land transportation cost in Nepal is USD 1,676 while sea transportation cost in Sri Lanka is USD 300.
Dividing the average transportation costs by the average distance and multiplying by 1,000 yields the transportation cost per 1,000 km for domestic roads, access roads and cross-border roads as USD 957, USD 2,298, and USD 3,696, respectively (see Table 1). The transportation cost per 1,000 km of shipping DtoD and PtoP are USD 382 and USD
10
Table 1. Summary of Key Statistics for Transportation Cost Analyses
Source: Calculated by the author based on the data of the questionnaire and interview survey. Price Distance GDP/Cap O GDP/Cap D GDP O GDP D
Observation 268 268 268 268 268 268 Min 13.3 5.0 1,269.9 1,196.1 1,894.8 696.7 Max 12,000.0 29,669.0 8,117.3 57,588.5 11,190,992.6 18,624,475.0 Average 925.1 1,889.8 3,618.0 7,565.1 606,037.8 1,200,819.0 S.D. 1,460.5 3,762.7 1,128.0 13,059.0 2,485,193.6 3,681,682.9 Observation 92 92 92 92 92 92 Min 77.8 670.4 3,076.5 3,076.5 3,267.2 3,267.2 Max 3,333.3 2,585.4 3,592.7 3,592.7 29,810.4 29,810.4 Average 837.6 1,323.4 3,452.0 3,343.8 23,569.0 17,586.8 S.D. 595.7 418.6 186.3 209.6 9,667.8 11,832.8 Observation 176 176 176 176 176 176 M in 13.3 5.0 1,269.9 1,196.1 1,894.8 696.7 M ax 12,000.0 29,669.0 8,117.3 57,588.5 11,190,992.6 18,624,475.0 Average 970.9 2,191.4 3,704.7 9,771.7 910,510.1 1,819,326.8 S.D. 1,748.3 4,605.5 1,377.5 15,667.6 3,022,342.0 4,418,798.9 Observation 68 68 68 68 68 68 Min 60.0 11.0 1,514.0 1,372.0 1,894.8 696.7 Max 3,333.3 1,769.9 3,592.7 3,592.7 29,810.4 29,810.4 Average 908.0 948.6 3,339.2 3,134.1 21,584.8 14,943.1 S.D. 672.0 620.6 462.9 519.9 11,223.6 12,091.6 Observation 56 56 56 56 56 56 Min 13.3 5.0 2,113.1 2,279.8 2,593.7 3,267.2 Max 360.0 670.4 3,592.7 3,592.7 29,810.4 29,810.4 Average 145.9 63.5 3,349.1 3,289.0 19,628.4 14,863.8 S.D. 75.1 92.6 320.3 261.7 11,886.4 11,597.0 Observation 34 34 34 34 34 34 Min 275.0 65.7 1,269.9 1,196.1 3,267.2 3,570.5 Max 12,000.0 2,218.1 8,117.3 8,117.3 11,190,992.6 11,190,992.6 Average 2,981.3 806.7 3,618.6 3,389.5 681,273.0 2,041,652.5 S.D. 2,862.3 652.0 1,246.9 2,650.5 2,627,442.8 4,237,118.7 Observation 34 34 34 34 34 34 Min 111.1 780.8 3,076.5 2,117.7 5,862.6 3,267.2 Max 3,475.1 13,379.1 3,592.7 57,588.5 29,810.4 18,624,475.0 Average 1,161.3 3,044.2 3,500.1 7,234.2 26,900.1 1,278,088.6 S.D. 1,072.0 3,731.0 109.5 12,694.4 4,328.8 3,994,641.3 Observation 73 73 73 73 73 73 Min 35.0 21.3 3,076.5 1,269.9 3,267.2 3,267.2 Max 3,400.0 29,669.0 8,117.3 57,588.5 11,190,992.6 18,624,475.0 Average 476.8 4,140.9 4,144.1 17,237.4 1,858,811.3 2,835,822.6 S.D. 625.1 5,942.3 1,803.1 20,316.0 4,139,397.2 5,340,220.4 Observation 3 3 3 3 3 3 Min 533.3 1,726.0 3,428.1 3,428.1 25,122.8 25,122.8 Max 1,022.2 1,726.0 3,592.7 3,592.7 29,810.4 29,810.4 Average 785.2 1,726.0 3,483.0 3,537.8 26,685.3 28,247.9 S.D. 199.9 0.0 77.6 77.6 2,209.7 2,209.7 W hol e S a m pl e s C o as tal D o m es ti c R o ad A cces s R oa d Cro ss -bor de r S hi ppi ng P toP S hi ppi ng D toD R a ilw a y N on -co as tal
11
115, respectively. The value of shipping PtoP, USD 115, is not much different from the value per 1,000 km as indicated by Limao and Venables (2001), which is USD 190. Regarding road transport, the land transportation cost per 1,000 km indicated by Limao and Venables (2001), at USD 1,380 is located between the domestic transportation cost at USD 957, and the transportation cost of access roads per 1,000 km at USD 2,298.
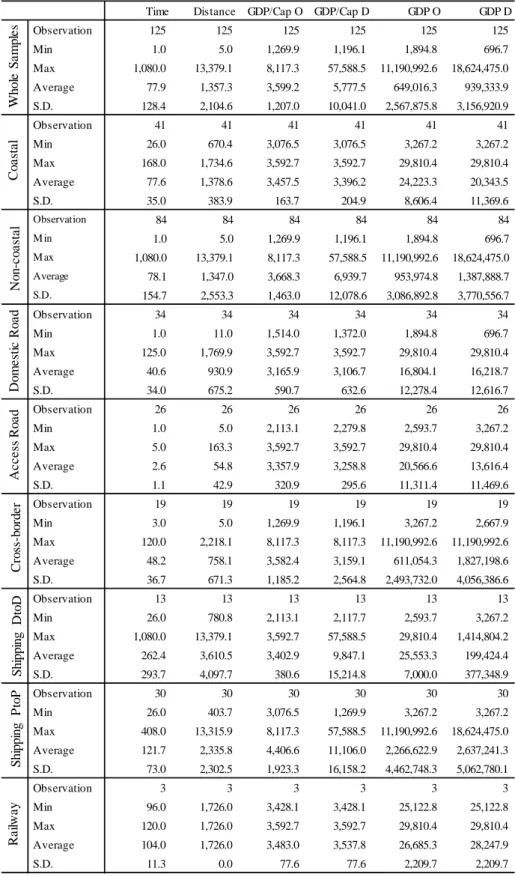
A summary of key statistics from the econometric analysis on cargo transportation cost is hown in Table 1. Table 2 shows a summary of key statistics from the econometric analysis on time required for transport. Transportation time varies from 1 hour to 1,080 hours (45 days). Between Hanoi and Ho Chi Minh City, the average time is 68.8 hours by road. Meanwhile, it takes 36.0 hours between Hanoi and Da Nang and 41.7 hours between Ho Chi Minh City and Da Nang by road. Between Hanoi and Ho Chi Minh City, it takes 108.0 hours by railway, 141.8 hours by sea, and 12.0 hours by air from door to door (Ishida et al. 2019). A trip from Hanoi to Samarkand in Uzbekistan by way of Lianyungang port in China takes 1,080 hours (45 days).
Geographical distances range between 5 km and 1,890 km. The distance between the Bavet border crossing and the special economic zone in Bavet, Cambodia is 5 km, as is the distance between Da Nang Airport and Da Naing City. The longest distance is 29,669 km between Hai Phong and Toronto. The distance between Hanoi and Ho Chi Minh City is 1,616 km by road, 1,726 km by railway, and the distance between the Port of Hai Phong and Ho Chi Minh City is 1,608 km.
The differences of GDP and GDP per capita are also large. This is in part because they include the GPPs of provinces in rural Vietnam like Kon Tum Province (GDP USD 697) as well as the GDP of the entire United States (USD 18,624,475). The GDP per capita of Cambodia is USD 1,196 and that of the United States is USD 57,589.
3.1 Relationship Between Cargo Transportation Price and Income Level
First of all, we applied the collected data to the model of cargo transportation price with formulas (1) and (2). Table 3 shows the relationships between them.
Column (1) shows the positive relationship of price with the geographical distance and has strong statistical significance. It shows that a 1% increase in geographical distance raises the transportation price by 46%. However, the coefficients of GDP per capita of the origin and the destination are unexpectedly negative and the latter has statistical significance. Column (2) also shows the same coefficient signs for the GDP of origins and destinations. First, regarding destinations, cargo is transported by ship to countries that are far away like the United States while goods that are by transported by trucks including trailers go to closer neighboring countries like Cambodia and Laos; thus,
12
Table 2. Summary of Key Statistics for Transport Time Analyses
Source: Calculated by the author based on the data of the questionnaire and interview survey. Time Distance GDP/Cap O GDP/Cap D GDP O GDP D
Observation 125 125 125 125 125 125 Min 1.0 5.0 1,269.9 1,196.1 1,894.8 696.7 Max 1,080.0 13,379.1 8,117.3 57,588.5 11,190,992.6 18,624,475.0 Average 77.9 1,357.3 3,599.2 5,777.5 649,016.3 939,333.9 S.D. 128.4 2,104.6 1,207.0 10,041.0 2,567,875.8 3,156,920.9 Observation 41 41 41 41 41 41 Min 26.0 670.4 3,076.5 3,076.5 3,267.2 3,267.2 Max 168.0 1,734.6 3,592.7 3,592.7 29,810.4 29,810.4 Average 77.6 1,378.6 3,457.5 3,396.2 24,223.3 20,343.5 S.D. 35.0 383.9 163.7 204.9 8,606.4 11,369.6 Observation 84 84 84 84 84 84 M in 1.0 5.0 1,269.9 1,196.1 1,894.8 696.7 M ax 1,080.0 13,379.1 8,117.3 57,588.5 11,190,992.6 18,624,475.0 Average 78.1 1,347.0 3,668.3 6,939.7 953,974.8 1,387,888.7 S.D. 154.7 2,553.3 1,463.0 12,078.6 3,086,892.8 3,770,556.7 Observation 34 34 34 34 34 34 Min 1.0 11.0 1,514.0 1,372.0 1,894.8 696.7 Max 125.0 1,769.9 3,592.7 3,592.7 29,810.4 29,810.4 Average 40.6 930.9 3,165.9 3,106.7 16,804.1 16,218.7 S.D. 34.0 675.2 590.7 632.6 12,278.4 12,616.7 Observation 26 26 26 26 26 26 Min 1.0 5.0 2,113.1 2,279.8 2,593.7 3,267.2 Max 5.0 163.3 3,592.7 3,592.7 29,810.4 29,810.4 Average 2.6 54.8 3,357.9 3,258.8 20,566.6 13,616.4 S.D. 1.1 42.9 320.9 295.6 11,311.4 11,469.6 Observation 19 19 19 19 19 19 Min 3.0 5.0 1,269.9 1,196.1 3,267.2 2,667.9 Max 120.0 2,218.1 8,117.3 8,117.3 11,190,992.6 11,190,992.6 Average 48.2 758.1 3,582.4 3,159.1 611,054.3 1,827,198.6 S.D. 36.7 671.3 1,185.2 2,564.8 2,493,732.0 4,056,386.6 Observation 13 13 13 13 13 13 Min 26.0 780.8 2,113.1 2,117.7 2,593.7 3,267.2 Max 1,080.0 13,379.1 3,592.7 57,588.5 29,810.4 1,414,804.2 Average 262.4 3,610.5 3,402.9 9,847.1 25,553.3 199,424.4 S.D. 293.7 4,097.7 380.6 15,214.8 7,000.0 377,348.9 Observation 30 30 30 30 30 30 Min 26.0 403.7 3,076.5 1,269.9 3,267.2 3,267.2 Max 408.0 13,315.9 8,117.3 57,588.5 11,190,992.6 18,624,475.0 Average 121.7 2,335.8 4,406.6 11,106.0 2,266,622.9 2,637,241.3 S.D. 73.0 2,302.5 1,923.3 16,158.2 4,462,748.3 5,062,780.1 Observation 3 3 3 3 3 3 Min 96.0 1,726.0 3,428.1 3,428.1 25,122.8 25,122.8 Max 120.0 1,726.0 3,592.7 3,592.7 29,810.4 29,810.4 Average 104.0 1,726.0 3,483.0 3,537.8 26,685.3 28,247.9 S.D. 11.3 0.0 77.6 77.6 2,209.7 2,209.7 W hol e S a m pl e s C o as tal D o m es ti c R o ad A cces s R oa d Cro ss -bor de r S hi ppi ng P toP S hi ppi ng D toD R a ilw a y N on -co as tal
13
Table 3. Estimated results of the relationship between cargo transportation costs and the income level of provinces and countries
Notes: ***, **, *, indicate statistically significance at 1%, 5%, and 10% levels, respectively. Source: Calculated by the author based on the data of the questionnaire and interview survey.
(1) (2) (3) (4)
Constant 9.835519*** 3.810296*** 3.641436* 2.95053***
(4.231434) (7.564594) (1.886916) (6.700447)
ln Distance 0.459296*** 0.380779*** 0.549024*** 0.555297***
(11.68644) (9.125454) (15.82513) (16.19132)
ln GDP per Capita (origin) -0.416948 -0.166986
(-1.567853) (-0.770271)
ln GDP (origin) 0.016686 -0.045564
(0.412687) (-1.491002)
ln GDP per Capita (destination) -0.3919*** -0.054168
(-4.603609) (-0.756808)
ln GDP (destination) -0.030843 -0.064098**
(-0.976939) (-2.495998)
Cross-border Road * 0.443861***
ln GDP per Capita (Origin) (2.630322)
Cross-border Road * 0.206858***
ln GDP (Origin) (4.276240)
Cross-border Road * -0.156434
ln GDP per Capita (destination) (-0.909420)
Cross-border Road * 0.027997
ln GDP (Destination) (0.645385)
Domestic & Access Road * 0.535308
ln GDP per Capita (Origin) (1.572142)
Domestic & Access Road * 0.131451**
ln GDP (Origin) (2.197843)
Domestic & Access Road * -0.413155
ln GDP per Capita (destination) (-1.205600)
Domestic & Access Road * -0.039166
ln GDP (Destination) (-0.631024)
Adjusted R-Squared 0.340098 0.289671 0.618873 0.630591
14
the transportation costs may be relatively lower with an increase in distance. Second, the dataset includes different modes of transportation including trucks, ships, and railways. As such, the unit prices will also vary by mode of transport. Third, the transportation sections vary greatly, ranging from distances of a few kilometers up to tens of thousands of kilometers.
Columns (3) and (4) try to improve the estimation by using cross terms of different modes of transportation and/or differences between domestic and international cases including: cross-border, domestic, and access roads. The category base cases of Column (3) are sea transport composed of shipping DtoD and shipping PtoP as well as railway transport3. The coefficient signs of the category base cases are unexpected and that of the GDP of the destination of Column (4) is statistically significant. This may be because the shipping by sea transportation cost is relatively lower when using trunk ocean routes, for example, from Hong Kong to Los Angeles. On the other hand, among the cross-term variables, the coefficients of GDP and GDP per capita of the origin are expectedly positive while some of them of the destinations are unexpectedly negative. In particular, the coefficients of the cross terms of cross-border roads and the GDP of the origin and the GDP per capita as well as of domestic and access roads and the GDP of the origin shows statistical significance. These results may be interpreted in that the wage levels of the origins located in Hanoi, Ho Chi Minh City, and Da Nang may affect the transportation service costs.
3.2 Coastal Transportation in Vietnam
The cases from Columns (5) to (8) in Table 4 are shown in order to analyze the coastal cases which connect Hanoi, Ho Chi Minh City, and Da Nang. As shown in the introduction, it is interesting that forwarders and consignors can choose between four options composed of road transport, railway transport, sea transport, and air transportation in this section but air transportation is not included in the dataset. The coefficients of the distance of all the cases show robust positive signs with statistical significance. The common variable, “Noncoastal Cases” is a variable that excludes the coastal cases and is adopted in order to control the samples4.
The category base of Column (5) is a case of using shipping PtoP. The coefficient of the coastal road transportation dummy and the shipping DtoD shows positive signs with
3 There are only three railway transportation cases included.
4 The coefficients of “Noncoastal Cases” are positive and negative with statistical significance depending
on the category base; in case of using cargo ship PtoP, it becomes positive; in case of using road transport, it becomes negative.
15
Table 4. Estimated results of cargo transportation costs for costal transportation in Vietnam including road, rail, and sea transport
Notes: ***, **, *, indicate statistically significance at 1%, 5%, and 10% levels, respectively. Source: Calculated by the author based on the data of the questionnaire and interview survey.
(5) (6) (7) (8) Constant 3.086748*** 3.666832*** 4.371712*** 3.253043*** (9.137578) (11.18953) (14.91770) (6.275008) ln Distance 0.352246*** 0.352732*** 0.353202*** 0.339534*** (9.998953) (10.00123) (9.983247) (9.425281) Noncoastal Cases 0.698817*** 0.11588 -0.591763*** 0.634602 (2.846053) (0.508396) (-3.386353) (1.418452)
Coastal Cases * Domestic Road 1.325566*** 0.742021*** 1.390026***
(4.823913) (2.868940) (2.933626)
Coastal Cases * Rail 0.918931 0.335226 -0.37316 0.768933
(1.446378) (0.532876) (-0.608076) (1.070527)
Coastal Cases * Shipping DtoD 0.620366** -0.671453** 0.510455
(1.977647) (-2.560879) (1.070527)
Coastal Cases * Shipping PtoP -0.569668* -1.277873***
(-1.806036) (-4.562022)
Coastal Cases * Domestic * Truck 0.070382
(0.150982)
Coastal Cases * Domestic * 40-ft Container -0.076892
(-0.200843)
Coastal Cases * Shipping DtoD * 40-ft Container 0.260186
(0.597776)
Coastal Cases * Shipping PtoP * 40-ft Container 0.502676
(1.088374)
Coastal Cases * From Ho Chi M inh City 0.235352
(HCM C) (0.719787)
Coastal Cases * Excepr from HCM C & Hanoi -0.264406
(-0.859454)
Round Trip -0.193067
(-1.150019)
Adjusted R-Squared 0.345144 0.343541 0.339453 0.343155
16
statistical significance. The coefficient of the dummy variables of railway is also positive compared with shipping PtoP, but the coefficient is not statistically significant. Column (6) shows a case in which the category base is shipping DtoD. It shows a positive coefficient for coastal road transportation with statistical significance. The coefficient of shipping PtoP expectedly shows negative signs also with statistical significance. The category base of Column (7) is composed of cases of coastal road transport. By changing the category base, the coefficient of shipping DtoD becomes negative with statistical significance compared with coastal road transport. The coefficient of shipping PtoP also shows a negative sign with higher statistical significance. Column (8) shows the signs of different variables and the category bases are shipping PtoP, 20-ft container, transportation from Hanoi to Ho Chi Minh City, and one-way trip. The coefficient of coastal domestic roads is statistically positive compared with shipping PtoP. The coefficient of domestic 40-ft container is unexpectedly negative, while it is not statistically significant. But the signs without statistical significance are expected ones such as for 40-ft containers for road transport. As shown in Column (8), the coefficients of shipping DtoD and PtoP with 40-ft containers are both expectedly positive, but they are not statistically significant. The dummy variable for the case of transporting from Ho Chi Minh City to Hanoi shows positive signs, but it does not show statistical significance. The dummy for the round trip shows negative signs and suggesting that there is a round-trip discount, but the discount rate is not so large as to show statistical significance.
Summarizing from Columns (5) to (7), the price differences between using cargo ship PtoP and DtoD is plus 57 – 62%, between transporting by ship (PtoP) and by road is plus 67 – 74%, and between transporting by ship (PtoP) is plus 128 – 132%, and these estimations seem reasonable. On the other hand, the coefficients of transporting by railway do not show any statistical significances in all the cases.
3.3 Analysis of All Samples
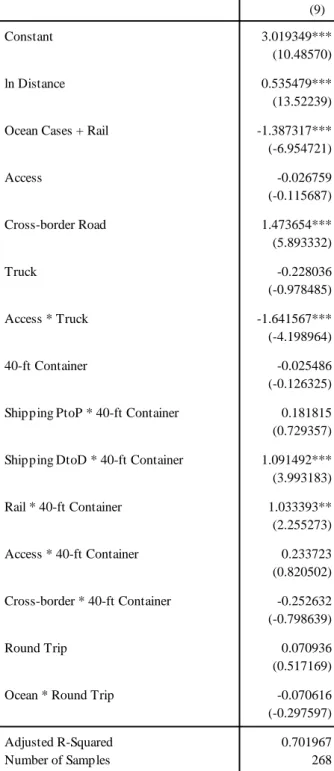
Table 5 shows the estimated results of all the samples of transportation prices in relation to the same kinds of variables shown in Column (8) of Table 4. As in the previous cases, the coefficients of geographical distance show robust positive signs. The variable of “coastal cases and railway” is a variable to control for the road transportation samples. The base category of mode of transportation is “domestic road.” The coefficient of “access road” does not show a significant difference with domestic roads. On the other hand, the coefficient of the cross-border roads is positive and statistically significant. Regarding the container dummies, the base category is 20-ft container. The coefficient of the price of truck transportation (non-trailer) on domestic roads is negative, but is not
17
Table 5. Estimated results of cargo transportation costs with all samples
Notes: 1) ***, **, *, indicate statistically significance at 1%, 5%, and 10% levels, respectively. 2) Category bases are coastal transportation in Vietnam with a 20-ft container for a one-way trip. Source: Calculated by the author based on the data of the questionnaire and interview survey.
(9)
Constant 3.019349***
(10.48570)
ln Distance 0.535479***
(13.52239)
Ocean Cases + Rail -1.387317***
(-6.954721) Access -0.026759 (-0.115687) Cross-border Road 1.473654*** (5.893332) Truck -0.228036 (-0.978485) Access * Truck -1.641567*** (-4.198964) 40-ft Container -0.025486 (-0.126325)
Shipping PtoP * 40-ft Container 0.181815
(0.729357) Shipping DtoD * 40-ft Container 1.091492*** (3.993183) Rail * 40-ft Container 1.033393** (2.255273) Access * 40-ft Container 0.233723 (0.820502) Cross-border * 40-ft Container -0.252632 (-0.798639) Round Trip 0.070936 (0.517169)
Ocean * Round Trip -0.070616
(-0.297597)
Adjusted R-Squared 0.701967
18
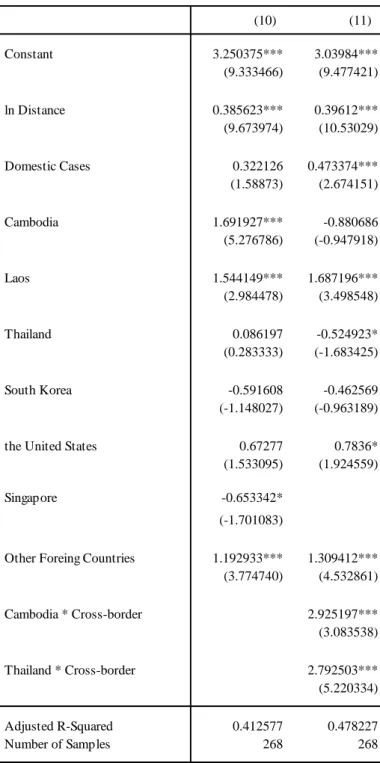
Table 6. Estimated Results with Country Dummy Variables
Notes: ***, **, *, indicate statistically significance at 1%, 5%, and 10% levels, respectively. Source: Calculated by the author based on the data of the questionnaire and interview survey.
(10) (11) Constant 3.250375*** 3.03984*** (9.333466) (9.477421) ln Distance 0.385623*** 0.39612*** (9.673974) (10.53029) Domestic Cases 0.322126 0.473374*** (1.58873) (2.674151) Cambodia 1.691927*** -0.880686 (5.276786) (-0.947918) Laos 1.544149*** 1.687196*** (2.984478) (3.498548) Thailand 0.086197 -0.524923* (0.283333) (-1.683425) South Korea -0.591608 -0.462569 (-1.148027) (-0.963189)
the United States 0.67277 0.7836*
(1.533095) (1.924559)
Singapore -0.653342*
(-1.701083)
Other Foreing Countries 1.192933*** 1.309412***
(3.774740) (4.532861) Cambodia * Cross-border 2.925197*** (3.083538) Thailand * Cross-border 2.792503*** (5.220334) Adjusted R-Squared 0.412577 0.478227 Number of Samples 268 268
19
statistically significant. On the other hand, the coefficient of truck transportation on access roads is negative and statistically significant. Regarding 40-ft containers, the price difference with 20-ft containers is not expected to be large on roads, but is expected to be larger for shipping. This is because some forwarders set the same price for transporting 20-ft and 40-ft containers. In contrast, the price of transporting 40-ft containers by sea should be higher than of transporting 20-ft containers because the space to be occupied is twice in case of ft containers. With this in mind, cross terms of shipping PtoP and 40-ft containers and those of shipping DtoD and 40-40-ft containers are both positive, with the latter showing statistical significance. In addition, railways also differentiate prices between 20-ft and 40-ft containers. Using the variable of 40-ft containers with a category base of domestic roads, the cross terms of access roads and 40-ft containers as well as of cross-border trips and 40-ft containers do not show statistical significance, as expected. Regarding the negative signs of the cross terms with cross-border trips, this might be caused by differentiating the too highly positive signs of cross-borders. The variables of round trips on the road do not show negative signs, as expected.
3.4 Analyses on Countries of Origin and Destination
Table 6 shows estimated results of transportation prices with country variables. The coefficients of geographical distance are positive with statistical significance. The variable of “domestic cases” is used to control the samples. The country dummies are Cambodia, Laos, Thailand, South Korea, the United States, and Singapore. The base category is set to China which has relatively lower transportation prices.
In Column (10), the coefficients for Cambodia and Laos are positive and statistically significant at the 1% level. The positive and statistically significant sign of the coefficient for the United States dummy may be because of longer distances with Vietnam and the control variable of the geographical distance does not explain the longer distance well.
Column (11) separates Cambodia and Thailand dummy variables into cross-border cases; and the category base is shipping in case of Thailand and Cambodia. For the Cambodian dummy variables, the sea shipping case tends to decrease the transportation price, while the cross-border transportation cost between Vietnam and Cambodia is extremely high and the price difference is 3.9 times as same as the transport cost with China. The category base of the Thailand dummy variable is the sea shipping case and is negative and statistically significant; this reflects the relatively lower price of having a direct shipping route between Hanoi and Bangkok. On the other hand, the cross terms of cross-border trips and Thailand show statistically significant positive signs.
20
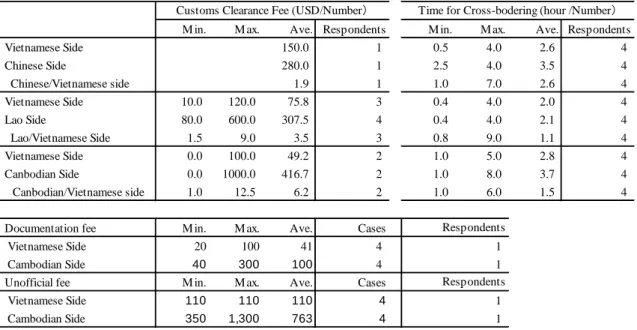
Table 7. Customs clearance fees and time required for cross-border procedures at the Vietnamese borders with China, Laos, and Cambodia
Notes: 1) Exchange rate is assumed to be VND 22,500 per 1 USD.
2) Regarding the comparative ratios between Vietnam and other countries, “Min.” means the ratio of the lower limit to the upper limit, while “Max.” means the ration of the upper limit to the lower limit.
3) The border with China represents cross-border transportation by way of the “Lan Song– Pingxiang” border.
4) The border with Laos includes cases of cross-border transportation between Hanoi and Bangkok, between Da Nang and Vientiane, and between Da Nang and Savannakhet (or Attapeu).
5) The border with Cambodia includes crossings by way of the Moc Bai–Bavet border and includes transportation from Ho Chi Minh City to Bavet, Phnom Penh, and Bangkok.
6) The comparative ratio between Vietnam and Cambodia is calculated with an assumption that it is equal to one even though the respondent answered that the custom clearance fees at both sides of Vietnam and Cambodia are equal to zero.
7) The customs clearance fee in case of round trip between Ho Chi Minh City and Bavet is calculated as the summarized value the fees on both sides.
Source: Based on questionnaire surveys and interviews with freight forwarders in Vietnam conducted in 2017.
and time required for cross-border procedures at the Vietnamese borders with China, Laos, and Cambodia. Comparing the customs clearance fees of the Vietnamese side with the other countries’ sides, the former is lower than the latter (Ishida et. al. 2019). This is partly because the customs clearance fees for exporting are usually lower than those for importing, and partly because the customs officers tend to more strictly check foreign forwarders than domestic forwarders. Compared to the Vietnamese side of the border, the
M in. M ax. Ave. Respondents M in. M ax. Ave. Respondents
Vietnamese Side 150.0 1 0.5 4.0 2.6 4 Chinese Side 280.0 1 2.5 4.0 3.5 4 Chinese/Vietnamese side 1.9 1 1.0 7.0 2.6 4 Vietnamese Side 10.0 120.0 75.8 3 0.4 4.0 2.0 4 Lao Side 80.0 600.0 307.5 4 0.4 4.0 2.1 4 Lao/Vietnamese Side 1.5 9.0 3.5 3 0.8 9.0 1.1 4 Vietnamese Side 0.0 100.0 49.2 2 1.0 5.0 2.8 4 Canbodian Side 0.0 1000.0 416.7 2 1.0 8.0 3.7 4 Canbodian/Vietnamese side 1.0 12.5 6.2 2 1.0 6.0 1.5 4
Documentation fee M in. M ax. Ave. Cases
Vietnamese Side 20 100 41 4 1
Cambodian Side 40 300 100 4 1
Unofficial fee M in. M ax. Ave. Cases
Vietnamese Side 110 110 110 4 1
Cambodian Side 350 1,300 763 4 1
Customs Clearance Fee (USD/Number) Time for Cross-bodering (hour /Number)
Respondents
21
customs clearance fees at the Cambodian side are 6.2 times higher, those on the Laotian side are 3.5 times higher, while those on the Chinese side are 1.9 times higher. Regarding the customs clearance fee on the Cambodian side, one forwarder responded that the fee was zero USD, while another forwarder responded that it was USD 1,000. One forwarder replied that the documentation fees for customs clearance range from USD 20 to USD 100 on the Vietnamese side and from USD 40 to USD 300 on the Cambodian side, plus unofficial fees may be incurred if there are some errors in documentation. The average reported times required for cross-border procedures are 6.1 hours at the Vietnam–China border, 4.1 hours at the Vietnam–Laos border, and 6.1 hours Cambodia–Vietnam border. The minimum times required for customs clearance were replied as 3.0 hours, 0.8 hours, and 2.0 hours for these border crossings, respectively. The shorter time required when crossing the Vietnam–Laos border reflects the implementation of single-stop inspection at the Lao Bao–Denh Savanh border starting on 6 February 2015, the result of efforts by border officials of both countries. At the border, border officials of both sides are separated into two groups, and one group from the Laotian side conducts the inspection on the Vietnamese side of the border, and one group from the Vietnamese side conducts the inspection on the Laotian side of the border. Customs, quarantine, and immigration inspections are conducted only once when a vehicle enters the other side.
IDE-JETRO (2017) estimated the logistics costs between Vientiane and Bangkok; it also determined the customs clearance fees at the border. The Thai fee was between USD 133 and 150 while the Lao fee was between USD 200 and 217. As shown in Table 7, the customs clearance fees in Cambodia are higher than those in Laos. The higher cross terms of cross-border trips and Thailand are caused by the relatively higher customs clearance fees in Cambodia and Laos.
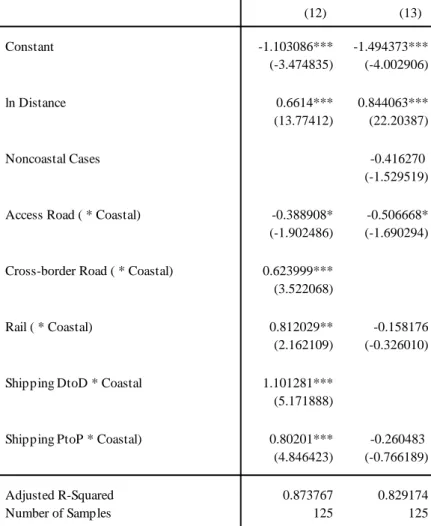
4. Estimation of Time Required for Transport
In accordance with Formula (3), we also estimated the time required for transportation using geographical distance and other dummy variables (Table 8). Column (12) shows all cases and Column (13) focuses on cases of coastal transportation between Hanoi and Ho Chi Minh City by controlling with the “noncoastal cases” variable.
As for Column (12), the category base is domestic road traffic. The effect of “access road cases” on the time required for transportation is negative with statistical significance at the 10% level. This is because the distance is shorter for transportation on access roads than for transportation on other domestic roads; the average distance of the former is 55 km and that of the latter is 931 km. Cross-border transportation is statistically significant
22
Table 8. Estimated Results of Time Required for Transport
Notes: ***, **, *, indicate statistically significance at 1%, 5%, and 10% levels, respectively. Source: Calculated by the author based on the data of the questionnaire and interview survey.
and increases the time required for transportation by 62%. Using different modes of transportation also leads to an increase in the time required, and all categories showed statistical significance: railway (81%), shipping PtoP (80%), and shipping DtoD (110%).
As shown in Column (13), “access roads” shows negative signs with statistical significance. On the other hand, the coefficients of “railway” and “shipping PtoP” are unexpectedly negative, but are not statistically significant. These results do not appear to reflect the real situation.
Concluding Remarks
This paper tried to verify some hypotheses based on findings of the survey on cargo
(12) (13) Constant -1.103086*** -1.494373*** (-3.474835) (-4.002906) ln Distance 0.6614*** 0.844063*** (13.77412) (22.20387) Noncoastal Cases -0.416270 (-1.529519)
Access Road ( * Coastal) -0.388908* -0.506668*
(-1.902486) (-1.690294) Cross-border Road ( * Coastal) 0.623999***
(3.522068)
Rail ( * Coastal) 0.812029** -0.158176
(2.162109) (-0.326010)
Shipping DtoD * Coastal 1.101281***
(5.171888)
Shipping PtoP * Coastal) 0.80201*** -0.260483
(4.846423) (-0.766189)
Adjusted R-Squared 0.873767 0.829174
23
transportation cost and time required for transport conducted in Vietnam in 2017. As shown in previous studies, the effects of geographical distance are the most robust variables for cargo transportation cost. Income levels of transportation origin and destination are not highly corelated with cargo transportation cost without cross terms with GDP and GDP Capita of the origin. This is because transportation costs vary by mode of transport. Thus, by adding the cross terms for dummy variables of cross-border roads and of access roads, certain coefficients of GDP and GDP per capita of the origin become positive. These effects are thought to be the effects of the service costs for logistics and of worker wages.
In cases focusing on coastal transportation between Hanoi and Ho Chi Minh City by way of Da Nang—which provides forwarders and consignors with various options for mode of transportation including trucks, railway, and ships—the coastal road transportation dummy was positive for the shipping dummy from port to port with statistical significance. The shipping transportation dummy variables from port to port and from door to door are negatively significant with the coastal road dummy variable. Showing the price differences among transport by road, shipping from port to port and shipping from door to door is one of the contributions of this paper. As expected, the effects of transporting with 40-ft containers are not clear for road transport, but the difference in the transportation costs between 20-ft and 40-ft containers for shipping by sea was not statistically significant for coastal transport.
However, considering the effects of all samples, the difference in transportation costs between 40-ft and 20-ft containers was significant in the case of shipping DtoD as compared with domestic road transport. On the other hand, the price difference is smaller for domestic road transport. Some forwarders actually do not differentiate the price of transporting 20-ft or 40-ft containers for road transport. Instead, they tend to transport light cargo in 40-ft containers and heavy cargo in 20-ft container because gross weight is regulated the same way for 20-ft and 40-ft containers, but the weight of a 40-ft container is heavier than that of a 20-ft container. Therefore, the gross weights are not different between transporting 20-ft and 40-ft containers. Interestingly, as a 40-ft container occupies twice the space of a 20-ft container by shipping and by railway, the price of transporting a 40-ft container is sometimes twice as high as that of transporting a 20-ft container. It is one of the largest contributions of this paper to show the price differences for shipping and the equivalence for road transportation between 20-ft and 40-ft containers. In addition, the price of transporting with a truck (not a trailer with a container) is lower even than transporting with 20-ft and 40-ft containers.
24
domestic road transportation was statistically significant. Especially when considering the effects of country dummy variables, there are higher customs clearance fees at the borders between Vietnam and Cambodia as well as Vietnam and Laos. The dummy variable of Thailand, in the case of cross-border transport, was perhaps affected by the higher customs clearance fees in Laos. Clearly illustrating the higher cross-border costs is another contribution of this paper. Between Hanoi and Bangkok, cross-border road transportation was popular when there were no direct ships and transportation by sea took 10 to 14 days by way of Ho Chi Minh City or Hong Kong (Ishida 2013b). Direct shipping, however, has been available since around 2014 and the transportation charges for shipping between Hanoi – Laem Chabang are much lower as shown by the negative and statistically significant coefficient of the Thailand dummy with shipping by sea. Thus, cross-border road transportation between Hanoi and Bangkok no longer has any competitive advantages.
Finally, the time required for transportation is also greatly affected by geographical distance. In the analysis, I estimated the time required for transportation in two cases: one case treats all samples without controlling for the coastal transport, and the other case focuses on the coastal transportation between Hanoi and Ho Chi Minh City. The latter case did not show meaningful results. The former case, however, clearly shows the effects of the mode of transport; compared with domestic roads, transport by rail, shipping PtoP, and shipping DtoD, transporting by cross-border routes requires additional transportation time. On the other hand, transportation with access roads to/from ports and airports requires shorter transportation times.
This paper approached cargo transportation costs in a more direct way by conducting questionnaire and interview surveys, in contrast with many better-known studies. Thus, this study not only examines international transportation costs, but also domestic transportation costs including access roads to/from ports and airports. However, the number of samples was limited, and the dataset does not include time series or panel data. As a future possible study, I would like to conduct the same survey again in several years. Yet, in order to improve the shortcomings of this analysis, I asked a forwarder located in Hanoi about the transportation costs between Hanoi and Ho Chi Minh City. According to this forwarder, the transportation costs from Hanoi to Ho Chi Minh city was VND 24,120,000 for 40-ft containers in 2008, but this fell to VND 17,640,000 in 2019, a reduction of 26.9%. In contrast, the costs from Ho Chi Minh City to Hanoi increased from VND 18,900,000 to VND 28,500,000, or by 50.8%. According to the forwarder, however, the demand from Ho Chi Minh City to Hanoi has decreased while that from Hanoi to Ho Chi Minh City has increased. The reason why transportation costs from Hanoi have
25
increased is that the number of new freight forwarding firms has increased along with the increased demand for the services they provide and as such, competition has also increased. In contrast, the reason costs from Ho Chi Minh City have increased is due to the fact that consignors have tended to utilize railways and ships while using road transportation for only urgent cases.
References
Banomyong, R., Thai V. V. and Yuen Kum Fai (2014) “Assessing the National Logistics System of Vietnam,” Asian Journal of Shipping and Logistics, Vol. 31, No. 1, Elsevier, 21 – 58.
Christ, N., M. J. Ferrantino (2011) “Land Transport for Export: the Effects of Cost, Time, and Uncertainty in Sub-Saharan Africa,” World Development, Vol. 39, No. 10. De, P.(2009) “Trade Transportation Cost in South Asia: an Empirical Investigation,”
Brook, D. and D. Hummels ed. Infrastructure’s Role in Lowering Asia’s Trade Costs: Building for Trade, Cheltenham: Edward Elgar, 230 – 259.
He, C. and C. Li and J. Walley (2017) “General Equilibrium Trade Modelling with Canada-US Transportation,” NBER Working Paper Series, No. 23500.
Hummels, D. (2007) “Transportation Costs and International Trade in the Second Era of Globalization,” Journal of Economic Perspectives, 131 - 154.
IDE-JETRO (2017) “Logistics Cost in Lao PDR: Policy – Oriented Research Project Report,” at a website: http://www.ide.go.jp/library/Japanese/Event/Reports/ pdf /20170224_finalreport.pdf.
Ikebe, R. (2018) “Developments and Challenges of Logistics in Viet Nam (In Japanese),” Ishida and Umezaki ed. Transport Infrastructure and Developments of Logistics in the Mekong Region (in Japanese), Institute of Developing Economies, Japan External Trade Organization (IDE-JETRO), at a website: http://www.ide.go.jp /Japanese/Publish/Download/Report/2017/2017220005.html, 113 - 133.
Ishida, M (2013) “What is Cross-Border Transport Agreement (CBTA)?,” Ishida, M. ed. Border Economies in the Greater Mekong Subregion, London: Palgrave-Macmillan, 53-76.
____ (2019) “Road Infrastructure Development of the Three Economic Corridors of the Mekong Region (in Japanese),” Tran, V. T. and S. Karikomi ed. Asian Dynamism
and Mekong River Basin Development (in Japanese), Bunshindo: Tokyo, 29-62.
26 Discussion Paper, No. 743.
Ishida, M. and I. Isono (2012) “Old, New and Potential Economic Corridors in the Mekong Region,” Ishida, M. ed., Emerging Economic Corridors in the Mekong Region, BRC Research Report No. 8, Bangkok Research Center, IDE-JETRO at a website:http://www.ide.go.jp/English/Publish/Download/Brc/08.html, 1 - 42. JETRO (2008) ASEAN Logistics Network Map, 2nd Edition, Tokyo: JETRO.
Lu, C. S. and C. C. Lin (2012) “Assement of National Logistics Competence in Taiwan, Vietnam, and Malaysia,” the Asian Journal of Shipping and Logistics, Vol. 28, Number 2, 255-274.
Stephen S. G. and B. Tomasik (2008) “Measures of International Transport Cost for OECD Countries,” OECD Department Working Papers, No. 609, Paris: OECD Publishing.