writing fluency from a complex dynamic systems
perspective: An exploratory study
Kyoko BABA
Abstract
This exploratory study investigated the developmental trajectories of the L2 writing fluency of university students when the same task procedure was repeatedly used in an actual class-room throughout an academic year, and searched for factors that might have contributed to the different patterns of trajectories. The participants of the study were 105 freshmen in five university classes. They wrote a narrative composition on a chosen topic for 10 minutes along with reflective writing in L1. IGC modeling revealed that the students’ writing fluency did change with repetition, with a slope of about +0.6. In addition, their initial writing fluency and rate of change varied significantly from person to person, and the relationship between them was weak (i.e., those who showed high fluency at first did not always develop at a great rate, and vice versa). A cluster analysis classified two groups of different trajectories: upward and stagnant. It was shown that the best predictor of the two groups was the quality of reflective writing in L1. Case studies further identified possible contributing factors to the distinction of the two groups, such as abilities to devise effective writing strategies and to develop and elaborate a story.
Introduction
I have been teaching second language (L2) academic writing for more than 10 years. As a teacher and researcher, I have always been interested in how my students develop their writing ability. “Do some students develop their L2 writing ability to a greater extent than
others?” “Is there any moment at which individual students abruptly change their way of
writing and increase their writing ability?” “Why do some students seem to fail to foster their
writing ability even though they engage in the same tasks as others?” These are the types of questions that I have endeavored to study. That is, they are about the processes and mecha-nisms of learning and development in context.
L2 writing research to date has largely lacked both a developmental model (Polio, 2012) and “methodologies that can capture development” (Manchón, 2016, p. 9). For example, to
investigate the effects of various types of feedback or pedagogical method, a typical approach has been to compare before and after the treatment with a two-wave design, using statistical analyses such as t testing and ANOVA (e.g., Kern & Schultz, 1992; Nicolás-Conesa, Roca de Larios, & Coyle, 2014; Liao & Wong, 2010). Such an approach may suggest that learners in question tend to write (or not to write) a better essay as a group, but it does not show how this did or did not happen to each student, or whether students share a similar developmental trajectory.
As discussed in more detail below, in recent years studies from a complex dynamic systems theory (CDST) approach have started to throw light on the developmental aspects of SLA. For instance, I myself conducted such a study focusing on two students (Baba & Nitta, 2014). We found that both students experienced at least two phase shifts by repeating a narrative-like timed writing task every week for one year. The finding from this small case study led me to subsequent questions: “What about the other students? Did they develop similarly or differently? If different, how did they diverge from each other?” The purpose of this explora-tory study is to delineate and classify developmental trajectories of L2 writing fluency when the same task procedure was repeatedly used in an actual university classroom throughout an academic year.
Research on Changes in L2 Writing
To trace the developmental trajectory of individual learners, longitudinal and multi-wave research is indispensable. Yet, such research is rare in L2 writing research. Some case stud-ies did highlight changes in L2 writing (e.g., Kobayashi & Rinnert, 2013; McCarthey, Guo, & Cummins, 2005; Weissberg, 1998), but they are primarily qualitative and tend to fail to track developmental trajectories. For example, Kobayashi and Rinnert (2013) focused on a univer-sity student, Natsu, who was learning two second languages, and described how her writing in these two languages and the mother tongue changed over 2.5 years. They used multiple types of data, including language measures (fluency, syntactic and lexical complexities), text
features, and interview data. Their analyses of Natsu’s essays are detailed and showed that
her writing developed in many aspects, both linguistically and socially. Yet, since they com-pared two essays that were written at the beginning and end of the research period, it is hard to know when and how these changes occurred, except that Natsu reflected on her own changes during an interview. If the main purpose of a study is to examine developmental
tra-jectories (which is not the case with Kobayashi and Rinnert’s study), such personal reflection
should be corroborated by other types of data.
The investigation of individual trajectories of learning L2 has been a principal purpose of CDST research since Larsen-Freeman (1997) demonstrated that none of the five focal par-ticipants in her study followed the “average” trajectory. The majority of CDST studies on L2 writing have looked at developmental trajectories of complexity, accuracy, and fluency (e.g.,
a series of studies conducted by Verspoor and her colleagues, such as Spoelman & Verspoor, 2010 and Verspoor, Lowie, & van Dijk, 2008; Baba & Nitta, 2014), but others have traced dif-ferent aspects of L2 writing such as formulaic sequences (Verspoor & Smiskova, 2012) and authorial voice (Fogal, 2017). These studies yielded significant findings in L2 writing develop-ment pertaining to how individual learners changed their ways of writing.
Such analyses of individual learners require multiple data collections from each participant, and close examination of the data is laborious, so it is natural that most CDST studies in SLA so far are small case studies, often focusing on a small number of participants. Nevertheless, because the CDST approach espouses the unique developmental trajectories of individual learners, it is also important to explore the development of a larger number of learners and compare their trajectories. The comparison of developmental trajectories is congenial to teachers in classroom because they hope to learn not only how each student develops but also how a whole class and some groups of students in the class develop.
Comparing Individual Developmental Trajectories
There are only a few studies that analyzed developmental trajectories in L2 writing both at the individual and group levels (Vyatkina, 2012; Nitta & Baba, 2014, in press). For example,
Vyatkina (2012) focused on two learners’ writing complexity in L2 and compared their
tra-jectories with that of their cohort. Similarly, Nitta and Baba (2018) focused on two students and traced their writing development coupled with other variables such as motivation and use of strategies, and compared their performance with that of the whole class.
One limitation of this analytical method is that while it can elaborate the few focal learners’ trajectories, the information about the other learners in the cohort is only used as background information or a target for comparison, and thus treated as a mass. It is unclear whether some students widely deviate from the other students or if it is possible to classify their trajectories.
One way to analyze multiple people’s developmental trajectories is individual growth curve
(IGC) modeling, which is used in the fields of child psychiatry, psychology, and neuropsy-chology (e.g., Jackson, Schatschneider, & Leacox, 2014; Lavelli, & Fogel, 2002; McKean, Men-sah, Eadie, Bavin, Bretherton, Cini, & Reilly, 2015; Morgan, Farkas, & Wu, 2011; Sansavini, Pentimonti, Justice, Guarini, Savini, Alessandroni, & Faldella, 2014; Song, Su, Kang, Liu, Zhang, McBride-Chang, Tardif, Li, Liang, Zhang, & Shu, 2015; Tek, Mesite, Fein, & Neigles, 2014). The studies using the IGC approach often model trajectories of specific skills and knowledge of children, and examine how groups of children with a different characteristic or propensity differ from each other in their developmental paths.
For example, McKean et al. (2015) investigated the linguistic abilities of nearly 2,000 chil-dren in Australia, including ESL chilchil-dren. They collected data from each child eight times by means of multiple tests and questionnaires when the children were 4 through 7 years old. They conducted an IGC analysis on the data and made some notable findings concerning the
factors that affected the children’s trajectories of linguistic development. One of the findings was that the linguistic proficiency of ESL children was lower than English-native-speaking children at the age of four, but they tended to catch up quickly. However, it took three to five years for those who had few story books at home to catch up, during which period critical academic skills are usually acquired. Thus, McKean et al. (2015) successfully showed that different groups of children followed varied developmental trajectories. Their findings are more convincing and replete with pedagogical implications than those from two-wave studies. The present study utilizes IGC modeling, but it is more exploratory than the IGC studies cited above. Those studies set a priori categories or groups of participants and then compared their developmental trajectories. For example, Morgan et al. (2011) compared developmental trajectories in reading and mathematics of children with learning disabilities or speech lan-guage impairments and non-disabled children; Sansavini et al. (2014) compared trajectories in linguistic, motor, and cognitive skills among extremely low gestational age babies and their full-term peers. In contrast, this study searches for groups with a different developmental path in an exploratory way. That is, it does not start with a hypothesis, such as that a specific group of students will develop differently from other groups. Rather, it explores and describes
the behavior of individuals’ developmental trajectories, and if at all possible, searches for
groups of developmental paths, and then looks back and identifies factors that might have contributed to the grouping. This method, in which events that already happened are ana-lyzed retrospectively to infer the mechanism or process that might have caused them (either directly or indirectly), is called retrodiction (Dörnyei, 2014).
One study that analyzes longitudinal data using the retrodictive method is Song et al. (2015). In their study, more than 250 children were tested on their L1 vocabulary knowledge and related cognitive skills when they were at the age of four through 11. They calculated an estimated initial value (an intercept) and growth rate (a slope) for individual children and clustered them into three groups: a group with a high intercept and high slope, a group with a low intercept and high slope, and a group with a low intercept and low slope. They then
examined if there were significant differences in the three groups’ performances in
reading-related skills such as phonological and morphological awareness and reading fluency and com-prehension. Their results show that the three groups significantly differed for most indices (especially phonological and morphological skills), and also that both the intercept and the
slope significantly explained the children’s reading proficiency at the age of 11.
The present study begins with an examination of whether the students’ initial fluencies
(intercepts) and growth rates (slopes) significantly varied from individual to individual or if
they are similar as a whole. If they vary by individual, it clusters students’ growth rates and
assesses what factors may have contributed to the grouping. Thus, the research questions of the study are the following.
(1) Do Japanese university students follow a similar developmental trajectory of writing fluency in English when they repeat the same narrative writing procedure every week over one academic year?
(2) If the students’ developmental trajectories vary by individual, what distinguishes
those who showed a marked progress from those who did not?
(3) What are the characteristics of the students who did and did not benefit from the timed-writing task?
Methods Setting
The data were collected in five university classes of a course (Classes 1 through 5) over one academic year (about 30 weeks in total), all of which were taught by me. I taught the same course every year in the same way over the five years, so the students were in a differ-ent cohort but learned the same contdiffer-ent with the same syllabus. The course was one of the mandatory EFL courses for freshmen, and it was the only course that focused on academic writing skills. All of the students belonged to the English department of the university and were to major in English literature, culture, or linguistics. They had not chosen their area of specialty at the time of the study, so many of the courses they were taking were more or less the same.
We met once a week for 90 minutes. A class usually involved a timed-writing task, which is a focus in this study, a translation activity from Japanese to English focusing on grammar, and activities to learn academic writing such as paragraphing and logical argumentation. The stu-dents were required to write two academic essays per semester, and the focal timed-writing tasks were the only opportunity for them to do narrative-like writing.
Participants
The participants of the study were 105 freshmen in the five classes described above. They attended the class regularly throughout the academic year, though some of them missed a few classes. As discussed later, the statistical method of this study is robust against missing data (i.e., it can be used even when data were collected from each participant a different number of times at a different timing), so all data were used for the analysis.
The students’ mother tongue was Japanese, and they had received six years of formal
Eng-lish education before entering the university. When they entered the university, they took a placement test and were classified into five groups according to English proficiency. One group consisted of about 20 students, and the five classes of the study ranked the second best group. That is, while they belonged to a different cohort, their relative English proficiency to the students in each cohort was similar. Freshmen in my department had to take the TOEIC
test in May (at the beginning) and January the next year (at the end) every year (note that this is not the placement test). Table 1 lists the averages and standard deviations of
each class’s scores on the TOEIC test in May. The one-way ANOVA F test was significant:
F (4,99) = 2.93, p = .03. Post hoc comparisons using the Tukey HSD test suggest that there was a significant difference between Classes 2 and 3. Nonetheless, since there were no marked differences among classes, and also because the purpose of this study is not to examine the differences in the five classes, all students are treated as a group in the subsequent analyses.
Table 1
Means and Standard Deviations for the Five Classes on the TOEIC Test
Class M SD 1 (n = 23) 390.43 37.93 2 (n = 22) 373.64 72.42 3 (n = 21) 429.29 64.58 4 (n = 18) 381.50 61.05 5 (n = 20) 392.60 47.19
No students had ever done a timed-writing task like the one used in the study either in English or in Japanese before university (except for a few students who had experienced a similar narrative writing task, but just once or a few times). The typical writing activity that they had done in junior high and high school was to translate Japanese sentences into English, so the focal task was the first experience for most of them to write their own ideas and thoughts. The lack of similar writing experience was advantageous for the purpose of the study, as it enabled me to observe their development from the start. This is particularly important due to the sensitivity to initial conditions assumed by the CDST theory.
Task and Procedure
The task used in this study was timed narrative writing, where students wrote a compo-sition on a chosen topic for 10 minutes. The students were given a list with three different topics each time. The aim of offering three topic options was to compensate for differences
in the students’ individual experiences and preferences. For example, students could choose
from: (1) “What characteristics do you regard as important in a person you would choose as
a friend?”, (2) “What factors make a job or career satisfying for you?”, and (3) “What was
the most important event of your life? Discuss why this event was so important.” We tried to select topics that were personal and required little background knowledge. All the topics were written both in Japanese and English. The same list of three topics was used for two weeks, and the students were told to write on the same chosen topic twice. Then, another new topic list was handed to them the following week. Thus, a total of 32 topics were pro-vided over the academic year. I used the same set of topic lists in the same order for all the
five classes with a few minor revisions. For example, I revised the topic lists for the second class (in the second year), and replaced some topics that had been chosen by less than two students in the previous year with similar topics (e.g., “Which courses that you did not take in high school do you now wish you had taken? Why?” was replaced with “What was your most favorite subject in high school? Explain why.”).
Immediately after they had written their compositions, the students, except for those in Class 1, counted the number of words they had written and wrote it down on the sheet. They also recorded it on their attendance card so that they could see the changes in their own writ-ing fluency. This countwrit-ing procedure was introduced for an educational purpose in the second year, so the students in Class 1 did not do it. The students in all classes then evaluated to what extent they felt the topic was easy or difficult for them on a five-point Likert scale. They then wrote reflective comments on their writing in Japanese. The students in Class 1 wrote brief personal remarks in a small box under their composition (usually a few sentences). The box did not specify what they should write. Typical remarks that they wrote were concerned
with their weaknesses (“I couldn’t write much today.” “It was difficult to write in English
what I wanted to convey.” “I was not sure of the usage of relative pronouns.”).
I made a major revision of the form for the reflective comments in the second year, and used the revised form from then on. That is, the students in Classes 2 through 5 used the same revised template for their reflective comments. The revised form was printed on the reverse side of the composition to allow the students to write extensive reflective comments. In addition, it provided six boxes specifying a topic for comments. The first four boxes let the
writer to reflect on various aspects of the day’s writing: (1) grammar and vocabulary, (2)
organization and expression, (3) contents (such as episodes and examples), and (4) writing
processes and strategies. The next box was the place to compare the day’s and previous
com-positions (note that they had the previous composition at hand when they filled out this box). In the last box, they wrote goals for future compositions (e.g., in what way they would like to make progress). It usually took about 10 minutes for the students to complete the reflection form. All the comments cited in this paper are translations by the author.
I wrote a few encouraging comments every week after reading all the compositions and returned them the following week. As the aim of the feedback was to create the sense of
an audience and to maintain students’ motivation to write every week, I did not correct any
errors. I returned my feedback after the students had finished writing their compositions, so they did not look at their previous compositions or my feedback while writing a composition. On the first day of the course, I roughly explained the purpose of my research and asked them to sign a consent form to use their compositions and reflective comments for the re-search. I told them that the participation in the study was voluntary, but I would require all of them to engage in the timed-writing task as a course requirement. I also told them that I would not see their consent forms until I finished all the grading, so whether they signed the
form or not would not affect their grades. I then explained the 10-minute writing task. I told them to choose a topic from the list and write a composition on it for 10 minutes in English. I also explained how they were to write in each box of the reflection form, and showed some examples. After they started to write, I let them know that there was two minutes left to complete the composition (I did so every time they did the timed writing task). I then had them answer a questionnaire about their English proficiency and English learning experience, including writing experience in English. On the last day of the course, I conducted another questionnaire on what they thought of the writing task, in what ways they thought they had (or had not) made progress, and writing activities that they had done in other English courses.
Data and the Measure
A total of 2,947 compositions were collected from the 105 students. All of them were typed and were put through a software application that counted the number of words in each com-position. All spelling mistakes in the compositions were carefully corrected manually and with a spell checker. The other data collected from the students included (1) English proficiency at the beginning and end of an academic year, that is, scores on the TOEIC test in May and January, (2) their course grades in the first and second semesters, and (3) answers to the first (background information) and last questionnaires mentioned above. The students’ grades were standardized within each class (represented in z scores) so that they indicate
an individual student’s position in her class.
This study focuses on writing fluency, which is operationalized as the total number of words in a composition written in a specific time limit (10 minutes in this case). It is a simple but robust index to measure fluency. In fact, it has been shown to be one of the most notable characteristics that highly evaluated timed essays shared (Friginal, Li, & Weigle, 2014; Jarvis, Grant, Bikowski, & Ferris, 2003). Our previous study also demonstrated that it was useful to
examine changes in basic writers’ compositions (Baba & Nitta, 2014). I am not arguing that it
is the only or best measure of fluency, but it seems appropriate for the present study.
Analysis
Typical linear statistical methods used in SLA to assess development (such as t testing, ANOVA, and MANOVA) are not good at dealing with repetition (i.e., using multiple data from the same participants) because repeated observations are apt to violate the assumption of randomness of observations. Repeated measures of these tests do exist, but the acceptable number of repetitions is two. In contrast, the IGC modeling was developed to explore rates of change, so more observations will result in better models. In addition, it is robust against missing data and differences in the number of observations per participant. This modeling is also called the multilevel model for change, and it enables us to assess variability at both
indi-vidual and inter-indiindi-vidual levels. That is, observations can be nested within each indiindi-vidual. The individual level is called Level 1, while the inter-individual level is called Level 2. Level 1 examines how individuals change in terms of focal variable, and Level 2 assesses whether the change trajectories of individuals vary by individual, and what factors have affected the difference among the individual trajectories by building and comparing multiple models.
When conducting IGC modeling, it is necessary to choose a specific functional form for Lev-el 1 modLev-el (that is, to choose the basic shape of trajectories). I chose a linear change modLev-el because it is the simplest form, making the interpretation of the data straightforward (Singer
& Willett, 2003). That is not to argue that the students’ trajectories are linear, however. The
goal here is to gain an overall and general picture of developmental trajectories, so general-izing them to linear trends seems worthwhile. In building models, I used the number of week as a time scale. Note that because using the raw number of week (e.g., Week 1 = 1) makes the interpretation of intercept unnatural (it will suggest initial writing fluency on Week 0), the number of week minus 1 was used instead.
For the cluster analysis, I fit linear ordinary least squares (OLS) regression to each
stu-dent’s data individually to gain her intercept and slope, as this regression is robust with
miss-ing data (Song et al., 2015). All the statistical tests were conducted with SPSS.
Results
The results are presented in the order of the research questions below.
(1) Do Japanese university students follow a similar developmental trajectory of writing fluency in English when they repeat the same narrative writing procedure every week over one academic year?
(2) If the students’ developmental trajectories vary by individual, what distinguishes
those who showed a marked progress from those who did not?
(3) What are the characteristics of the students who did and did not benefit from the timed-writing task?
Research Question 1
Prior to analyses of how the students developed, it is necessary to confirm that their flu-ency changed with repetition and that the rate of change differed by individual. This provides the basis for further analysis and model building (Singer & Willett, 2003). Here, two models were fit to the data: (1) the unconditional means model and (2) the unconditional growth
model. The unconditional means model specifies that people’s true individual trajectory is
flat (Level 1, i.e., within a person) and that individual variation in each person’s elevation
expressed in the following equation.
Yij = π0i + εij (Level 1) (the unconditional means model)
π0i = γ00 + ζ0i (Level 2)
εij ~ N(0, σ 2
ε) and ζ0i ~ N(0, σ 20)
Subscripts i and j represent individuals and occasions, respectively. At Level 1, writing
flu-ency for student i at time j (Yij) is comprised of a true initial value (π0i, i.e., intercept) and
residual variance (εij). At Level 2, the level-1 intercept (π0i) consists of the population
aver-age of individual students’ intercepts (γ00) and measurement error (ζ0i).
The results of fitting the unconditional means model to the data are presented in Table 2. Since the associated null hypotheses (the population variance for each parameter is 0) are
rejected, it is confirmed that the students’ writing fluency varies over time (σ 2
ε = 404.413,
Wald Z = 37.523, p < .000), and also that their initial fluency differed from each other (σ 2
0 =
713.171, Wald Z = 7.066, p < .000).
The unconditional growth model examines whether there is meaningful variation in each
person’s true initial value (intercept) and rate of change (slope) (Level 2) when repetition
of the writing task is introduced as a fixed effect (Level 1). It is expressed in the following equation.
Yij = π0i + π1iWEEKij + εij (Level 1) (the unconditional growth model)
π0i = γ00 + ζ0i (Level 2)
π1i = γ10 + ζ1i
In this model, writing fluency for student i at time j (Yij) is the sum of a true initial value
(π0i), a slope of the true trajectory (π1i), and residual variance (εij) with a predictor WEEK
(Level 1). An individual parameter (π0i and π1i) consists of its average (γ00 and γ10) and
level-2 residual variance (ζ0i and ζ1i).
The results of fitting the unconditional growth model to the data are presented in Table 2. Since the associated null hypotheses are rejected for the two fixed effects (p < .000), we can estimate that the average true trajectory of writing fluency has an intercept of 80.97 and a slope of 0.617. More importantly, the variance components at Level 2 examine between-person variability in true initial value and rate of change. Since each associated null hypothesis is
rejected, it is revealed that there is significant variability both in the students’ initial writing
fluency (σ 2
0 = 404.413, Wald Z = 6.63, p < .000) and in their rates of change (σ 21 = .647, Wald Z
= 5.768, p < .000). The estimate of covariance between the two parameters is not significant (p = .164), meaning that the relationship between true initial writing fluency and its rate
significant (r = –.01, p = .91). This suggests that whatever writing fluency the students had when they started, this initial level does not explain how well they will develop later.
To summarize this section, the students’ writing fluency did change with repetition. It is
estimated that their fluency as a whole started at around 80 words and then increased with
Table 2
Results of Tow Unconditional Multilevel Models for Change (n = 105) Parameter Unconditional
means model growth modelUnconditional Fixed effects
Initial status, π0i γ00 Estimate 89.675 80.970
Std. error 2.633 2.288 df 104.002 103.993
t 34.062 35.383
p <.000 <.000
Rate of change, π1i γ10 Estimate .617
Std. error .088 df 104.320 t 7.024 p <.000 Variance components Level 1 Within-person, εij Estimate 404.413 327.310 Std. error 10.778 8.890 Wald Z 37.523 36.819 p <.000 <.000 Level 2
In initial status, ζ0i σ2
0 Estimate 713.171 505.610
Std. error 100.924 76.263 Wald Z 7.066 6.630 p <.000 <.000 In rate of change, ζ1i σ21 Estimate .647
Std. error .112
Wald Z 5.768
p <.000
Covariance
betweenζ0i and ζ1i σ01 Estimate 2.887
Std. error 2.073
Wald Z 1.393
p .164
Goodness-of-fit –2 Log likelihood 26228.442 25774.245 AIC 26232.442 25782.245 BIC 26244.401 25806.161
a slope of +0.617. Yet, both their initial writing fluency and rate of change varied significantly from person to person, and those who showed high fluency at first did not always develop at a great rate, and vice versa. Figure 1 displays the OLS trajectories of individual students with raw scores.
Figure 1. Individual OLS trajectories of writing fluency with raw scores for all students (N = 105).
Research Question 2
Now that I have demonstrated that the students’ developmental trajectories of writing
fluency varied by the individual, and also that their initial level of fluency did not predict the rate of change, the next question is what the differences were between those made a marked progress and those who did not. To answer this question, I utilized a cluster analysis. Clustering usually involves multiple measures to classify groups, but I used only slopes for the analysis, as the primary concern here is the developmental trend. Cluster analysis can be classified into two types: hierarchical and nonhierarchical. Since it is inherently an exploratory approach, I carried out both types of clustering. I first conducted a hierarchical clustering and obtained dendrograms. When compared with individual trajectories, it seemed that a very simple two-cluster solution was most meaningful. Then I performed non-hierarchical k-means clustering, and the results looked reasonable. Figure 2 shows a scatter plot of the students’ intercepts and slopes for the two cluster groups (they are called the upward and stagnant groups hereafter). Thirty-six students were classified into the upward group and 69 into the stagnant group. The average slope for the upward group was 1.54 (SD = 3.79), while that for the stagnant group was 0.14 (SD = .06). Yet, their averages of intercept were almost the same (79.04, SD = 3.79 for the upward group, and 80.81, SD = 2.88 for the stagnant group).
Yuri
Mami
Saya
Figure 2. Scatter plots for individual slope and intercept in upward-trend and stagnant-trend groups.
To investigate how the two groups differed, I compared them in terms of five available vari-ables (English proficiency at the beginning and end of the year, standardized grades in the first and second semester, and the nature of reflective writing). As mentioned above, the stu-dents in Class 1 wrote a short reflection (coded as 0 for the statistical analysis), while those Classes 2–5 wrote an extended reflection (coded as 1). Table 3 lists the means and standard deviations of the five variables for the two groups.
A one-way multivariate analysis of variance (MANOVA) was conducted to assess the effect of the two groups on the five dependent variables. Significant differences were found
among the two groups on the dependent variables: Wilks’s Λ = .87, F(5, 97) = 3.02, p = .014.
The multivariate ηp2 based on Wilks’s Λ was .14. Analyses of variances (ANOVA) on each
dependent variable were conducted as follow-up tests to the MONOVA. To control for Type I error, I used the Bonferroni method, making the significance level .01. As a result, only the
ANOVA on the nature of reflective writing was significant: F(1, 101) = 11.84, p = .001, ηp2
= .11. Thus, the only difference between the upward and stagnant groups was what kind of reflective writing they did after writing a composition.
Table 3.
Means and Standard Deviations for the Upward and Stagnant Groups
Upward group (n = 36) Stagnant group (n = 69)
Variable M SD M SD
Beginning English proficiency 400.71 68.50 388.48 55.16 End English proficiency 445.83 67.08 430.72 75.65 First-semester grade .13 .93 –.07 1.01 Second-semester grade .22 .72 –.12 1.08 Nature of reflective writing .97 .17 .68 .47
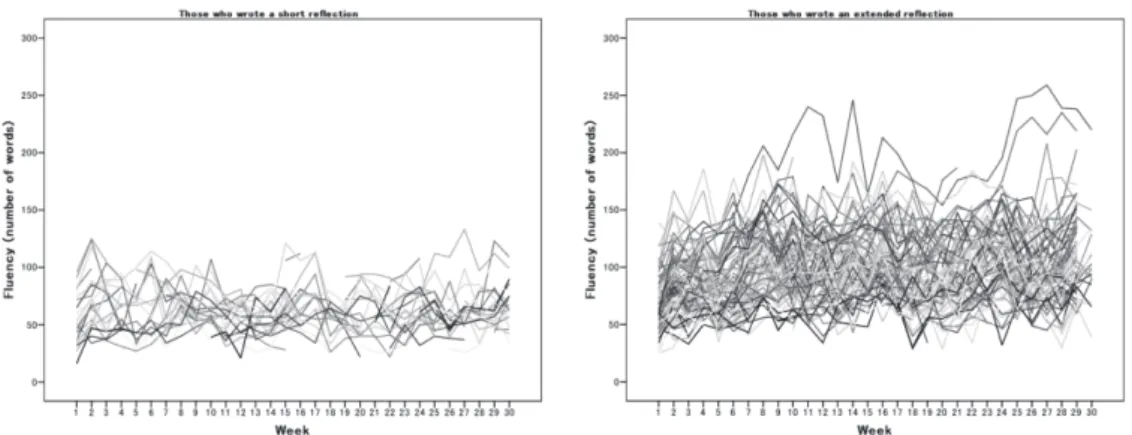
This finding supports that of Baba and Nitta (2011), which showed that students who wrote an extended reflection after every timed-writing task made more progress in writing fluency over an academic year than those who did not. Figure 3 compares the individual tra-jectories of those who wrote a short reflection (left panel) and those who wrote an extended reflection (right panel). Because there is a large gap in the number of students in the two groups, the thickness of the bundle of individual trajectories may look different, but it is clear from these figures that their overall trends are different. The trajectories for the short reflec-tion group display no upward trend, as reported in Baba and Nitta (2011), while those for the extended reflection group show an upward trend as a whole, though there seems to be great variability by the individual.
Figure 3. Individual trajectories of writing fluency for those who did or did not write an extended reflection after each timed-writing task.
Research Question 3
To answer the third research question, I conduct three case studies. Due to the exploratory nature of the study, the MANOVA analysis above examined only five variables, but there may be other factors that might have affected the developmental trend. One of my previous studies (Baba & Nitta, 2014) focused on two students who made a remarkable progress in
their writing fluency and experienced more than one phase transition. In Figure 2, three stu-dents on the extreme right look like outliers in that their incremental trends were extremely sharp compared with other students. It turned out that the two students in Baba and Nitta (2014) were two of the three outlier students. The one other outlier, Mami (pseudonym),
was chosen as the first case. The slope of her trajectory is 4.48 and the intercept is 91.68. In order to explore opposite cases, I searched for trajectories that had a clear downward trend with a low or average initial writing fluency. Since slope was calculated on the basis of linear OLS regression, it cannot be the sole reliable index to choose cases. Therefore, drawing on the results of OLS regression, I carefully examined the shape of each trajectory, and chose
two students. Yuri’s slope was the smallest of all the students, starting with a relatively high
writing fluency, and then showed a downward trend with wide fluctuations (slope: 105.25; intercept: –1.14). Saya stayed at an extremely low level of writing fluency throughout the academic year with a slight negative trend (slope: 42.67; intercept: –.29). Saya belonged to Class 1 and wrote a short reflection after writing, while Mami and Yuri wrote an extended reflection. The three case students are shown in Figure 2, and their trajectories are displayed
in Figure 4. The three students’ English proficiency level was similar: the first and last scores
on the TOEIC test were 375 and 420 for Mami, 350 and 425 for Yuri, and 350 and 435 for Saya respectively.
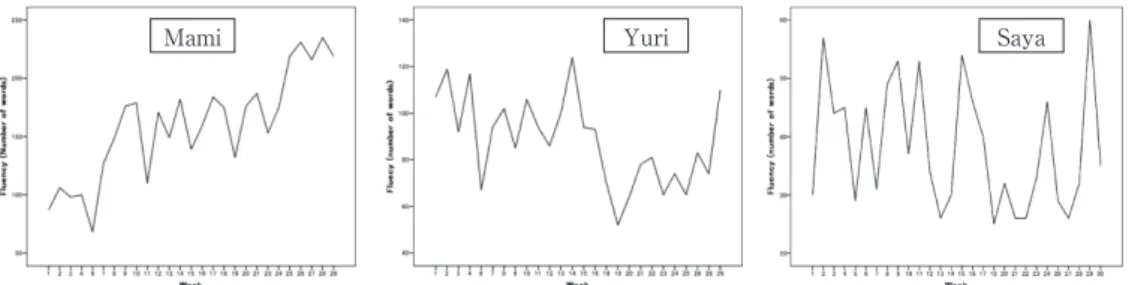
The three trajectories in Figure 4 look very different from each other. Mami’s trajectory
is surprisingly similar to those of the two students reported in Baba and Nitta (2014), in that they all show a sharp upward trend with distinct phases. It is not the focus of the present
study, so I will not carry out detailed analyses of Mami’s trajectories, but it seems that Mami
experienced two phase transitions over the academic year. In fact, a change-point analysis detected two change points: Week 8 (p = .01) and Week 25 (p = .01). The lengths of her com-positions in the first phase are around 100 words, but after Week 8 they fluctuate between about 150 and 200 words, and after Week 25 they surpass 200 words. On the other hand,
Yuri’s trajectory fluctuates between 80 and 120 words until Week 18, but after that it stays
between about 60 and 80 words except for the last composition. Saya’s trajectory fluctuates
between 30 and 60 words over the academic year.
Mami Yuri Saya
Insofar as writing fluency, it can be said that Mami benefited from the task greatly, while Yuri and Saya, unfortunately, did not. What distinguished these students? First of all, Saya and the other two students did very different reflective writing, as mentioned in the method section. The students in Class 1 tended to write only a few reflective sentences, and Saya was one of those who always wrote a very brief and negative comment. All but one of the comments that Saya wrote were about something she was weak at, or she could not do. A
majority of her comments went something like “I couldn’t do XXX.” (e.g., “I couldn’t write
many sentences.”), “It was difficult for me to XXX.” (e.g., “It is difficult for me to write on
any topic in English.”), or “I had no idea how to XXX.” (e.g., “I had no idea how to choose
appropriate words.”).
It seems that Saya was quite weak at writing. Table 3 presents two of Saya’s writing
sam-ples that she wrote at the beginning and end of the course. Their lengths were almost the same; that is, her writing fluency did not seem to improve so much. The contents of the two compositions look similar in that she just lists something she likes or enjoys. Yet, her writ-ing is relatively accurate for a learner at this level, and her grammatical accuracy seemed to improve from Week 4 to Week 24. For example, on the second line of the Week 4 composition she writes, “I think that do my favorite thing.” without putting a subject in this sentence, and on the third and fourth lines, there is the sentence “Sleeping are forget my unhappy thing.” in which the subject does not match the verb and the choice of the subject itself is incorrect. In contrast, although the composition on Week 24 may involve some minor errors such as incongruity between a subject and a verb (e.g., “listening to music and watching movie is” on line 3) and failure to pluralize (e.g., “many favorite source” on line 1), her writing became more intelligible than on Week 4. In addition, grammatical complexity in her writing seems to increase between the two compositions as well. For example, the average sentence length is 6.43 words on Week 4, but it becomes 7.67 on Week 24. Thus, one reason Saya did not improve her writing fluency might have been that she was a careful writer, paying more attention to accuracy and complexity than to fluency.
Table 3.
Saya’s Writing Samples (At the Beginning and End of the Course)
Week 4 Week 24
When I am unhappy, I listen to music. And I sing a song. Because I like music. I think that do my favorite thing. The music makes me happy. The other, I usually sleep. Sleeping are forget my un-happy thing, and make me feel better.
(45 words)
Writing topic: What factors make a job or career satisfying for you?
I have many favorite source of entertainment. One is to play with my dog. She is very pretty. So she is a healing of mine. Another, listening to music and watching movie is one of my many pleasures. Because the above makes me happy and active.
(46 words)
Writing topic: What is your favorite source of en-tertainment? Explain why.
There were two noticeable differences between Mami and Yuri: the motivation and strate-gies to improve writing fluency, and the way to develop a theme in writing. First, both Mami and Yuri mentioned in their reflection that they would like to write longer. Yuri frequently set a goal of “writing longer” and “writing over 120 (or 100 words)” for her future writing. However, she rarely elaborated on how to write a longer composition. Her reflections are often abstract, such as “I will think about structure.”, “I will try to write in a systematic man-ner.”, “I tried to divide sentences with a variety of words.”, and “I will assert my own opin-ions.” In contrast, the strategies that Mami described in her reflection were more concrete. For example, she wrote “I keep squeezing out things to say before stumbling over what to write.”, “I tried to write not only my painful experience in a psychological sense, but also that in a physical sense to expand the topic.”, “I wrote something that I really want to emphasize in the latter half.”, and “If I can write more quickly in a running hand, I would like to learn it.” These concrete strategies that Mami mentioned may indicate her strong motivation to write faster.
The second difference between Mami and Yuri was their way to develop a story in their writing. Table 4 displays their writing samples on the topic “What factors make a job or
ca-reer satisfying for you?” It is apparent that Yuri’s writing contains more repetition both in
form and content. For example, Yuri repeated “I hope that” and “enough rest periods” three
times, and “help poor person” twice. Such repetition is not observable in Mami’s writing. In
Table 4.
Writing Samples of Mami and Yuri on the Same Writing Topic
Mami (Week 10) Yuri (Week 10) What working conditions am I look for when
ap-plying for a part-time job? My best condition is not hard. If the part-time job is hard, exhausted soon and lose my motivation. My second condi-tion is not low part-time price. If the job is not expensive salary, I’m frustrated with this job. I had never worked part time job. I want to work cafeteria. My third condition is not far away from my house. I want to work cafeteria is near my house. That’s very good. My four conditions is human relationship. If the boss is not gentle person, I must be retired the part-time job. By the way, I must part time job. Because I’m don’t have money. I want to get money soon. I must part-time job work soon. Actually, I interviewed part-time job about 10 days ago, but I failed the job. Because of my hair, my hair is too light, and I couldn’t speak healthy. This job is not to appro-priate you, the boss said. I shocked the speech. (179 words)
I hope that I get high salary. We need some money to live, to play and to buy something. So, I want to get much money, we can help poor person. If there are much money, we can help poor person. For example African and restruc-turing... I hope that I have enough rest periods. I work hard. But, if we don’t have enough rest periods, we can’t recover from our fatigue. If we have enough rest periods, Next time is very com-fortable. I hope that there are kindness person. I think that it is important for us to have a little bit of sympathy.
(106 words)
addition, Yuri stayed on the topic faithfully, if we speak favorably, but did not elaborate each factor. In contrast, Mami first listed four factors that seemed important for her, incorporat-ing her own experience (e.g., “I had never worked part time job.”), and then moved on to an episode where she had a job interview. She explains that she could not get the job because
her hair color was too bright. Although there are many errors, Mami’s composition is more
vivid and detailed than Yuri’s monotonous and abstract composition.
Discussion and Conclusion
This study explored the characteristics of the developmental trajectories of L2 writers’
flu-ency when they repeated the same writing procedure every week over one academic year.
As a whole, the students’ initial writing fluency started at around 80 words (in 10 minutes)
and then gradually increased (the slope of its rate of change was +0.617). However, both the
students’ initial writing fluency and rates of change significantly differed from student to
stu-dent. When the students were divided into two groups depending on the rate of change, the only factor that was different between the two groups was the quality of reflective writing.
Case studies further revealed that the quality of reflective writing seemed to have been one contributing factor. One student (Saya), who did not show an improvement in her low writing fluency, wrote a brief negative comment most of the time; another student (Yuri), whose writing fluency was relatively high at first but did not improve, mentioned that she would like to write more fluently, but did not mention concrete strategies to achieve the goal. In contrast, a third student (Mami), who greatly improved her writing fluency, frequently referred to various ideas and strategies to write longer within the time limit. The other differ-ence among the three students was the way they wrote a composition. Saya seemed to pay more attention to accuracy and complexity than to fluency, while Yuri seemed to be weak at developing a story, especially on topics that she found difficult. Mami became competent at quickly brainstorming and elaborating upon ideas to put on paper on any writing topic. In sum, what seems to have contributed to the different rates of change in L2 writing fluency were the abilities to think and devise concrete and effective strategies for achieving a goal and to develop and elaborate a story.
This study is exploratory, so unlike previous studies in developmental psychology, it did not start from explanatory factors behind the difference in rates of change; thus, one of its main purposes was to search for these factors. The results of three case studies suggest that two factors (ability to devise strategies and to develop a story) may influence how L2 writ-ers develop their writing fluency. In fact, Nitta and Baba (2018, in preparation) demonstrates that the use of self-regulatory strategies can affect the way writing proficiency changes. On the other hand, little is known about the ability to develop a story. As Cumming (1989) has shown that writing expertise and L2 proficiency are distinguishable, it is possible that the
ability to narrate a story may be separate from writing proficiency itself, and merits special attention in its own right. Future research may want to include these factors in building models of writing development.
Concurrently with the modeling of longitudinal writing development, it is also important to explore whether teachers can empower and scaffold L2 learners to strengthen and cultivate significant abilities to improve writing proficiency themselves. For example, it may be pos-sible to teach them writing strategies that have proven effective in previous research, but is it possible to teach them to have the motivation to adjust and adapt these strategies for their own purposes in view of various factors such as their writing proficiency and personal-ity? Or is it possible to teach them how to enhance their ability to narrate? It is not easy to answer these questions when in-depth information about learners is lacking. More information about learners, such as their L1 background, learning history, and personality, is necessary to unravel what roles a teacher can play, if any, to facilitate their development in the actual site of learning.
Acknowledgements
This study is supported by Grants-in-Aid for Scientific Research by the Japanese govern-ment (MEXT/JSPS KAKENHI Grant Number 17K02991).
References
Baba, K., & Nitta, R. (2011). Dynamic effects of repeating a timed writing task in two EFL university courses: Multi-element text analysis with Coh-Metrix. In P. M. McCarthy & C. Boonthum (Eds.), Applied Natural Language Processing and content analysis: Identification, investigation, and resolution (pp. 397-411). Hershey, PA: IGI Global.
Baba, K., & Nitta, R. (2014). Phase transitions in the development of writing fluency from a complex dynamic systems perspective. Language Learning, 64(1), 1-35.
Cumming, A. (1989). Writing expertise and second language proficiency. Language Learning, 39, 81-141.
Dörnyei, Z. (2014). Researching complex dynamic systems: ‘Retrodictive qualitative
model-ling’ in the language classroom. Language Teaching, 47, 80-91.
Fogal, G. G. (2017). Tracking microgenetic changes in authorial voice development from a complexity theory perspective. Applied Linguistics, https://doi.org/10.1093/applin/ amx031.
Friginal, E., Li, M., & Weigle, S. C. (2014). Revisiting multiple profiles of learner compositions: A comparison of highly rated NS and NNS essays. Journal of Second Language Writing, 23, 1-16.
Jackson, C. W., Schatschneider, C., & Leacox, L. (2014). Longitudinal analysis of receptive vocabulary growth in young Spanich English-speaking children from migrant families. Lan-guage, Speech, and Hearing Services in Schools, 45, 40-51.
Jarvis, S., Grant, L., Bikowski, D., & Ferris, D. (2003). Exploring multiple profiles of highly rated learner compositions. Journal of Second Language Writing, 12, 377-403.
Kern, R. G., & Schultz, J. M. (1992). The effects of composition instruction on intermediate
level French students’ writing performance: Some preliminary findings. The Modern
Lan-guage Journal, 76(1), 1-13.
Kobayashi, H., & Rinnert, C. (2013). L1/L2/L3 writing development: Longitudinal case study of a Japanese multicompetent writer. Journal of Second Language Writing, 22, 4-33.
Larsen-Freeman, D. (1997). Chaos/complexity science and second language acquisition. Ap-plied Linguistics, 18(2), 141-165.
Lavelli, M., & Fogel, A. (2002). Developmental changes in mother-infant face-to-face commu-nication: Birth to 3 months. Developmental Psychology, 38, 288-305.
Liao, M.-T., & Wong, C.-T. (2010). Effects of dialogue journals on L2 students’ writing fluency,
reflections, anxiety, and motivation. Reflections on English Language Teaching, 9(2), 139-170.
Manchón, R. M. (2016). Quantitative inquiry in L2 writing. In R. M. Manchón & P. K. Matsuda (Eds.), Handbook of second and foreign language writing (pp. 519-541). Boston: De Gruyter. McCarthey, S. J., Guo, Y.-H., & Cummins, S. (2005). Understanding changes in elementary
Mandarin students’ L1 and L2 writing. Journal of Second Language Writing, 14, 71-104.
McKean, C., Mensah, F. K., Eadie, P., Bavin, E. L., Bretherton, L., Cini, E., & Reilly, S. (2015). Le-vers for language growth: Characteristics and predictors of language trajectories between 4 and 7 years. PLOS ONE, 10, e0134251.
Morgan, p. L., Farkas, G., & Wu, Q. (2011). Kindergarten children’s growth trajectories in
reading and mathematics: Who falls increasingly behind? Journal of Learning Disabilities, 44, 472-488.
Nicolás-Conesa, F., Roca de Larios, J., & Coyle, Y. (2014). Development of EFL students’
men-tal models of writing and their effects on performance. Journal of Second Language Writing, 24, 1-19.
Nitta, R., & Baba, K. (2014). Task repetition and L2 writing development: A longitudinal study from a Dynamic Systems Perspective. In H. Byrnes & R. Manchon (Eds.), Task-based Language Learning and Teaching: Insights from Writing (pp. 107-136). Amsterdam: John Benjamins.
Nitta, R., & Baba, K. (2018). Understanding benefits of repetition from a complex dynamic systems perspective: The case of a writing task. In M. Bygate (Ed.), Language learning through repetition (pp. 279-309). Amsterdam: John Benjamins.
The Routledge handbook of second language acquisition (pp. 319-334). London: Routledge. Sansavini, A., Pentimonti, J., Justice, L., Guarini, A., Savini, S., Alessandroni, R., & Faldella, G.
(2014). Language, motor and cognitive development of extremely preterm children: Mod-eling individual growth trajectories over the first three years of life. Journal of Communica-tion and Disorders, 49, 55-68.
Singer, J. D., & Willett, J. B. (2003). Applied longitudinal data analysis: Modeling change and event occurrence. Oxford: Oxford University Press.
Song, S., Su, M., Kang, C., Liu, H., Zhang, Y., McBride-Chang, C., Tardif, T., Li, H., Liang, W.,
Zhang, Z., & Shu, H. (2015). Tracing children’s vocabulary development from preschool
through the school-age years: An 8-year longitudinal study. Developmental Science, 18(1), 119-131.
Spoelman, M., & Verspoor, M. (2010). Dynamic patterns in development of accuracy and complexity: A longitudinal case study in the acquisition of Finnish. Applied Linguistics, 31 (4), 532-553.
Tek, S., Mesite, L., Fein, D., & Neigles, L. (2014). Longitudinal analyses of expressive language development reveal two distinct language profiles among young children with autism spec-trum disorders. Journal of Autism and Developmental Disorders, 44, 75-89.
Verspoor, M., & Smiskova, H. (2012). Foreign language writing development from a dynamic usage based perspective. In R. M. Manchon (Ed.), L2 writing development: Multiple per-spectives (pp. 17-46). Boston: De Gruyter Mouton.
Verspoor, M., Lowie, W., & van Dijk, M. (2008). Variability in second language development from a dynamic systems perspective. The Modern Language Journal, 92(2), 214-231. Vyatkina, N. (2012). The development of second language writing complexity in groups and
individuals: A longitudinal learner corpus study. The Modern Language Journal, 96, 576-598. Weissberg, R. (1998). Acquiring English syntax through journal writing. College ESL, 8(1),