ANALYSIS ON HOUSEHOLD WATER INSECURITY,
HEALTH, AND THE FEASIBILITY OF ALTERNATIVE
TECHNIQUES FOR SUSTAINABLE WATER USE IN
DEVELOPING COUNTRY SETTINGS
(開発後進国における世帯レベルの水不安定性、
健康及び持続的水利用代替技術の実現性の解析)
山梨大学大学院
医学工学総合教育部
博士課程学位論文
2013 年 9 月
SALINA SHRESTHA
ANALYSIS ON HOUSEHOLD WATER INSECURITY,
HEALTH AND THE FEASIBILITY OF ALTERNATIVE
TECHNIQUES FOR SUSTAINABLE WATER USE IN
DEVELOPING COUNTRY SETTINGS
September 2013
SALINA SHRESTHA
Analysis on household water insecurity, health and the
feasibility of alternative techniques for sustainable water use
in developing country settings
A dissertation submitted in partial fulfillment of the requirements for the degree of Doctor of philosophy in Engineering
Special Doctoral Course on Integrated River Basin Management
Interdisciplinary Graduate School of Medicine and Engineering
University of Yamanashi, Japan
September 2013
Salina Shrestha
i
Abstract
Water insecurity is considered as one of the global issue. The rapid population growth and urbanization has threatened the water security worldwide especially in developing countries of Asia and Pacific. As a result, it is expected to shift about 55% of the world’s population towards water stress or severe water scarcity over the next generation. The overall water insecurity further results the household water insecurity affecting health and daily life of people. Impact study of household water insecurity has become an urgent need due to increase in its triggering factors. There were several previous studies conducted on the impact of water quality on health. Our study further considered the impact assessment of water insecurity in much wider scale especially in terms of water quantity. We have included the impact study of water quantity on diarrhoea, water quality and mental stress among women. In addition, the study identified the knowledge, usage and motivating factors to enhance the practice of potential alternatives of water use such as rain water collection, grey water use and ground water recharge which will help to reduce the problem of water insecurity.
Questionnaire survey and laboratory analysis of water sample were conducted for data collection. Descriptive statistics, parametric and non parametric statistical tests along with regression analysis were used in the study.
The overall study reflected the level of impact of water insecurity in several aspects. The assessment of relationship between water use and diarrhoea demonstrates that the households using combination of improved water source and alternative water sources are more vulnerable to diarrhoea. In addition, optimal access to water (100 l/c/d) was required for domestic purpose to acquire a health benefit regardless of any source used. Socioeconomic disparities should be carefully considered during water related intervention programme as the households with lower socioeconomic status are more susceptible to diarrhoea.
The intermittent supply and less availability of water make people to store water for longer duration. The deterioration of water quality at source due to intermittent supply and at point of use during storage was observed. The long term storage with lack of proper hygiene due to insufficient water availability favors growth of pathogens in the
ii
stored water that will further increase the risk of water borne disease.
Along with the impact on physical health, the study further explained the difficulties caused by the water insecurity in social life of women who are responsible in handling the water in the household. The social problem resulted from water insecurity increases the mental stress among women.
The study regarding the community opinion of alternatives of water use showed that knowledge and usage of rain water in the valley was higher compared to grey water use and ground water recharging. Rain water and grey water were mostly preferred for non consumptive purpose. The awareness programme, technical support, subsidies and strict rules and regulations are important to promote the use of these alternatives among the community people.
The study result will help to understand the impact of water insecurity in broader aspect which, can be generalized in context of urbanizing area of developing countries. The study will be very helpful in planning the water related intervention programme.
iii
Acknowledgement
I would like to express my thanks and gratitude to my supervisor Assoc. Prof. Kei Nishida for his guidance to complete my thesis successfully.
I would like to express my sincere gratitude to Dr. Yoko Aihara and Dr. Naoki Kondo for their continuous guidance and suggestions.
I would also like to thank Prof. Yasushi Sakamoto, Prof. Futaba Kazama, Prof. Hiroshi Ishidaira, Assistant Prof. Eiji Haramoto, Prof. Zentaro Yamagata and Dr. Kanako Yoden for their support to conduct and improve the quality of thesis.
My sincere thanks expressed to Global COE program of University of Yamanashi and Ministry of Education, culture, Sports, science and Technology (MEXT) for awarding me Monbukagakusyo: MEXT scholarship to continue my PhD course.
I am very grateful to all the professors, staffs and collegues of GCOE program for their support. I am thankful to Dr. Sujata Manandhar, Dr. Vishnu Prasad Pandey, Mr. Sujan Shrestha, Dr. Sadhana Shrestha, Dr. Yureana Wijayenti, Dr. Do Thu Nga and all the lab members for their academic and other necessary supports required during my study. I would further like to thank Dr. Rabin Malla (CREEW), Ms. Bijaya Adhikari, Ms. Ramita Shrestha and all the friends who helped me to conduct the field survey during the study.
Again sincere thanks goes to by husband Mr. Ramit Dev Shrestha, my mother Ms. Lalita Devi Shrestha, my sisters Ms. Aliza Shrestha Dhungana, Dr. Shelly Shrestha and my brother in law Mr. Devesh Dhungana for their continuous encouragement and support during my study period.
iv
Abbreviation
ADB Asian Development BankCBS Central Bureau of Statistics CI Confidence Interval
cu.m Cubic meter
DFID Department for International Development ENPHO Environment and Public Health organization
ICIMOD International Centre for Integrated Mountain Development IRIN Integrated Regional Information Networks
JICA Japan International Cooperation Agency KUKL Kathmandu Upatyaka Khanepani Limited
KVWSMB Kathmandu Valley Water Supply Management Board l/c/d Liter/capita/day
MDG Millennium Development Goals mg/l Milligram/liter
MLD Million Litres per Day
MoHP Ministry of Health and Population MPN Most Probable Number
OR Odds ratio S.E. Standard error sq.m Square meter
UNESCAP United Nations Economic and Social Commission for Asia and the Pacific UNICEF United Nations Children's Fund
VDC Village Development Committee WHO World Health Organization
v
Table of content
Abstract i Acknowledgements iii Abbreviation iv Table of Contents vList of Figures viii
List of Tables x
Chapter 1 Introduction
1.1 Background 2
1.2 Water insecurity and its impact 3
1.2.1 Water quantity and diarrhoea 4
1.2.2 Water quantity and quality 5
1.2.3Water quantity and mental stress 6
1.3 Social feasibility of alternative water uses 6
1.4 Motivation 8
1.4.1 Few studies on impact of water insecurity 8 1.4.2 Suitability of alternative water use in the study area and need of
understanding of community opinion
9
1.5 Objectives 11
1.5.1 Thesis outline 11
1.5.2 Research framework 13
Chapter 2 Description of methodology
2.1 Description of study area 16
2.1.1 Physical setting and topography of study area 16
2.1.2 Population of study area 16
2.1.3 Water supply situation 16
2.2 Water quantity and diarrhoea 17
2.2.1 Data collection 17
2.2.2 Measurements 18
2.2.3 Statistical analysis 20
vi
2.3 Water quantity and quality 20
2.3.1 Data collection 20
2.3.2 Measurements 21
2.3.3 Analysis 21
2.3.3.1 Water quality analysis 21
2.3.3.2 Statistical analysis 22
2.4 Water quantity and mental stress 22
2.4.1 Data collection 22
2.4.3 Measurements 23
2.4.3 Statistical analysis 24
2.4.4 Ethics 25
2.5 Social feasibility of alternative water uses 25
2.5.1 Data collection 25
2.5.2 Measurements 25
2.5.3 Statistical analysis 25
Chapter 3 Water quantity and diarrhoea
3.1 Proportion of diarrhoea and characteristics of population 27
3.2 Relationship of diarrhoea and water use 30
3.3 Relationship of improved water use and diarrhoea 34
3.4 Strengths and limitations of the study 34
3.5 Summary 35
Chapter 4 Water quantity and quality
4.1 Types of water used for different purposes 37
4.2 General water quality 39
4.3 Water supply interval and water quality at the source 39
4.4 Water quality at the source and point of use 41
4.5 Water availability and sanitary behavior 42
4.6 Strengths and limitations of the study 42
4.7 Summary 43
Chapter 5 Water quantity and mental stress
5.1 Characteristics of participant 45
5.2 Impact of water quantity on water related social problem and mental stress 45
vii
5.4 Summary 50
Chapter 6 Social feasibility of alternative water uses
6.1 Characteristics of households with respect to alternative water use 52 6.2 Comparison of different alternatives of water use 59
6.3 Strengths and limitations of the study 60
6.7 Summary 61
Chapter 7 Summary of research
7.1 Conclusion 63
7.2 Contributions of the study 64
References 65
viii
List of Figures
1.1 Concept of water security 3
1.2 The F-diagram 4
1.3 Flow chart of research framework of the study 13
2.1 Map of Kathmandu valley 16
3.1 Sub-framework of analysing relationship of water use and diarrhoea
27
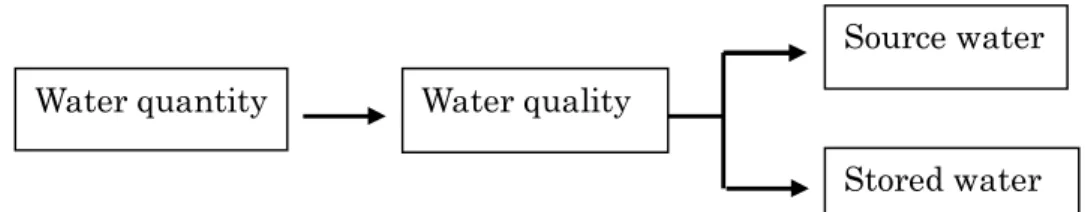
4.1 Sub-framework of assessment of impact of water quantity on water quality
37
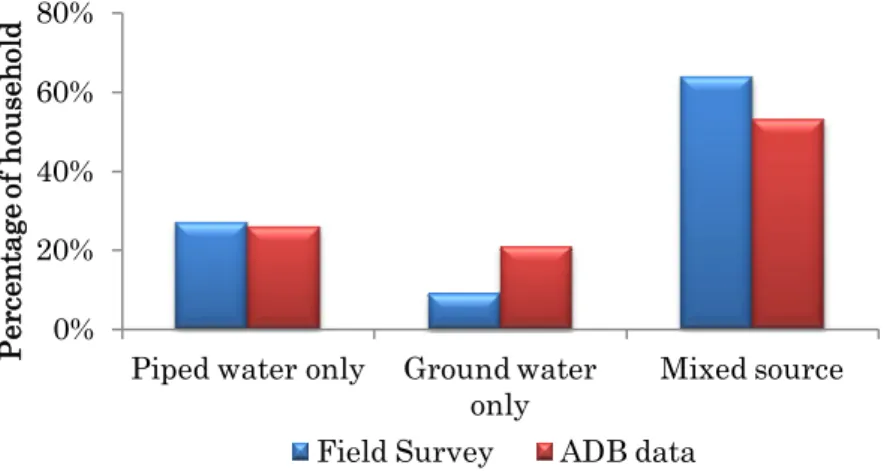
4.2 Proportion of households by types of water sources used 38 4.3 Proportion of households using piped water for different
purposes
38
4.4 Proportion of households using groundwater for different purposes
38
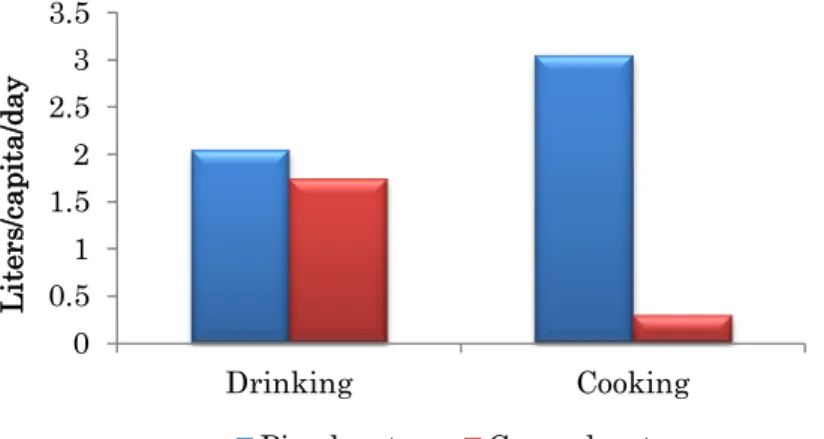
4.5 Amount of water consumed for different purposes 39 5.1 Sub-framework of assessing relationship of water quantity on
social dimension and resulting stress level
44
6.1 Sub-framework of social feasibility study of alternative water use
52
6.2 Proportion of households with knowledge on rain water 53
6.3 Proportion of households using rain water 53
6.4 Proportion of household with perception of rain water quality 54 6.5 Proportion of household with purpose for using rain water 54 6.6 Proportion of households describing reasons for not using rain
water
54
6.7 Proportion of households with motivating factor for using rain water
54
6.8 Proportion of households with knowledge on grey water 55
6.9 Proportion of households using grey water 55
6.10 Proportion of household with perception of grey water quality 56 6.11 Proportion of household with purpose for using grey water 56 6.12 Proportion of households describing reasons for not using grey
water
56
ix
water
6.14 Proportion of households with knowledge on ground water recharge
57
6.15 Proportion of households using ground water recharge 57 6.16 Proportion of households by types of ground water recharge
practice
57
6.17 Knowledge level of different alternatives of water use 60
x
List of Tables
3.1 Household socio-economic characteristics, types of water sources, access to improved water, sanitary behaviours and proportion of contracting diarrhoea among family members in the previous month: the 2009 baseline survey of the Kathmandu Valley Water Distribution, Sewerage and Urban Development Project, Kathmandu Valley, Nepal.
28
3.2 Odds ratios (95% confidence intervals) for having diarrhoea among family members by types of water sources and total quantity of water consumed: results of logistic analysis, the 2009 baseline survey of the Kathmandu Valley Water Distribution, Sewerage and Urban Development Project, Kathmandu Valley, Nepal.
31
3.3 Odds ratios (95% CIs) of having diarrhoea among family members by access to a quantity of improved water: results of logistic analysis, the 2009 baseline survey of the Kathmandu Valley Water Distribution, Sewerage and Urban Development Project, Kathmandu Valley, Nepal.
33
4.1 Relationship between piped water supply interval and water quality at the source.
40
4.2 Relationship between water quality at piped source and storage. 41 4.3 Relationship between storage water quality and storage
behaviour.
42
4.4 Correlation between cleaning interval and water availability per capita.
43
5.1 Characteristics of participants 46
5.2 Relationship of water insecurity score and water quantity and sociodemographic structure
48
5.3 Relationship of stress level with water insecurity score and deterioration of quality of life (QOL), self rated health status, social support and sociodemographic structure.
1
Chapter 1
Introduction
2
1.1 Background
Water is identified as one of the most important natural resources because it is viewed as a key to prosperity, wealth and human health (Arbués et.al., 2003; WHO, 2008). Consequently water security is considered as of great significance.
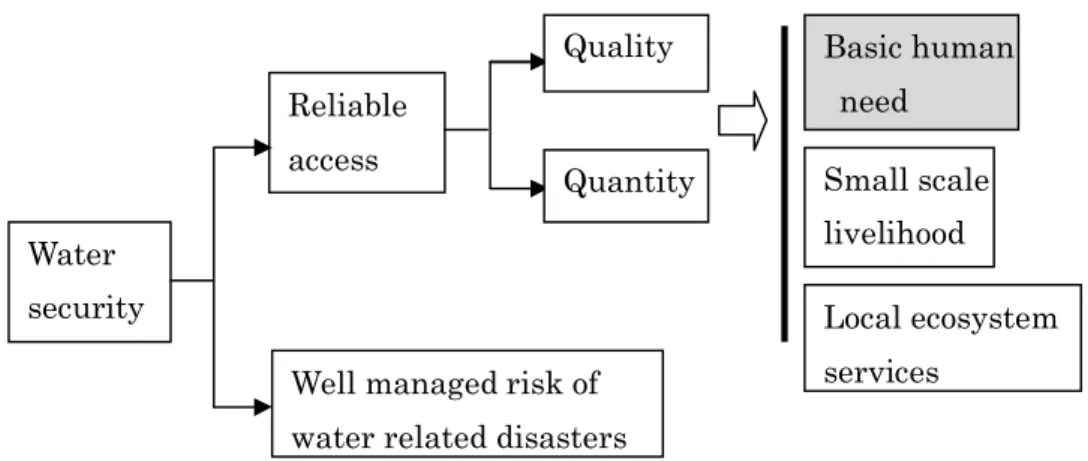
Water Aid defines water security as ‘reliable access to water of sufficient quantity and quality for basic human needs, small-scale ‘livelihoods and local ecosystem services, coupled ‘with a well managed risk of water-related disasters’ (Water Aid, 2012).
It is documented that less than 10 countries have about 60% of globally accessible water, suggesting inequitable distribution of water globally and nationally (Swaminatham, 2001). Natural factors as well as human actions and inactions are directly responsible for water insecurity problems. Population growth, urbanization, and climate change threaten water security in countries worldwide, (Kjellstrom and Mercado 2008; Kundzewicz et. al., 2007; Vairavamoorthy 2008) expected to shift about 55% of the world’s population towards water stress over the next generation (Rockström, 2001; Ayibotele, 1992). Besides, water quality is also impacted by urbanization. It has resulted in the pollution of water bodies (UNESCAP, 2011). The impact of water insecurity in terms of quality and quantity is more serious in urbanizing area of Asia and Pacific.
The overall water insecurity ultimately leads to the household water insecurity affecting the basic human need. Water required for domestic purpose to fulfil the basic human need such as consumption, bathing and food preparation' is prioritized most as it is directly related to human health (DFID, 1999; Water Aid, 2012). It is one of the fundamental requirements for human life without which life cannot be sustained beyond few days. Therefore, household water security is an important issue (Howard and Bartram, 2003).
In order to address the problem of household water insecurity Millennium Development Goal (MDG) 7 target “to halve the proportion of people without access to safe drinking water by the year 2015” (WHO/UNICEF, 2000). Despite of this, the problem of household water insecurity is prevalent in many areas. Over 780 million people are still without access to improved sources of drinking water especially in the Sub-Saharan Africa and least developed countries (UNICEF/WHO, 2012). The increasing problem of household water insecurity might result impacts on several aspects. We have discussed
3
importance of impact study in section 1.2. In addition, socially and economically viable options should be explored and promoted to reduce water insecurity problems. The need of understanding community opinion for successful implementation of potential alternatives is discussed in section 1.3.
Fig 1.1: Concept of water security (Water Aid, 2012) 1.2 Water insecurity and its impacts
Household water insecurity resulted from the lack of good quality water and sufficient quantity of water for domestic purpose. Water insecurity might have several impacts on health. There were several studies carried out that demonstrated the impact of water quality on health (Bessong et. al., 2009; Moe et. al., 1991; Yassin et. al., 2006). Regarding water quality, safe drinking-water is required for all domestic purposes, including drinking, food preparation and personal hygiene for better health. Lack of good quality water increase the risk of water borne disease (WHO, 2008) caused by the ingestion of pathogens, and these usually originate from the faeces of infected humans and animals. The pathogens in contaminated water include various types of bacteria, viruses, protozoan parasites, and other organisms responsible for causing infection in human (Ball, 2006).
But there were comparatively less studies on the evaluation of impact of water quantity. Therefore, our major interest in the research is mostly focused on impact of water insecurity in terms of water quantity. The need of impact study is discussed from section 1.2.2 to section 1.2.3.
Reliable access
Quantity
Quality Basic human need
Small scale livelihood Local ecosystem services
Well managed risk of water related disasters Water
4
1.2.1 Water quantity and diarrhoea
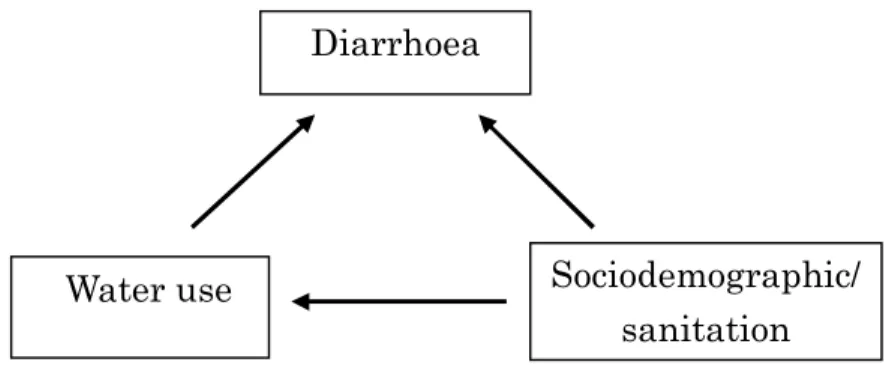
Fig 1.2: The F-diagram (Wagner and Lanoix, 1958)
The transmission path of faecal pathogens from environment to a new host that is responsible for diarrhoeal disease was expressed in given ‘F-diagram’ (Fig 1.2) suggested by Wagner & Lanoix (Wagner and Lanoix, 1958). The pathogens might get onto fingers, into food or fluids and some of these may reach a new host. Flies landing on excreta can carry pathogens to foods or surfaces that are used for food preparation or eating. Human or animal feet that tread in faecal material deposited in the open bring pathogens into the domestic environment, and children playing with, or eating, faecally contaminated earth can ingest pathogens.
All of the transmission routes shown in the F-diagram (Fig 1.2) can be blocked by changes in domestic hygiene practice. The importance of domestic hygiene practice to reduce the diarrhoeal disease is illustrated in several literatures (Cairncross, 1990; Langford, 2009; Oyemade, 1998). Improved infrastructure along with the accessible, plentiful supplies of water facilitate and encourage better hygiene in general, and more
5
hand-washing in particular (Cairncross, 1997; Esrey et. al., 1985; Esrey, 1991). A study conducted by Witch also emphasized that lack of sufficient amount of water for domestic purpose compels people to adjust their daily life with limited amount of water. In long term, it changes the behaviour pattern of people for using less water than required. It ultimately establishes the poor hygiene practice among them (Witch, 2006).
Although these above mentioned studies concluded the relationship of hygiene with diarrhoea and with available water quantity, there is no detail study conducted on the direct relationship between amount of actual water quantity required and diarrhoeal disease. However the understanding of relationship is important in the current context in the areas with water shortage problem. This study has included the analysis to find the relationship between water quantity and diarrhoea.
1.2.2 Water quantity and quality
In tropical developing countries, in addition to the unsafe water collected for domestic purposes, the situation is intricate by the need for household storage of water due to the infrequent availability. The intermittent and infrequent supply results need to store water for drinking, food preparation, washing and bathing (Brick et. al., 2004). A significant proportion of the world’s population collect, transport and store water for several domestic purpose (Kindhauser, 2003).
These problems are more prevalent in the urban areas of developing countries. Lack of sufficient water affects the hygiene practice within the household resulting the contaminated household environment. It might further increase the risk of water contamination within the household. Additionally, post-source contamination has been associated with increased rates of diarrhoeal disease (Gundry et. al., 2003; Musa et. al., 1999). Moreover, along with the lack of continuity in the supply, breaks in the pipes lines due to the lack of proper maintenance are a common problem in these areas. It might increase the risk of in pipe contamination due to the absorption of contaminants (Lee and Schwab, 2005). Consequently, it is important to understand impact of available water quantity on water quality. Although there were studies conducted to analyse the water quality from different sources (Lee and Schwab, 2005) but very limited studies conducted to evaluate the relationship. Our study evaluates the relationship of water quantity at source with response to continuity of the supply and the change in water quality from the source and point of use.
6
1.2.3 Water quantity and mental stress
Women are mainly responsible for handling water. Therefore, water insecurity has primary affect on women (Annabel, 1993; Buckingham-Hatfield 2000; Sandys 2005). According to World Bank and DFID (Department of International Development) consultative qualitative poverty assessment, by women and girls disclosed the water related issue to be most vital to be addressed in both rural and urban communities (Cleaver, 1993; DFID, 1999).
Previous studies revealed that water scarcity has tremendous impact on women and the drudgery of water collection is hindering the girl’s education, the time availability for productive work and coping strategies at the household and community level (Coates, 1999; Wijk-Sijbesma, 1998). Less time availability for education and school drop outs are also common in many developing countries.
Studies conducted in Mexican community (Ennis-McMillan, 2001), Bolivian squatter community (Wutich and Ragsdale, 2008) and rural Ethiopia (Stevenson et. al., 2012) also demonstrated the distress and suffering caused by water insecurity. However, there is no study conducted that quantified the exact amount of water consumed and its impact on social problem and mental stress among women. In our study, we evaluated the relationship of water related social problem (using Likert scale questionnaire) with WHO guideline values of drinking water quantity (WHO, 2008) and further with mental stress among women. Women are active agents of change and the dynamic promoters of social transformations that can alter the life of all members in the society, influencing the development, therefore the health and efficiency of women is very important (Sen, 1999). Our study result will be helpful in highlighting the importance of gender mainstreaming for the water related policy planning and implementation.
1.3 Social feasibility of alternative water uses
Rapid urbanization, increasing pressure of population and technical progress triggering the imbalance between water supply and demand provide evidence of urgent need of management of water resource for authorities worldwide (Kjellstrom and Mercado, 2008; Kundzewicz et al., 2007; Vairavamoorthy et al., 2008). City governments, who often lack adequate financial as well as human resources to handle the problems result the water crisis to be deteriorating day by day (Seidl et. al., 2010). In such cases, some
7
alternatives has been proposed in literatures, such as rain water harvesting couples with ground water recharge and grey water recycling can solve the problem of water insecurity worldwide in context of limited fresh water availability (Morel & Diener, 2006; Seidl et. al., 2010). These are especially recognized as suitable alternatives and proposed technology in most of the developing countries for sustainable water management. The brief description of these alternatives is described below:
Rain water
Rain water harvesting primarily consists of the collection, storage and subsequent use of captured rain water as either the principal or supplementary source of water (Fewkes, 2006). It is considered as one of the potential option in many areas of the world with sufficient rainfall where conventional water supply systems are not available or have failed to meet the needs and expectations of the people (Li et. al., 2010). It is simple and technically feasible option of water collection, which has been used since antiquity (Rana). Several studies also revealed about the economic feasibility of rain water harvesting technique (Sturm et. al., 2009).
Ground water recharge
Ground water is a major source of drinking water supply for 2 billion people, approximately one third of global population (Morris et al., 2003). Ground water is cheap and easily accessible source. So the extraction often exceeds its natural recharge. Consequently, the ground water depletion is one of the major issues of the world resulting the drying up of wells and tube wells, land subsidence and salinity intrusion (Kendy et. al., 2003; Konikow and Kendy, 2005; Reddy, 2005; Shah et. al., 2000). Therefore artificial ground water recharge is proposed which supplements the natural process of recharging and is considered one of the suitable option for augmentation of groundwater resources in the current context (Sakthivadivel, 2002). It is a planned, human activity of augmenting the amount of groundwater available through works designed to increase the natural replenishment or percolation of surface waters into the groundwater aquifers, resulting in a corresponding increase in the amount of groundwater available for abstraction (UNEP, 2008). During rainy season the excessive rain water after use and storage can be used to recharge and store in ground water that can be used for dry season (Joshi and Shrestha, 2008). The additional benefits of artificial ground water recharge are reduce loss of stored water by evaporation, reduce expenses and space occupied to construct large storage facilities, prevent displacement of population residing in the particular area (Yadav et al., 2013).
8
Grey water
Apart from toilet wastewater, the term grey water is used when designating all the wastewater produced in a household. Grey water is wastewater from baths, showers, hand basins, washing machines and dishwashers, laundries and kitchen sinks. Two third of total domestic waste water (i.e. approx 65% of total waste water) can be treated and reused as grey water. Grey water has nevertheless, a great potential to reduce the water stress currently faced by regions in the world and is regarded as a valuable resource and not as a waste. Grey water reuse is an effective measure for saving water on the domestic level (Morel & Diener, 2006). Several studied were carried out to assess the economic benefits of using grey water as well. These studies revealed the reduction in water bill (Redwood, 2004) and return on investment of a household grey water management scheme within short period of time and regarded as economically attractive (Gross et. al., 2006).
Although literatures show the above mentioned alternatives as potential options for sustainable water management in context of developing countries, it would be effective only if the understanding and participation of public is common. There are very limited studies carried out to understand the public view and usage. Therefore, our study evaluates the practicability of a given alternatives of water use for sustainable water management among the community by understanding the degree of knowledge level, usage and motivating factors for the utilizing the proposed techniques.
1.4 Motivation
The motivation factors to conduct the study in the given site are explained below in section 1.4.1 and 1.4.2.
1.4.1 Few studies on impacts of water insecurity
Growing population and rapid urbanization have expanded demand and competition for water resources resulting water insecurity, one of the major issue in the Kathmandu valley. Water insecurity influences the personal and household hygiene might increase health risk such as risk of diarrhoea. Diarrhoeal disease is one of the top ten disease in context of Nepal and there is a risk of outbreak of disease every year in the valley (MoHP, 2010). Although there are several studies conducted in the Kathmandu valley regarding the situation of water quality, diarrhoeal disease prevalence (Ono et al., 2001;
9
Pradhan et. al., 2005) revealing the poor water quality and risk of outbreak of diarrhoea. There is no detail study carried out to find the water use in terms of source and quantity and its influence on water borne disease such as diarrhoea in the valley. Our study will evaluate the relationship of water use with risk of diarrhoea.
Besides, Kathmandu valley people have to store water for several days due to the intermittent supply and less availability. Although there were several studies conducted on water quality from source, the limited studies on evaluation of water quality at storage point and the assessment of impact of water scarcity on water quality motivated us to fulfil this study gap.
Moreover, water insecurity makes people to spend several hours even to collect a single bucket of water. In the Kathmandu valley women are mostly responsible for water collection. So they might have been affected more (DEMOTIX, 2009; IRIN, 2009). However, there is no study carried out in detail to quantify the social problem with regard to the water quantity and impact of these problems on the mental stress of women. Our study will further assess the relationship of water quantity with social problem and mental stress among the women.
The increasing problem of water insecurity in the valley might further worsen the resulting impact. Therefore, there is an urgent need to understand the degree of impact of water insecurity in the Kathmandu valley. This motivates us to conduct the impact study in the valley.
1.4.2 Suitability of alternative water use in the study area and need of understanding of community opinion
The available natural water sources are limited to meet the water demand of increasing population resulting the problem of water insecurity (Pandey, 2010). The literatures illustrates potential alternatives for sustainable water use in context of Kathmandu valley for example, rain water harvesting, ground water recharge and grey water recycling (R. R. Shrestha, 2009; Thanju, 2010; Tuladhar et. al., 2008).
During rainy season (June to September), Kathmandu valley has immense rain fall of 1900 mm in average: more than twice the world average. Approximately 1.2 billion cu.m/year or 3353 million litres per day (MLD) of rain water falls in the 640 sq.km of
10
valley. This is about 12 times the present water demand that can be captured and used for the domestic purpose. About 80% of total rainfall on a building can be collected easily, thus in theory a building with a roof area of 100 sq.m could collect up to 200 cu.m of rain water per year, adequate for a family of five with a water demand of about 170 cu.m per year (R. R. Shrestha, 2009).
Rain water harvesting and ground water recharge is old technology practiced from earlier days and Rajkulos are means to collect rain water and recharge ground water. This practice of collecting rain water, after the introduction of municipal water supply system in the valley, was discontinued. As a result, all such ponds are now in very decrepit conditions and so the traditional wells. However, recharge to shallow groundwater aquifer through soak pits or recharge pits or directly through wells from rain water harvesting artificially is relatively a new concept of utilizing rain water in Kathmandu (Water Aid, 2011).
Ground water is one of the major source of domestic water supply in the valley and the application of artificial recharge is an urgent need in the current situation of ground water depletion in the valley (Pandey, 2010). A recent study indicates that the valley’s sub-surface geology is favorable for recharging of groundwater (Water Aid, 2011). If just 10% of the Kathmandu valley area is to be used for rain water harvesting, 128 million cu.m/year could be recharged if suitable recharge techniques and locations identified for successful implementation. Despite of favorable geological formations, natural infiltration is generally ineffective due to the sealing of the ground’s surface due to urbanization (R. R. Shrestha, 2009). This also reveals the artificial ground water recharge as an urgent need in the Kathmandu valley.
Similarly, grey water recycling is another alternatives that can be applied in the valley. 80 litre of waste water/person/day is produced in the Kathmandu valley mostly from domestic origin (Shrestha and Maharjan, 2009). The treated water can be used for non consumptive domestic purpose. Currently, grey water use method such as constructed wet land is practiced in few places in institutional as well as household level (Tuladhar et. al., 2008).
The above mentioned literatures demonstrate the suitability of these alternatives in the Kathmandu valley settings that might help to reduce the problem of water insecurity. These techniques would be successful only if community people are aware and practice
11
them in the massive scale. However, the practice of these techniques was very limited in the valley compared to its need. In addition, there is no study carried out including the public opinion along with the understanding of reasons of inadequate use of these alternatives. These study gap along with the suitability of the alternatives in the study area motivate us to conduct the study in the community level to establish the clear picture of the knowledge level, practice and motivating factors among them.
1.5 Objectives
Overall objective
To assess the impact of household water insecurity on health in the Kathmandu valley, Nepal.
Specific objective
1. To analyze the relationship between water quantity and diarrhoea (Chapter3). 2. To assess the impact of water quantity on water quality (Chapter 4).
3. To assess the impact of water quantity on water related social problem and mental stress (Chapter 5).
4. To identify the social feasibility of alternative water uses (Chapter 6).
1.5.1 Thesis Outline
The thesis consists of seven chapters. The brief description of each chapter is as follows:
Chapter 1: Introduction
The chapter consist of a background of the entire study including the introduction and global context of water insecurity; ongoing research on physical health, water quality, possible impact on social aspect and potential alternatives for sustainable water management. In addition, it encompass the study gap, motivation to conduct research in the study area, stressed the need of detail impact study of water insecurity to understand the situation in broader aspect and the social feasibility study of the alternatives of water use among the community people. It further includes objectives of the study, thesis outline with brief description of individual chapters and research framework.
12
Chapter 2: Methodology
This chapter includes description of study area and detail methodology adopted in the study.
Chapter 3: Water quantity and diarrhoea
This chapter describes the water source and quantity used by the people residing in the Kathmandu valley and its impact on diarrhoea.
Chapter 4: Water quantity and quality
This chapter includes the water quality analysis along with change in water quality from source to point of use. It further describes the impact of water quantity on water quality.
Chapter 5: Water quantity and mental stress
This chapter describes the relationship of water consumption with water related social problem and mental stress among women.
Chapter 6: Social feasibility of alternative water uses
This chapter includes the opinion of community considering knowledge, practice and motivating factor regarding the proposed alternatives of water use for sustainable water management.
Chapter 7: Summary of research
This chapter includes the conclusion of research and contribution of the study.
13
1.5.2 Research framework
Fig 1.3 Flow chart of research framework of the study
Household Water Insecurity
Mental stress Water
Quantity Water Quality
Alternatives of water use
Practice Motivation Knowledge Diarrhoea
Impact
assessment
Social
feasibility study
Water related social problem Hygiene Obj 1 Obj 3 Obj 2 Obj 4Relationship mentioned in previous study Relationship analysed in our study
14
The flow chart of research framework is presented in the figure 1.3. The framework comprises two different aspects i.e. impact assessment and social feasibility study of alternative water use. Impact assessment includes the analysis of association of water quantity with diarrhoea; water quantity with hygiene and water quality and water quantity with water related social problem and mental stress among women. The social feasibility study of alternative water use comprise assessment of knowledge, practice and motivation in the community.
15
Chapter 2
Methodology
16
2.1 Description of study area
2.1.1 Physical setting and topography of study area
Three districts make up the Kathmandu Valley—Kathmandu, Bhaktapur and Lalitpur. The Kathmandu district comprises two municipalities and 57 Village Development Committees (VDCs), the Bhaktapur district comprises two municipalities and 16 VDCs and the Lalitpur district comprises one municipality and 41 VDCs. Municipalities and VDCs are further divided into wards. The watershed has a total surface area of 665 km2 within 27°32′13″ to 27°49′10″ N latitude and 85°11′31″ to 85°31′38″ E longitude. The central part of the valley is 1,300–1,400 m above sea level (m a.sl) with a gentle, flat landscape, and is surrounded by mountains with altitudes exceeding 2,000 m a.s.l (JICA, 1990).
Fig 2.1: Map of Kathmandu valley 2.1.2 Population of study area
Kathmandu Valley has been a center of administration, economy, education and politics since long ago. After political liberalization in Nepal in 1952, Kathmandu valley has became one of the major urban center of Nepal. When urban infrastructures (like roads and water supply system) started to develop rapidly after early seventies, the valley has become rapidly urbanizing area. Taking an advantage of weak planning and/or poor implementation of planning, urban areas are expanding in a very haphazard and unplanned way, following people-land-building-infrastructure type of housing process (ICIMOD, 2007). Population in the Kathmandu valley increased from 1.6 million in 2001 to 2 million in 2011 (~554364 households). Although Kathmandu valley covers
17
only 0.47% of the total area, it has highest population density in Nepal (CBS, 2011). The urban population growth rate in the valley is approximately 4%. The rapid population growth in the valley is resulted by concentration of economic, social and administrative services in the valley leads to the migration of people from remote area in search of better opportunities.
2.1.3 Water supply situation
In the Kathmandu valley, the total demand of water is 320 MLD but the supply is only 75.72 MLD in dry season, 105.17 MLD in wet season and average supply is 95.36 MLD (KUKL, 2010/1011). Majority of people in the Kathmandu valley residents prefers piped water supply for their domestic purpose and 79% of them have access to the water supplied by KUKL. But the quantity supplied is not sufficient to meet the demand. Those who don’t have access to the KUKL supply or having insufficient and intermittent supply used several other alternative sources. Such as, dug well, tubewell, spring, stonespout, river, bottled water.
Surface water sources : At present, there are 30 surface sources being tapped for water supply in the valley. There is considerable seasonal fluctuation in water discharge. Most water sources have a reduced flow in the dry season by 30 to 40% with some by as much as 70%. Although the yield increases during wet season, available water is not sufficient to meet the demand (ADB, 2010).
Ground water source: Ground water extraction in Kathmandu valley is increasing due to increase in population growth and urbanization. As a result, extraction has exceeded the recharge level and the reduced the water availability per capita (Pandey, 2010). The valley residents are facing severe water shortage problem in many areas.
2.2 Water quantity and diarrhoea 2.2.1 Data collection
Data were extracted from the baseline survey of the Kathmandu Valley Water Distribution, Sewerage and Urban Development Project; the survey was conducted by Asian Development Bank (ABD) between August and September 2009. We used a multistage cluster sampling method. Data collection involved two stages. In the first stage, 35 wards from the jurisdiction of the five municipalities and 15 VDCs were
18
randomly selected. In the second stage, 84 geographical points were randomly selected from these municipalities and VDCs. Interviewers then visited the selected geographical points and interviewed family members residing in households located closest to those points. In all, 2,282 households were included in this study. One person per household was interviewed using a constructed questionnaire {Appendix 1 (A)}. No specific exclusion criteria were employed. Any type of household was selected, including both rented and owned residences. We excluded households in which, despite multiple visits, the members could not be contacted by the interviewers.
To ensure external validity, a reliable resident registry database should ideally be employed for survey sampling. However, in the ADB survey, the official resident registry database was not used to include members belonging to discriminated populations; such individuals are usually not legally registered. Approximately 20% of the households refused to participate in this survey. No data were available for comparing the characteristics of participants and non-participants.
2.2.2 Measurements
Diarrhoea
In the present survey, diarrhoea was determined by asking the following question: ‘Did you or anyone in your family get sick last month? If yes, what was the illness?’ The answer to this question included the following 10 common ailments: fever, common cold, diarrhoeal disease, dengue fever, hepatitis, typhoid, malaria, skin disease, infected wounds and other illnesses. Households that selected the response for diarrhoeal disease were categorised as having diarrhoea.
Water use
Variables related to water use included the type of water source, total quantity of water consumed and total quantity of improved (KUKL-provided) water consumed in a household. The type of water source was identified by asking the following question: ‘What water sources are currently used by your family?’ Respondents were allowed to select multiple water sources from among 15 options. Responses were categorised into the following groups: (1) improved sources only (treated water provided by KUKL); (2) alternative sources only (water obtained exclusively from dug wells, tube wells, stone spouts, springs, rivers, rain water, jar water and tanker supply); and (3) combined water sources (both improved and alternative).
19
Water consumption was calculated by adding the values for the daily quantity of water consumed from all sources and dividing that figure by the number of family members in a household. Data were then classified into four groups (<20 l/c/d, 20−49 l/c/d, 50−99 l/c/d and 100 l/c/d) based on the WHO definitions of per capita water requirements for domestic use (WHO, 2008). According to those definitions, 20 l/c/d is sufficient for consumption, though hygiene may be compromised (basic access); 50 l/c/d may meet the requirements for consumption, hygiene and laundry (intermediate access); and 100 l/c/d is sufficient for all purposes (optimal access).
In this study, we defined ‘improved water’ as that provided by KUKL. The coverage of access to KUKL improved water against the quantities recommended by the WHO was calculated using the equation (1):
Total quantity of KUKL-provided water consumed (l/c/d) /A × 100 (%) (1)
where A represents 20 l/c/d for basic access to improved water, 50 l/c/d for intermediate access or 100 l/c/d for optimal access. Households were subsequently categorised into the following groups based on coverage of access: fully covered (≥100%); partially covered (1%−99%); and not covered (0%). This categorisation reflected access to improved water as recommended by the WHO.
Covariates
We identified potential confounding factors with respect to both access to or use of water and the chances of developing diarrhoea: demographic variables, socioeconomic status, sanitary behaviour, toilet facilities and residential area. Although some factors were mildly correlated to one another, our preliminary analysis confirmed that the factors did not cause serious multicollinearity in multivariate analysis. The demographic characteristics of the households evaluated included age of the household head, family size and number of individuals per room. Socioeconomic status included the following: ethnicity (Brahmin/Chhetri/Thakuri, Newar, Janajati or Dalit); occupation of the household head (white-collar occupation—service, business, house rental; blue-collar occupation—agriculture, manual labour or other; living from remittances; student; self-employed; and other); monthly household income (<5,000, 5,000−15,000 or >15,000 Nepalese rupees); and highest educational level attained by the household head (no education/primary education; secondary education; or college graduate or higher). Other variables included drinking water treatment practices
20
(always treated, sometimes treated or never treated) and toilet facilities (water-sealed toilet or other: pit latrine, open space, no facilities or other). VDCs and municipality wards were also used as covariates because coverage of access to KUKL-provided water varied considerably across the residential areas.
2.2.3 Statistical analysis
To evaluate differences in the 1-month prevalence of diarrhoea at the household level (i.e. the percentage of households reporting diarrhoea for the previous month), the chi-square test and Fisher’s exact test were used for categorical variables and the Mann–Whitney U test and t test for continuous variables. Multivariate logistic regression models were employed to adjust for potential confounding factors. Two models were used in the multivariate analysis. The first model was utilised to adjust for demographic and socioeconomic status, water treatment practices and toilet facilities. The second model was further adjusted for the fixed effect of residential area. We applied this two-step approach because in our preliminary analysis, the impact of residential area on variations in the main fixed effect was relatively large. Moreover, although residential area can strongly influence access to water, its impact may be concurrent with that of other variables, including socioeconomic status and sanitary environment; this is thus a potential cause of overadjustment. Statistical analyses were performed using Statistical Package for the Social Sciences version 19 (SPSS Inc., Chicago, IL, USA).
2.2.4 Ethics
The protocol of this study was approved by the Ethical Review Board of the University of Yamanashi School of Medicine.
2.3 Water quantity and quality 2.3.1 Data collection
Water sampling
Thirty-eight samples of tap water were collected from different areas of the valley during September 2012. Of these, 19 samples were collected directly from the tap source and 19 were collected from similar types of opaque, covered storage vessels (minimally affected by light) in the households. The samples were collected in 100 ml sterile polythene bottles, which were rinsed properly before sample collection. The pH,
21
electric conductivity, free residual chlorine, and bacterial indicators were measured immediately after sample collection.
Questionnaire survey
Information on the water source used, per capita water availability, water supply service level and water management in the households was collected using a constructed questionnaire {Appendix 1 (B)}. In addition, one person per household was interviewed during the survey when the water sample was collected.
2.3.2 Measurements
Variables related to water use included types of water sources used for different purposes and per capita consumption of water for different purposes. The types of water sources were identified by asking ‘What water sources is your family using?’. The answers included either tap water or groundwater. The daily water consumption per capita (litre per capita per day: l/c/d) was calculated by adding the values for the daily amount of water consumed divided by the number of family members. The water supply service level was assessed as the water supply interval, which was assessed by asking ‘How many days ago was water supplied via the tap for the last time?’. The answers were dichotomized as one day or two or longer than two days. Household water management was evaluated by the cleaning interval of water storage vessels and storage duration by asking ‘When did you last clean the storage vessel?’ Storage duration was measured by asking ‘When did you fill the storage vessel with water?’
2.3.3 Analysis
2.3.3.1 Water quality analysis
Basic physicochemical indices
The pH and electric conductivity were measured using a portable pH meter (HM-20P, TOA-DKK, Japan) and an EC meter (CM-21P, TOA-DKK, Japan), respectively.
Microbial analysis
Two bacterial indicators were measured: total coliform and E. coli. The IDEXX Quanti-Tray method (USA) was used for measuring the bacterial counts, with the reagent/sample mixture being poured directly into a Quanti-Tray. After removing the bubbles filled inside the sample-filled Quanti-Tray, it was placed onto a
22
Quanti-tray/2000 rubber insert of a Quanti-Tray Sealer, with the well side of the Quanti-Tray facing downwards. After sealing, the tray was incubated. Large and small positive wells were counted, and MPN was determined by referring to the Quanti-Tray/2000 MPN table.
Free residual chlorine
Free residual chlorine was measured by the colourimetric method using a free residual chlorine test kit (ENPHO, Nepal). Three drops of reagent were added to a 5 ml water sample and the change in colour was matched with a colour chart that showed concentrations in the range of 0.2 to 1.0 mg/l.
2.3.3.2 Statistical analysis
Fishers’ exact test was used to determine the relationship between water quality parameters and water supply interval. McNemar’s test was used to assess the relationship between source and stored water quality. We defined ‘not detected’ in the microbial analysis as less than 1 MPN/100 ml and that in the free residual chlorine as less than 0.2 mg/l for the statistical analyses. Spearman’s correlation was used to find the relationship of cleaning interval and storage duration with the indicator bacteria. Similarly, a partial correlation was used to find the relationship of the indicator bacteria with cleaning interval and storage duration, further controlling the confounding effect of each. Likewise, we further used Spearman’s correlation to assess the relationship between cleaning interval and per capita water availability. All statistical analyses were performed using SPSS version 20 (SPSS Inc., USA).
2.4 Water and mental stress 2.4.1 Data collection
Data was collected by a constructed questionnaire {Appendix 1 (C)}. The target population was women above the age of 20 years in the Kathmandu valley. Data was collected in the month of January 2013. The sample size was determined using the given formula in equation (2)
n = 1.96*1.96*0.6*(1-0.6) / (0.05)*(0.05) 372 (2) P = 0.6, 95% confidence interval and α=0.05 %
23
2010) according to water supply levels e.g. group A: water rich group >7/week; group B: middle 4-7/week; group C: water poor group <4/week. Areas were selected within each group having 90% or more with above mentioned service level. Then, four areas were randomly choose in each group (total 12 areas) as given below. Of the total 372 sample size, 31 samples were chosen from each of the area mentioned below.
Group A
Thimi municipality, ward no. 1; Thimi municipality, ward no. 3; Budhanilkantha VDC; Dhapakhel VDC
Group B
Lalitpur municipality, ward no. 6; Lalitpur municipality, ward no. 15; Kathmandu municipality, ward no. 16; Kathmandu municipality, ward no. 10
Group C
Lalitpur municipality, ward no. 9; Kathmandu municipality, ward no. 12; Kathmandu municipality, ward no. 27; Imadol VDC
2.4.2 Measurements
Water related social problem
The questionnaire to measure the water related social problem was taken as a reference from the questionnaire developed by Stevenson et. al., (2012) and modified according to the Kathmandu valley background. The questionnaire includes 5-point Likert scale as: always, often, sometimes, rarely, never. The respondents have to choose any one of the given options. The questionnaire includes the impact of water availability on social aspects of women in the Kathmandu Valley. The score obtained from the questionnaire showed non normal distribution. Therefore, the score was divided by median point (44) and the variable was divided into two categories, ‘high score’ and ‘low score’.
Perceived stress scale
The Perceived Stress Scale (PSS) is the most recently used psychological instrument for measuring the perception of stress. It is a measure of the degree to which situations in one’s life are appraised as stressful. The mental stress among the women was measured by using the Perceived Stress Scale (PSS) questionnaire (Cohen et. al., 1983).The questionnaire included ten questions on feelings and thoughts during the last month.
24
Water quantity
The daily water consumption (litre/capita/day) was calculated by adding values for the daily amount of water consumed from all sources and dividing the sum by the number of family members. Data were then classified into four groups (<20 l/c/d, 20−49 l/c/d, 50−99 l/c/d and 100 l/c/d) based on the WHO definitions of per capita water requirements for domestic use.
Quality of life
The experience about deterioration of quality of life due to water scarcity was divided into two categories as ‘always/most of the time’ and ‘sometimes/rarely/never’.
Covariates
Self rated health status divided two categories as ‘Excellent/ Very good’ and ‘Good/ fair/ poor’. Variables of social support included the friends support and personal support with two categories in each (Very satisfied/satisfied, very dissatisfied/dissatisfied/neither satisfied nor dissatisfied). Demographic characteristics included age of the women and family size. Socio-economic variables included ethnicity (Brahmin/Chettri, Newar, Janajati or Dalit); monthly household income (Not fixed income/<NRs 5000, NRs 5000 –15000, >NRs 15000 and don’t know/don’t want to answer), educational level attained (secondary education and undergraduate and above) and marital status (married/unmarried).
2.4.3 Statistical analysis
Chronbach’s alpha was used to evaluate the reliability of the questionnaire used to measure water related social problem. To evaluate the differences in the characteristics of participants in three water supply service level (Group A, Group B and Group C), chi-square test was conducted for categorical variable; one-way ANOVA was conducted for continuous variable. Logistic regression model was used to find the relationship between water quantity and water related social problem where, water related social problem is considered as an outcome variable. Linear regression model was used to find the relationship between mental stress among the women and water insecurity score. Mental stress is considered as an outcome variable.
Reference categories were ‘sometimes/rarely/never’ for deterioration of quality of life due to water scarcity; ‘Good/ fair/ poor’ for self rated health status; very dissatisfied/dissatisfied/neither satisfied nor dissatisfied for friends support and personal support; Brahmin/Chhetri/Thakuri for ethnicity; Not fixed income/<NRs 5000
25
for income; secondary education for education; unmarried for marital status
2.4.4 Ethics
All participants were explained about the survey using informed consent. Study protocol was approved from Faculty of Medicine, University of Yamanashi.
2.5 Social feasibility of alternative water uses 2.5.1 Data collection
Data was collected by using constructed questionnaire in the month of January 2013. The sample size was 372 with 95% confidence interval.
2.5.2 Measurement
The variable included the knowledge: know/don’t know, practice: use/not use motivating factor: financial and technical support, law enforcement, environmental conservation for rain water harvesting, ground water recharge and grey water recycling.
2.5.3 Statistical analysis
Descriptive statistics such as frequency, proportion was used to identify the characteristics of households. A Chi-square test was used to find the relationship between categorical variable.
26
Chapter 3
Water quantity and diarrhoea
27
This chapter includes the study on water use and diarrhoea. It discusses about the types of water sources and quantity of water used based on WHO guideline value. Additionally, it analyses the relationship of diarrhoea with water and several socio demographic variables. The sub framework of the analysis is shown in Fig 3.1. The study gives clear picture of impact of water use on diarrhoeal disease that is important for planning the appropriate water related health intervention programme for the reduction of diarrhoeal disease.
Fig 3.1 Sub-framework of analysing relationship of water use and diarrhoea 3.1 Proportion of diarrhoea and characteristics of population
The average age of the household head was 47 years, and the median family size was four. The average age of the household head and family size were not associated with the likelihood of contracting diarrhoea among family member (p = 0.97 and 0.27, respectively). Family members of 179 (7.8%) of the 2,282 households studied developed diarrhoea. Regarding water sources, 26.2% of the households used KUKL-provided improved water only, 53.3% used both KUKL-provided and alternative water sources and 20.5% used alternative water sources only. The proportion of diarrhoea was highest among the households using the combined source of water (9.2%) followed by improved source only (7%) and alternative source only (5.3%) with statistically significant relationship (p = 0.02). With respect to the total quantity of water consumption, 14.2% of households consumed 100 l/c/d or more of water; 28.9% households consumed less than 20 l/c/d. The proportion of household with diarrhoea was highest among those consuming <20l/c/d (10.9%) and highest among the household using 100 l/c/d with statistically significant relationship (P = 0.01). Households with basic access to improved water (i.e. ≥20 l/c/d of KUKL-provided water) comprised 29.1%, whereas 11.6% had intermediate access to improved water (≥50 l/c/d). Optimal access to improved water (≥100 l/c/d) was only available to 4% households (Table 3.1).
Diarrhoea
Water use Sociodemographic/
28
Table 3.1 Household socio-economic characteristics, types of water sources, access to
improved water, sanitary behaviours and proportion of contracting diarrhoea among family members in the previous month: the 2009 baseline survey of the Kathmandu Valley Water Distribution, Sewerage and Urban Development Project, Kathmandu Valley, Nepal. Variable Number of respondents, n (%) (total = 2282) Having diarrhoea, among family members n (%) (total = 179) p value (χ2-test)
Water source for domestic use
Improved source only 597 (26.2) 42 (7.0) 0.02 Improved and alternative source 1217 (53.3) 112 (9.2)
Alternative source only 468 (20.5) 25 (5.3)
Total water consumption (litre/capita/day: l/c/d)
≥100 l/c/d 305 (14.2) 11 (3.6) 0.002 50–99 l/c/d 431 (20.0) 37 (8.6)
20–49 l/c/d 796 (36.9) 58 (7.3) <20 l/c/d 623 (28.9) 66 (10.9)
Basic (≥20 l/c/d) access to improved water
Fully covered 663 (29.1) 44 (6.6) 0.01 Partially covered 981 (43.1) 96 (9.7)
Not covered 632 (27.8) 39 (6.2)
Intermediate (≥50 l/c/d) access to improved water
Fully covered 264 (11.6) 19 (7.1) 0.12 Partially covered 1386 (60.7) 121 (8.7)
Not covered 632 (27.7) 39 (6.1)
Optimal (≥100 l/c/d) access to improved water
Fully covered 91 (4.0) 4 (4.3) 0.05 Partially covered 1553 (68.2) 136 (8.7)
Not covered 632 (27.8) 39 (6.1)
Demographics
Number of individuals/room (median) 1.3 0.01a Number of family members (median) 4 0.27a Age of the household head (mean) 47 0.97b
29 Socio-economic status Occupation White collar 1771 (78.0) 127 (7.1) 0.06 Blue collar 217 (9.5) 22 (10.1) Other 283 (12.5) 30 (10.6)
Monthly household income (Nepalese
rupees: NRs) NRs > 15 000 740 (32.4) 46 (6.2) 0.21 NRs 5000–15 000 727 (31.9) 59 (8.1) NRS. < 5000 460 (20.2) 42 (9.1) Missing 335 (15.6) 32 (9.5) Level of education College 814 (35.7) 48 (5.9) 0.007c Secondary (grade 4–10) 795 (34.8) 59 (7.4) No education–Primary (grade1–3) 644 (28.2) 69 (10.7) Missing 29 (1.3) 3 (0.34) Ethnicity Brahmin/Chettry/Thakuri 956 (41.9) 75 (7.8) 0.95c Newar 711 (31.2) 56 (7.9) Janajati 469 (20.2) 36 (7.7) Dalit 25 (1.1) 3 (12.0) Missing 121 (5.3) 9 (7.4) Sanitary behaviour
Household treatment of drinking water
Always treated 1513 (66.5) 115 (7.6) 0.67 Sometimes treated 101 (4.4) 10 (9.9) Never treated 663 (29.1) 54 (8.1) Toilet facilities Water-sealed toilet 2145 (94.0) 164 (7.6) 0.14 Other 135 (6.0) 15 (11.1) a Mann–Whitney U-test b
Independent sample t-test
c
Fisher’s exact-test
30
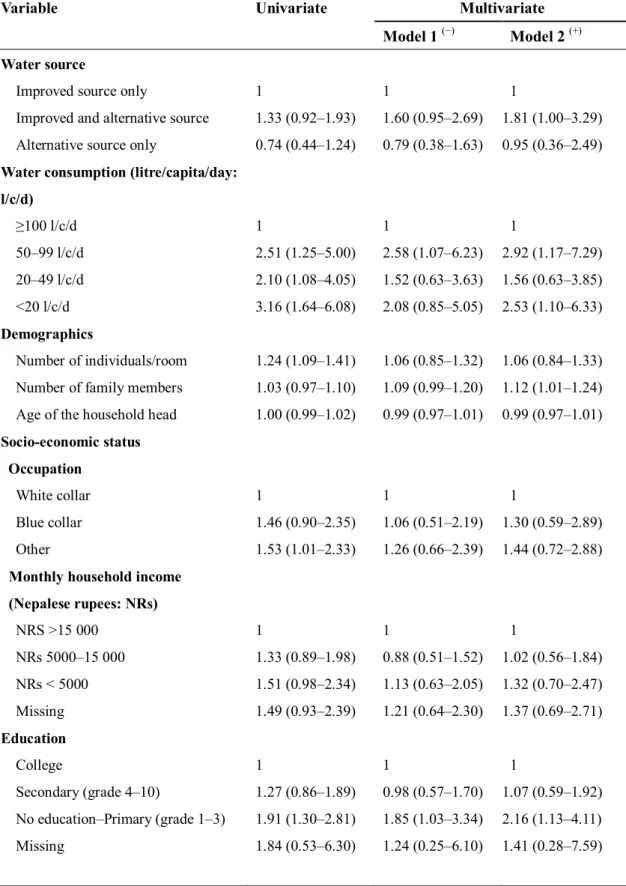
3.2 Relationship of diarrhoea and water use
Univariate logistic analyses showed that, in comparison with the other groups, households with access to less than 20 l/c/d of water had the highest likelihood of contracting diarrhoea: odds ratio (OR), 3.16; 95% confidence interval (CI), 1.64–6.08. Adjusting for sociodemographic and behavioural variables slightly attenuated this association: the adjusted OR was 2.53 (95% CI,1.10–6.33) for those with access to less than 20 l/c/d of water (model 2 in Table 3.2).
The availability of sufficient quantities of water is important. Water scarcity hampers personal hygiene, such as body washing, because human skin is colonised by innumerable bacteria (S.A. Esrey et al., 1985). An intervention study conducted in Kathmandu also revealed that hand washing reduced the number of days with diarrhoeal symptoms by 41% among children who lived in an intervention group compared with those who lived in control areas (Sen, 1999). Besides, household hygiene is also influenced by water quantity. The lack of proper hygiene influence food hygiene as well further increase the risk of diarrhoea (Scott, 1996).
Our study demonstrated that optimal amount of water (100 l/c/d) required for domestic purpose to reduce the risk of diarrhoeal disease. Regarding water sources, OR of contracting diarrhoea among household members was 1.33 (95% CI, 0.92–1.93) for households that used combined water sources, whereas the OR was 0.74 (95% CI, 0.44–1.24) for those using only alternative water sources as compared with those using improved water sources only. After accounting for variations in sociodemographic and behavioural variables, the adjusted OR for households using combined water sources was 1.81 (95% CI, 1.00–3.89), whereas the adjusted OR for households using only alternative water sources was 0.95 (95% CI, 0.36–2.49).
These factors may also explain the counterintuitive result of the present study that households using only alternative water sources were not at an increased risk of diarrhoea. Such households may have been more likely to treat their water before consumption and store it more carefully than other households. In addition, residents who were sceptical about the quality of the intermittently-provided KUKL water may have selected alternative better-quality water sources when possible. In addition the