Thrombin induced by the extrinsic pathway and PAR-1
regulated inflammation at the site of fracture repair
Nobutaka Sato1, Jiro Ichikawa1, Masanori Wako1, Tetsuro Ohba1, Masanori Saito1, Kensuke Koyama1, Tetsuo Hagino1,2, Jonathan G. Schoenecker3,4,5,6,7, Takashi Ando1,* and Hirotaka Haro1
1
Department of Orthopaedic Surgery, Faculty of Medicine, University of Yamanashi, 1110 Shimokatou, Chuo, Yamanashi 409-3898, Japan
2
The Sports Medicine and Knee Center, Kofu National Hospital, 11-35 Tenjincho, Kofu, Yamanashi 400-8533, Japan.
Departments of 3Pathology, Microbiology and Immunology, 4Orthopaedics, 5Center for Bone Biology, 6Pharmacology, and 7Pediatrics, 2200 Children’s Way, Nashville, TN 37232-9565
ABSTRACT
Thrombin (coagulation factor IIa) is a serine protease encoded by the F2 gene. Pro-thrombin
(coagulation factor II) is cut to generate thrombin in the coagulation cascade that results in a
reduction of blood loss. Procoagulant states that lead to activation of thrombin are common in bone fracture sites. However, its physiological roles and relationship with osteoblasts in bone
fractures are largely unknown. We herein report various effects of thrombin on mouse
osteoblastic MC3T3-E1 cells. MC3T3-E1 cells expressed proteinase-activated receptor 1
(PAR1), also known as the coagulation factor II receptor. They also produced monocyte
chemoattractant protein (MCP-1), tissue factor (TF), MCSF and IL-6 upon thrombin
stimulation through PI3K-Akt and MEK-Erk1/2 but not the MKK-p38 pathway. Furthermore,
MCP-1 obtained from thrombin-stimulated MC3T3-E1 cells induced migration by
macrophage RAW264 cells. All these effects of thrombin on MC3T3-E1 cells were abolished
by the selective non-peptide thrombin receptor inhibitor SCH79797. We also found that
thrombin, PAR-1, MCP-1, TF as well as phosphorylated AKT and p42/44 were significantly
expressed at the fracture site of mouse femoral bone. Collectively, thrombin/PAR-1 interaction regulated MCP-1, TF, MCSF and IL-6 production by MC3T3-E1 cells.
Furthermore, MCP-1 induced RAW264 cell migration. Thrombin may thus be a novel
cytokine that regulates several aspects of osteoblast function and fracture healing.
INTRODUCTION
The process of fracture repair is not completely understood. In general, this process has been divided into 3 phases: 1) inflammation, 2) repair and 3) remodeling(1). In the first phase, the hematoma at the fracture site induces inflammation. However, the mechanism by which coagulation affects fracture repair is unknown.
Previous studies have shown that inflammation, which is an immediate response after fracture, plays a crucial role in fracture healing(2-4). In the inflammatory phase, the hematoma at the fracture site includes mesenchymal stem cells (MSC) that have osteogenic, chondrogenic and adipogenic potentials(5). In addition, several cytokines, including interleukin-1β, IL-6 and TNF-α are increased in fracture-associated hematomas and the importance of these cytokines has already been established(6,7). Recently, chemokines including stromal derived factor (SDF)-1 and monocyte chemoattractant protein (MCP) -1 have been reported to affect fracture repair(8,9). SDF-1 could attract MSCs to the fracture site, as impairment of SDF-1 leads to delayed bone healing(9). MCP-1 plays critical roles in atherosclerosis, rheumatoid arthritis and bone tumor metastasis(10-12). MCP-1 is one of the key regulators in the inflammatory phase because it can recruit macrophages and MSCs to the inflammatory site(13).
Coagulation, which is divided into intrinsic and extrinsic pathways, takes place within the fracture-associated hematoma. The extrinsic pathway rather than the intrinsic pathway regulates fracture-associated hematomas because in the first few days following a fracture, total blood flow surrounding the fracture area is markedly decreased(14). Once the extrinsic pathway is activated, thrombin (Factor IIa) is produced and it converts fibrinogen to fibrin. The activation of the fibrinolytic system leads to the generation of plasmin that dissolves the fibrin deposit, a process that is regulated by plasminogen activator inhibitor (PAI)-1. In clinical practice, the inhibition of thrombin following administration of
anticoagulants and the inhibition of plasmin following administration of anti-fibrinolytic agents could modulate fracture repair and bone metabolism(15,16).
Protease activated receptor (PAR)-1 is a receptor for thrombin and is a member of the 7 transmembrane domain G-coupled receptor family. Three thrombin receptors, PAR-1, -3 and -4 have been identified(17). PAR-3 is a co-receptor with PAR-4, and PAR-4 is mainly expressed in platelets(18). PAR-1 is widely expressed in both normal cells and cancer cells. Thrombin cleaves the N-terminus of PAR-1. In the cleaved state, the tethered ligand portion of the PAR-1 receptor itself acts as an agonist. The function of PAR-1 is dependent on the cell type. For example, the activation of platelet PAR-1 led to the aggregation of platelets(18) and the activation of cancer cell PAR-1 led to migration and proliferation(19). Although PAR-1 has been investigated in a number of cell types, precisely how PAR-1 affects the osteoblast remains unclear.
In general, orthopedic patients who undergo surgery for fractures or arthroplasty are at risk for developing hypercoagulability that could increase the risk of deep venous thrombosis and pulmonary embolus(20). Especially hip, pelvic fracture and hip arthroplasty are at higher risk than other fractures and the administration of anticoagulants is recommended during the perioperative period(20,21). Patients with risks for myocardial infarction and stroke should take anticoagulants long-term to decrease the chance of recurrence(22,23). There is a risk that anticoagulants will impair the healing of a fracture but the precise mechanism of interaction between coagulation and fracture repair is still poorly understood. In this study, we evaluated how thrombin generated by coagulation affected the inflammatory phase through PAR-1 in the healing of a fractured bone. Towards that end, we investigated the biological effects of thrombin on mouse MC3T3-E1 cells, a clonal osteogenic cell line that maintains characteristics of primary osteoblast progenitors and is frequently used for studying osteoblast differentiation and function in vitro(24-27). Our results
suggest that thrombin/PAR-1 interaction may regulate osteoblast functions.
METHODS
Cell culture and reagents
MC3T3-E1 and RAW264 cells were purchased from Riken Cell Bank (Tsukuba, Japan). They were maintained in a standard medium MEM-α (Invitrogen, Carlsbad, CA, USA) with 10% FBS, 100 U/mL penicillin and 100 μg/mL streptomycin at 37°C in a humidified atmosphere with 5% CO2. For cell culture work, thrombin (Haematologic Technologies, Inc. Essex Junction, VT) was dissolved in 50% glycerol/water. The following were dissolved in DMSO (Sigma-Aldrich): SCH79797, a strong, selective non-peptide thrombin receptor inhibitor (Santa Cruz Biotechnology, Santa Cruz, CA); tissue factor pathway inhibitor (TFPI) (Calbiochem, San Diego, CA); LY294002, a highly selective inhibitor of phosphatidylinositol-3 (PI3) kinase (Calbiochem); and PD98059, a potent and selective cell permeable inhibitor of MAP kinase kinase (MEK) (Calbiochem) .
Western blot analysis
Cells were washed in PBS (-), lysed during 30 min shaking in CelLytic lysis buffer (Sigma-Aldrich) with a protease inhibitor cocktail and a phosphatase inhibitor cocktail (both from Sigma-Aldrich). Cell debris was cleared at 20,000 x g for 15 min. The supernatants were collected and the protein concentrations were analyzed using a BCA protein assay (Thermo Scientific, Rockford, IL) according to the manufacturer’s protocol. Equal amounts of protein were separated on 4 – 12% NuPage Bis-Tris acrylamide gels (Invitrogen) and transferred to polyvinylidene difluoride membranes (Immobilon-P; Millipore, Bedford, MA). Blots were blocked for 30 min in TBS with 0.05% Tween 20 (Sigma- Aldrich) buffer (TBST) with 2% nonfat dry milk, followed by incubation overnight at 4°C in TBST with 2% nonfat
dry milk and primary antibodies against PAR-1 (Santa Cruz), mouse tissue factor (TF) (R&D Systems Inc., Minneapolis, MN), mouse monocyte chemoattractant protein-1 (MCP-1), phospho-AKT (Ser473), AKT, phospho-p42/44 MAPK (Thr202/Thr204), p42/44, phospho-p38 (Thr180/Thr182), p38 (Cell Signaling Technology, Inc.) and β-actin (Sigma-Aldrich). After 2 washes in TBST, membranes were incubated with HRP-linked goat anti-rabbit or anti-mouse IgG antibodies (Cell Signaling Technology, Inc.) for 1 h at room temperature. After blots were washed 3 times in TBST, enhanced chemiluminescence (GE Healthcare, Fairfield, CT) was performed, and images were captured using an LAS-4000 camera system (Fujifilm, Tokyo, Japan).
Assessment of modulated intracellular Ca levels
MC3T3-E1 cells (2.5 x 10⁴/well) were seeded in a clear-bottom, black, 96-well plate in DMEM with 10% FBS for 12 h at 37°C, then switched into serum-free DMEM. One h prior to stimulation with 2 nM human thrombin, cells were loaded with 1.25 μg/mL (final concentration) Fluo4-AM in calcium assay buffer (HBSS, 20 mM HEPES, 2.5 mM probenecid). Thirty min prior to stimulation, cells were mixed with or without SCH79797. Fluorescence measurements were taken on a Molecular Devices Flexstation II 384 (Sunnyvale, CA) at excitation/emission 480/540 nm for 240 sec at 25°C.
Enzyme-linked immuno-absorbance assay (ELISA)
MC3T3-E1 cells were grown in 6-well plates. At approximately 75% confluence, cells were washed with PBS, and fresh medium (1% FBS) was added. After 24 h, conditioned media were collected and prepared by micro-centrifugation at 1,500 x g for 15 min. Concentrations of MCP-1, MCSF, IL-6, TNF-α and PAI-1 in conditioned media were determined using Quantikine quantitative colorimetric ELISA according to the manufacturer's specifications
(R&D Systems, Inc.).
Flow cytometry
MC3T3-E1 cells were cultured in 6-well plates for 24 h in MEM-α with 1% FBS then exposed to several concentrations of thrombin for 6 to 48 h. For measurement of surface TF expression, cells were retrieved using Versene (GIBCO®, Life Technologies, Carlsbad, CA) and incubated with anti-TF antibody or isotype control (normal goat IgG; R&D Systems, Inc.) for 30 min. Cells were then incubated with secondary antibody (Alexa 647, Molecular Probes, Invitrogen, Carlsbad, CA) for 30 min. Data were collected using a FACSCalibur (Becton Dickinson Biosciences). Data obtained were analyzed by CellQuest Pro (Becton Dickinson Biosciences) and FlowJo software (TreeStar, Ashland, OR).
Reverse transcription-polymerase chain reaction (PCR)
Reverse transcription-polymerase chain reaction (PCR) was performed as previously described(28). PCR amplification was performed in a Thermal Cycler-LifePro (Bioer Technology, Co., Ltd). TF and MCP-1 were assessed as follows: 94°C for 0.5 min, 58°C for 0.5 min and 72°C for 1 min [30 cycles]; β-actin: 94°C for 0.5 min, 56°C for 0.5 min, and 72°C for 1 min [30 cycles]) The PCR products were separated by 1.0% agarose gel electrophoresis and stained with 0.5 μg/mL ethidium bromide. The primers used were mouse
TF (forward, 5'- ACAGCCAGTAATTCAGCAGT -3'; reverse, 5'-
GTTTCTCCCAGGAAACTCTT -3'), mouse MCP-1 (forward, 5'-
TTAAAAACCTGGATCGGAACCAA -3'; reverse, 5'- GCATTAGCTTCAGATTTACGGGT -3') and mouse β-actin (forward, 5'- TGGAATCCTGTGGCATCCATGAAAC -3'; reverse, 5'- TAAAACGCAGCTCAGTAACAGTCCG -3').
Cell chamber immunohistochemistry
MC3T3-E1 cells were grown on 4-well culture slides(27) with or without 100 nM thrombin and/or 0.3 μM SCH79797 for 24 h, washed with PBS, and fixed with 4% paraformaldehyde. Slides were stained with goat polyclonal anti-TF antibody (1:200) (R&D Systems), goat polyclonal anti-MCP-1 antibody (1:50) or normal goat IgG (1:50) (Santa Cruz; negative control) in PBS overnight at 4°C. After extensive washing, slides were incubated with donkey biotin-conjugated anti-goat antibody (1:1000) (Santa Cruz) for 30 min at room temperature. Diaminobenzidine (DAB) staining was performed using Liquid DAB + Substrate Chromogen System according to the manufacturer's specifications (Dako North America, Inc. Carpinteria, CA), and counterstained with hematoxylin for 2 min.
Thrombin generation assay
The thrombin generation assay was performed as previously described(29). Briefly, subconfluent MC3T3-E1 cells with or without TFPI (500 μg/mL or 1,000 μg/mL) were incubated with factor VIII-deficient plasma, thrombin substrate (Z-Gly-Gly-Arg-AMC-HCI; Bachem, Torrance, CA) and CaCl2. Fluorescence was monitored for 25 min at 37°C.
Quantitative real-time PCR
Total RNA was extracted from MC3T3-E1 cells (1 x 10⁶). cDNA was then synthesized from 2 μg of total RNA by using the Reverse Transcriptase System (Applied Biosystems, Foster City, CA). Quantitative PCR analysis was performed using the ABI7500 real-time PCR system (Applied Biosystems) according to the manufacturer's instructions. Primers and probes for mouse MCP-1 (Mm00656886_g1) and mouse hypoxanthine phosphoribosyl transferase (HPRT) (Mm01545399_m1) were purchased from Applied Biosystems. The ratio of gene expression to HPRT expression was calculated, and a relative value of 1.0 was
assigned to cells that were incubated without thrombin.
Cell migration assay
Cell migration assays were performed as previously described(30). The cell migration assay was performed with a modified Boyden Transwell chamber (5 μm pore size Chemotaxicell®) (Kurabo Industries Ltd. Osaka, Japan). MC3T3-E1 cells were cultured in the lower chamber with growth medium at 1 x 10⁵ cells/well for 6 h, after which cells were cultured in serum-free medium for an additional 24 h with several concentrations of thrombin and/or 0.3 μM SCH79797. Then, 4 x 10⁴
RAW264 cells were added to the upper chamber. Basal migration and RAW264 cell-directed migration were determined after 24 h. Non-migrating cells on the upper surface of the filter were wiped off with a cotton swab and migrating cells adherent to the lower surface were fixed with 4% paraformaldehyde. Cells that had migrated to the lower surface were quantified by colorimetric measurement following staining with 1% crystal violet. Crystal violet (Sigma-Aldrich)-stained cultures were extracted with 99% ethanol for 10 min at room temperature. The optical density of the extracted dye was measured at 590 nm with a SH-1100R microplate reader (CORONA ELECTRIC Co., Ltd, Ibaraki, Japan)
Animals
All animal care was approved by the Institutional Animal Care and Use Committee of the University of Yamanashi. C57BL/6 mice (CLEA Japan, Inc, Tokyo, Japan) were housed at 22-24 °C with a 12-hour light/dark cycle with standard mouse chow and water provided ad
libitum. Male C57BL/6 mice, aged 8 weeks, received general anesthesia with Isoflurane
(ISOFLU®) (Abbott Laboratories, North Chicago, IL) and oxygen, and an artificial fracture was made in the left femoral bone. Mice were separated into 3 groups: 1 - major fracture, 2 -
minor fracture, 3 - control (sham) (n = 3 in each group). Mice were sacrificed after 1 week (9 weeks of age) by CO2 inhalation.
Histologic analysis
Histologic analysis was performed as previously described(31). The femoral bones of C57BL/6 mice were fixed in 4% paraformaldehyde and decalcified with 10% EDTA. Bones were then paraffin-embedded and consecutive 5 μm sections were stained with hematoxylin and eosin (H&E), Safranin-O (Merck KGaA, Darmstadt, Germany), Alizarin red (Sigma-Aldrich) or Alcian blue (Wako Pure Chemical Industries, Ltd, Osaka, Japan). Alkaline phosphatase (ALP) or tartrate-resistant acid phosphatase (TRACP) activity was determined with the TRACP & ALP double-stain kit (Takara Bio Inc., Shiga, Japan). IHC stains for thrombin, PAR-1, MCP-1 (Santa Cruz), TF (R&D Systems), phospho-AKT or phospho-p42/44 (Cell Signaling Technology) were performed using Liquid DAB + Substrate Chromogen System according to the manufacturer's specifications (Dako, North America), and counterstained with hematoxylin.
Statistical Analysis
Data are presented as means ± SD. Significance was determined using Student’s or Welch’s t-test after an F-test was performed, unless otherwise stated. If the raw data did not fit a normal distribution, the Mann–Whitney U-test was used. p < 0.05 was considered to be significant.
RESULTS
MC3T3-E1 cells expressed functional thrombin receptors (PAR-1)
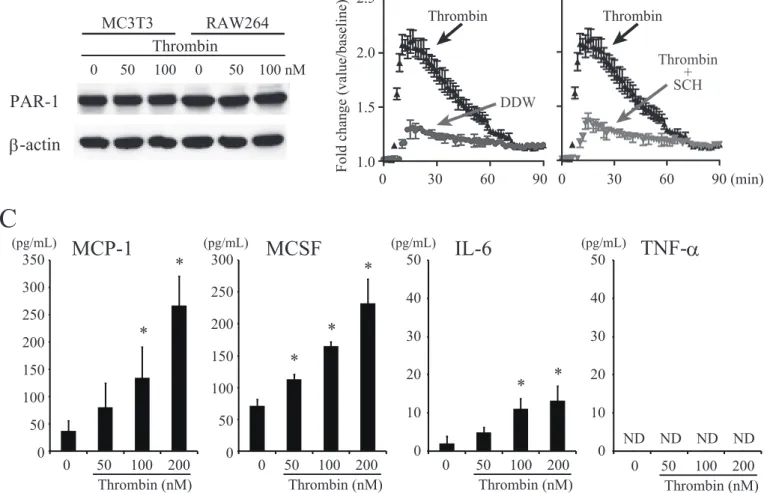
functional thrombin receptor, PAR-1, was expressed on osteoblastic MC3T3-E1 cells. As shown in Figure 1A, Western blot analysis showed that PAR-1 was expressed on MC3T3-E1 cells, equal to the level found on mouse macrophage RAW264 cells, the positive control(32). Thrombin treatment did not change the level of protein expression of PAR-1 by MC3T3-E1 cells; however, thrombin induced a rapid increase of intercellular calcium level in MC3T3-E1 cells. The increase was abrogated by the addition of SCH79797, a selective non-peptide thrombin receptor inhibitor (Fig. 1B). MC3T3-E1 cells were cultured with several doses of thrombin for 24 h. Using ELISA analysis, we confirmed that thrombin significantly induced MCP-1, MCSF and IL-6 production by MC3T3-E1 cells in a dose-dependent manner (Fig. 1C).
Induction of TF expression on MC3T3-E1 cells generated thrombin production
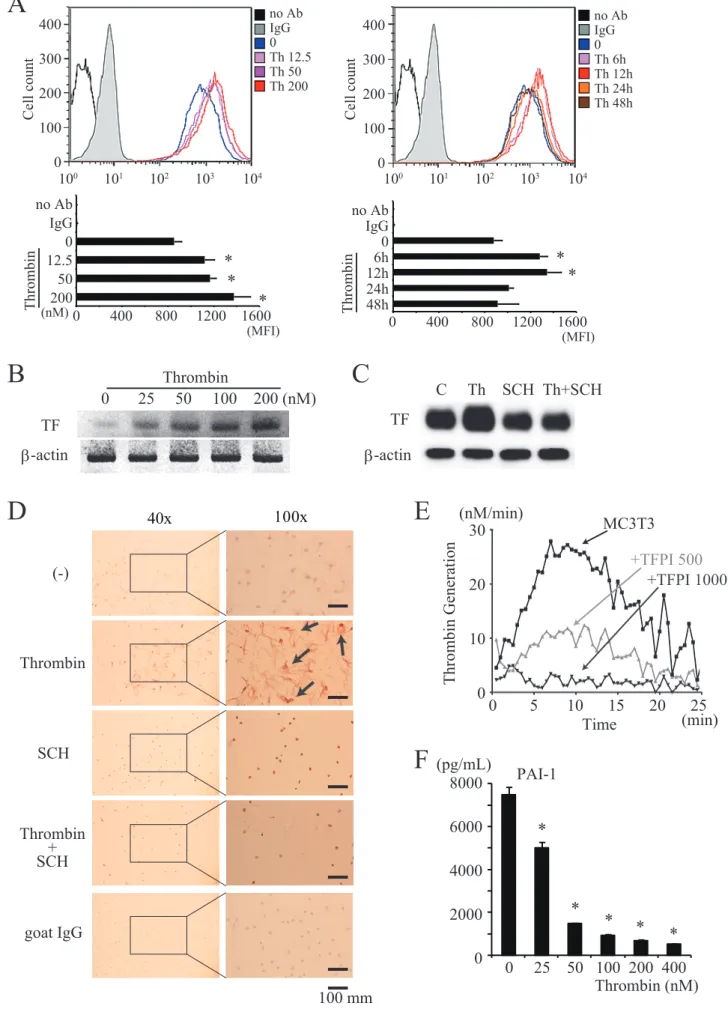
Thrombin significantly increased TF expression on the surface of MC3T3-E1 cells in a dose-dependent manner with a 6 to 12 h peak time (Fig. 2A). Using PCR analysis, we confirmed that thrombin significantly upregulated the mRNA level of TF by MC3T3-E1 cells in a dose-dependent manner (Fig. 2B). We next investigated protein expression of TF by MC3T3-E1 cells with Western blot analysis and cell chamber immunohistochemistry. These results showed that thrombin stimulation upregulated TF protein expression, and it was abrogated by the addition of SCH79797 (Fig. 2C and D). Furthermore, TF increased the level of thrombin in conditioned medium of MC3T3-E1 cells, a result that was abrogated by the addition of tissue factor pathway inhibitor (TFPI) (Fig. 2E). In contrast, plasminogen activator inhibitor-1 (PAI-1) production was reduced by thrombin stimulation (Fig. 2F).
MCP-1 produced by MC3T3-E1 cells induced RAW264 cell migration
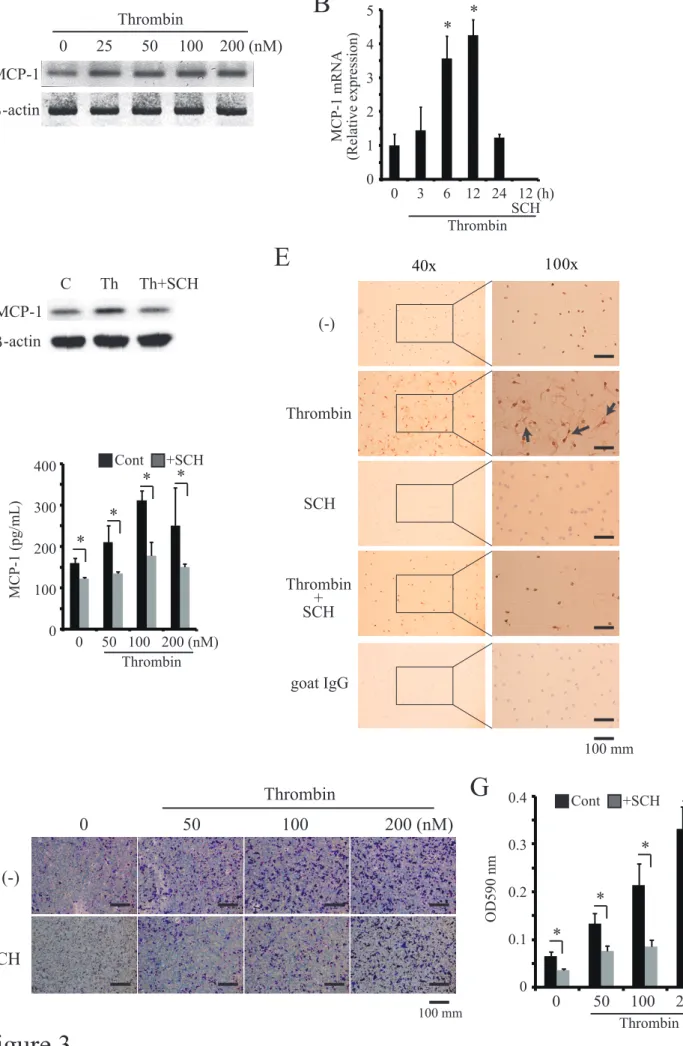
production of MCP-1 in a dose- and time- dependent manner, which was abrogated by the addition of SCH79797 as determined by PCR analysis (Fig. 3A), quantitative real time PCR (Fig. 3B), Western blot analysis (Fig. 3C), ELISA analysis (Fig. 3D) and cell chamber immunohistochemistry (Fig. 3E). The MCP-1 produced by MC3T3-E1 cells functionally induced RAW264 cell migration in a dose-dependent manner and it was abrogated by the addition of SCH79797 (Fig. 3F and G).
Thrombin-induced production of MCP-1 and IL-6 by MC3T3-E1 cells involved the PI3K, Akt and MAPK Erk pathways
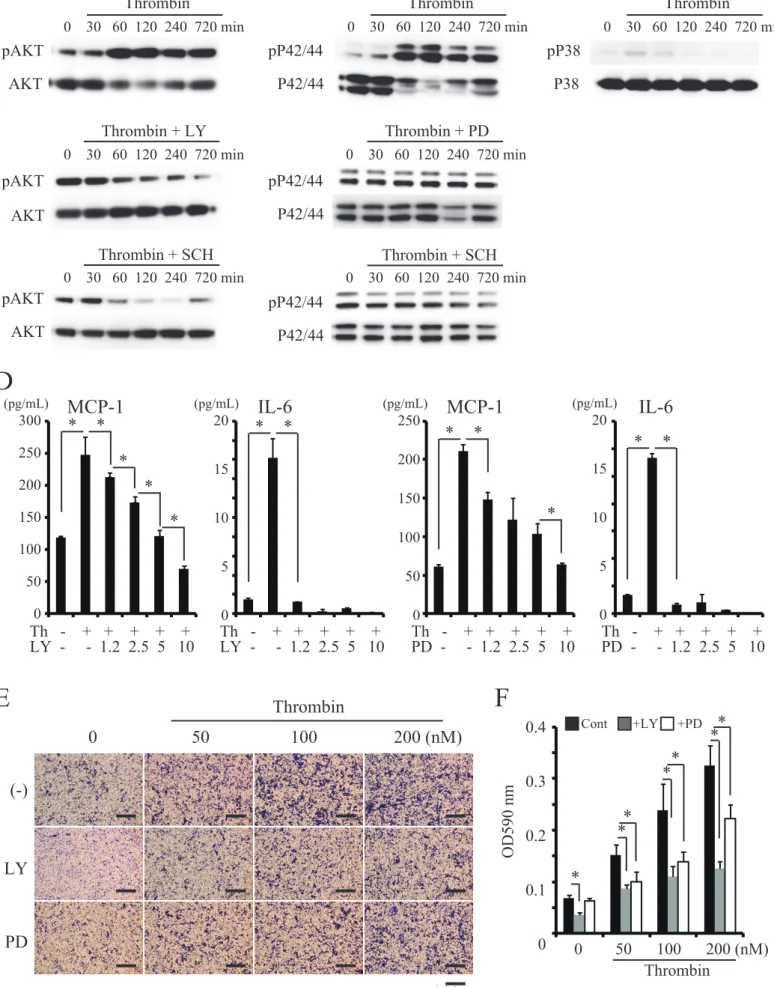
To clarify intracellular signaling pathways involved in thrombin-induced MCP-1 and IL-6 production by MC3T3-E1 cells, we examined the effects of several inhibitors. Phosphorylation of AKT was induced by thrombin treatment of MC3T3-E1 cells, and this was abrogated by the addition of LY294002 (an inhibitor of PI3K) or SCH79797 (Fig. 4A). Phosphorylation of Erk p42/44 was also induced by thrombin treatment of MC3T3-E1 cells. The phosphorylation was abrogated by the addition of PD98059 (an inhibitor of the MAPK Erk pathway) or SCH79797 (Fig. 4A). However, thrombin did not induce phosphorylation of p38 MAPK in MC3T3-E1 cells (Fig. 4C). LY294002 and PD98059 significantly suppressed thrombin-induced MCP-1 and IL-6 production in MC3T3-E1 cells in a dose-dependent manner (Fig. 4D). Moreover, RAW264 cell migration induced by conditioned medium / MCP-1 obtained from thrombin-treated MC3T3-E1 cells was significantly suppressed by LY294002 and PD98059 (Fig. 4E and F). These results indicated that thrombin activated several functional intracellular signaling pathways in MC3T3-E1 cells.
Thrombin stimulation of MC3T3-E1 cells and the resultant PI3K-AKT signaling may regulate the MAPK-Erk P42/44 pathway
Thrombin treatment of MC3T3-E1 cells induced PI3K-AKT and MAPK-Erk p42/44 signaling and caused cytokine production. We investigated which signaling process was upstream. Both the phosphorylation of AKT and the phosphorylation of Erk p42/44 induced by thrombin treatment of MC3T3-E1 cells were abrogated by the addition of PI3K inhibitor LY294002. However, MAPK inhibitor PD98059 decreased phosphorylation of Erk p42/44, but did not affect the phosphorylation level of AKT (Fig. 5A). These results indicated that when MC3T3-E1 cells were activated by thrombin, PI3K-AKT signaling was probably upstream from MAPK-Erk signaling.
Thrombin and related proteins expressed at the site of bone fracture in vivo
Finally, we investigated whether thrombin and related proteins were expressed at the site of bone fractures using a mouse fracture model. Male 8-week-old C57BL/6 mice received general anesthesia with Isoflurane. Then, an artificial fracture was made in the left femoral bone. Mice were sacrificed after 1 week. We compared 3 groups in the fracture model: 1 - major fractures, 2 - minor fractures, 3 – control (no fracture) using hematoxylin and eosin (Fig. 6A), Safranin-O (Fig. 6B), Alizarin red (Fig. 6C) and Alcian blue (Fig. 6D) stains. Osteoblast activity was detected by alkaline phosphatase (ALP) stain and osteoclast activity was detected by tartrate-resistant acid phosphatase (TRACP) stain in both major and minor fracture sites (Fig 6E and F). Major fractures had more ALP-positive cells than did minor fractures. On the other hand, minor fractures had more TRACP-positive cells than did major fractures. To clarify the relationship between thrombin expression and related proteins in mouse bone fractures, we conducted IHC staining. More cells positive for thrombin, PAR-1 and TF were found in major fractures than minor fractures. Conversely, MCP-1 had the opposite pattern (Fig. 7A-D). In contrast, there were no positively stained cells in the normal bone cortex of the control. Moreover, phospho-AKT- and phospho-p42/44-positive cells were
found very close to the thrombin-positive area (Fig. 7E and F). These results indicated that thrombin induced MCP-1 and TF production by activated osteoblasts via PAR-1/PI3K-AKT and MAPK p42/44 signal pathways in vivo.
DISCUSSION
In this study, we identified osteoblast express functional TF, which could activate extrinsic pathway and finally generate Thrombin. This Thrombin affected both the coagulation which increase the TF of osteoblast and fibrinolysis which decrease the PAI-1. In addition, Thrombin could recruit the macrophage through the MCP-1 and both MEK and AKT has pivotal role in Thrombin induced intercellular signaling through PAR-1.
The extrinsic pathway is a series of steps in which the binding of both TF and Factor VII causes the generation of thrombin. The extrinsic pathway is dependent on the cell surface of TF.
In our study, mouse osteoblasts expressed TF on the cell surface and it was functional in terms of activating coagulation. TNF-α, IL-1β, IL-6 and MCP-1 are important mediators in the inflammatory phase(6-8). In this study, thrombin rapidly induced both MCP-1 and IL-6 that resulted in inflammation and more cell surface TF which resulted in coagulation. In addition, using IHC, our mouse fracture model demonstrated the expression of thrombin, TF, and MCP-1 at the fracture site. We propose that thrombin is a strong inducer of inflammation (in addition to TNF-α and IL-1β).
MCP-1 is a chemokine and the role of MCP-1 and its receptor (CCR2) in fracture repair is thought to be the recruitment of macrophages and MSCs(8,13). In a rat stress fracture model, the level of MCP-1 in rat serum rapidly increased 6 h after fracture and reached a peak after 48 h(33). A previous study showed that MCP-1 induced MSC migration in a dose-dependent manner and that both MCP-1KO and CCR2KO mice were delayed in
fracture healing compared with WT mice. In addition, the administration of a CCR2 antagonist before fracture resulted in delayed healing(13).
Vi et al. described the role of macrophages in fracture repair. Macrophage-depleted mice showed a 25% reduction in bone mineral density compared with control mice. In addition, calluses in macrophage-deficient mice were smaller and retained more fibrotic tissue and less bone compared with control mice(34). In our study, MCSF as well as MCP-1 was increased by thrombin. MCSF was also observed in the hematoma and serum(35). MCSF is important not only in inflammation but also in repair and remodeling because osteoclast development and maturation depend on MCSF as well as RANKL(36). In addition, the administration of MCSF to mice resulted in better fracture healing compared to a control group(37). Based on these findings, thrombin appears to be a key regulator for the overall process of fracture healing because thrombin can induce both MCP-1 and MCSF.
We found that thrombin induced TF on the osteoblast cell surface within 6 h. Thus, thrombin generated within the fracture resulted in the generation of more thrombin through PAR-1, which contributed to the initiation and maintenance of inflammation. Similar findings of thrombin-regulated TF expression were obtained in HUVEC and SMC(38,39). This rapid cellular response to thrombin is quite important because the blood flow to the fracture site was rapidly decreased[14] and the decrease of blood flow led to the impairment of inflammation and delayed fracture healing. The increase of TF by thrombin was especially indispensable to maintain the inflammation in early phase.
With regard to fibrinolysis, thrombin inhibited PAI-1 (an inhibitor of plasmin) in a dose-dependent fashion. We already reported how fibrinolysis affected bone metabolism. Excessive fibrinolysis resulted in inflammation-induced osteoporosis(15). We propose that thrombin at the fracture site is important not only to initiate inflammation and fracture healing but also to maintain the balance between coagulation and fibrinolysis.
PAR-1 is a receptor for thrombin and is expressed in the musculoskeletal system by osteoblasts, chondroblasts and myoblasts(40). Previous study showed in drill used fracture model although blood clot formation and cellularity in the PAR-1 KO mice were no significantly differences in WT mice, new mineralized bone area was less and the number of MSCs were fewer in PAR-1 KO mice compared with WT mice.
Finally, fracture healing in PAR-1KO mice was the same as in WT mice. This paper suggested that an early inflammation thrombin/PAR-1 pathway played a crucial role(41). Several reports have shown that PKC, MEK, ERK and Rho kinase were activated during thrombin-induced MCP-1 production(12,42). Although our results showed that the main pathway was via AKT and MEK, it is possible that thrombin-induced intracellular signaling depends on the cell type.
This study has some limitations. First, we used only MC3T3-E1 cells in this study. Further studies using other cell lines, primary osteoblast or stem cells could clarify the mechanism of thrombin-regulated osteoblast function. Second, we cultured MC3T3-E1 cells for only 6 to 48 h. Treatments were administered in identical culture conditions. Different culture conditions (culture medium, culture plate, degree of cell confluence, O2 concentration, CO2 concentration, etc.) might produce different results. Third, we investigated thrombin and related proteins expressed at the bone fracture site in vivo using only histologic analysis. Further studies using other evaluations such as bone biology, mechanical stress evaluation and remodeling status also are needed to clarify the mechanism of thrombin-regulated bone fracture healing.
In conclusion, we demonstrated a pivotal role for thrombin in fracture repair. Thrombin/PAR-1 interaction regulated MCP-1, TF, MCSF, IL-6 and PAI-1 production from mouse osteoblastic MC3T3-E1 cells. MCP-1 enhanced mouse macrophage RAW264 cell migration. Thrombin may thus be a novel cytokine that regulates several aspects of osteoblast
function. These observations should contribute to a better understanding of fracture repair regulated by thrombin-mediated coagulation.
CONFLICT OF INTEREST
In connection with this study, there is no conflict of interest with any company to be disclosed.
ACKNOWLEDGEMENTS
The authors thank Ms. Chizuru Chino and Ms. Mika Ubagai for technical assistance, and Kahori Sano and Azusa Sakamoto for secretarial assistance. This work was supported by JSPS KAKENHI Grant Number 24592191 and 25861303.
REFERENCES
1. Claes L, Recknagel S, Ignatius A. Fracture healing under healthy and inflammatory conditions. Nat Rev Rheumatol. 2012;8(3):133-43.
2. Marsell R, Einhorn TA. The biology of fracture healing. Injury. 2011;42(6):551-5.
3. Bastian O, Pillay J, Alblas J, Leenen L, Koenderman L, Blokhuis T. Systemic inflammation and fracture healing. J Leukoc Biol. 2011;89(5):669-73.
4. Glass GE, Chan JK, Freidin A, Feldmann M, Horwood NJ, Nanchahal J. TNF-alpha promotes fracture repair by augmenting the recruitment and differentiation of muscle-derived stromal cells. Proc Natl Acad Sci U S A. 2011;108(4):1585-90.
5. Oe K, Miwa M, Sakai Y, Lee SY, Kuroda R, Kurosaka M. An in vitro study demonstrating that haematomas found at the site of human fractures contain progenitor cells with multilineage capacity. J Bone Joint Surg Br. 2007;89(1):133-8.
6. Cho TJ, Gerstenfeld LC, Einhorn TA. Differential temporal expression of members of the transforming growth factor beta superfamily during murine fracture healing. J Bone Miner Res. 2002;17(3):513-20.
7. Kon T, Cho TJ, Aizawa T, et al. Expression of osteoprotegerin, receptor activator of NF-kappaB ligand (osteoprotegerin ligand) and related proinflammatory cytokines during fracture healing. J Bone Miner Res. 2001;16(6):1004-14.
8. Wu AC, Morrison NA, Kelly WL, Forwood MR. MCP-1 expression is specifically regulated during activation of skeletal repair and remodeling. Calcif Tissue Int. 2013;92(6):566-75. 9. Kitaori T, Ito H, Schwarz EM, et al. Stromal cell-derived factor 1/CXCR4 signaling is
critical for the recruitment of mesenchymal stem cells to the fracture site during skeletal repair in a mouse model. Arthritis Rheum. 2009;60(3):813-23.
10. Lu Y, Cai Z, Xiao G, et al. Monocyte chemotactic protein-1 mediates prostate cancer-induced bone resorption. Cancer Res. 2007;67(8):3646-53.
11. Okamoto M, Fuchigami M, Suzuki T, Watanabe N. A novel C-C chemokine receptor 2 antagonist prevents progression of albuminuria and atherosclerosis in mouse models. Biol Pharm Bull. 2012;35(11):2069-74.
12. Huang CY, Chen SY, Tsai HC, Hsu HC, Tang CH. Thrombin induces epidermal growth factor receptor transactivation and CCL2 expression in human osteoblasts. Arthritis Rheum. 2012;64(10):3344-54.
13. Ishikawa M, Ito H, Kitaori T, et al. MCP/CCR2 signaling is essential for recruitment of mesenchymal progenitor cells during the early phase of fracture healing. PLoS One. 2014;9(8):e104954.
14. Grundnes O, Reikeras O. Blood flow and mechanical properties of healing bone. Femoral osteotomies studied in rats. Acta Orthop Scand. 1992;63(5):487-91.
Rheumatol. 2014;66(8):2222-33.
16. Pountos I, Georgouli T, Blokhuis TJ, Pape HC, Giannoudis PV. Pharmacological agents and impairment of fracture healing: what is the evidence? Injury. 2008;39(4):384-94. 17. Mackie EJ, Pagel CN, Smith R, de Niese MR, Song SJ, Pike RN. Protease-activated
receptors: a means of converting extracellular proteolysis into intracellular signals. IUBMB Life. 2002;53(6):277-81.
18. Yang J, Xu K, Seiffert D. Challenges and promises of developing thrombin receptor antagonists. Recent Pat Cardiovasc Drug Discov. 2010;5(3):162-70.
19. Yang E, Boire A, Agarwal A, et al. Blockade of PAR1 signaling with cell-penetrating pepducins inhibits Akt survival pathways in breast cancer cells and suppresses tumor survival and metastasis. Cancer Res. 2009;69(15):6223-31.
20. Wendl-Soeldner MA, Moll CW, Kammerlander C, Gosch M, Roth T. Algorithm for anticoagulation management in geriatric hip fracture patients--Surgeons save Blood. Z Gerontol Geriatr. 2014;47(2):95-104.
21. Mismetti P, Samama CM, Rosencher N, et al. Venous thromboembolism prevention with fondaparinux 1.5 mg in renally impaired patients undergoing major orthopaedic surgery. A real-world, prospective, multicentre, cohort study. Thromb Haemost. 2012;107(6):1151-60.
22. Epple C, Steiner T. Acute stroke in patients on new direct oral anticoagulants: how to manage, how to treat? Expert Opin Pharmacother. 2014;15(14):1991-2001.
23. Hawes EM, Viera AJ. Anticoagulation: indications and risk classification schemes. FP Essent. 2014;422:11-7.
24. Waters KM, Tan R, Genetos DC, Verma S, Yellowley CE, Karin NJ. DNA microarray analysis reveals a role for lysophosphatidic acid in the regulation of anti-inflammatory genes in MC3T3-E1 cells. Bone. 2007;41(5):833-41.
25. Thaler R, Spitzer S, Rumpler M, et al. Differential effects of homocysteine and beta aminopropionitrile on preosteoblastic MC3T3-E1 cells. Bone. 2010;46(3):703-9.
26. Sudo H, Kodama HA, Amagai Y, Yamamoto S, Kasai S. In vitro differentiation and calcification in a new clonal osteogenic cell line derived from newborn mouse calvaria. J Cell Biol. 1983;96(1):191-8.
27. Ando T, Ichikawa J, Wako M, et al. TWEAK/Fn14 interaction regulates RANTES production, BMP-2-induced differentiation, and RANKL expression in mouse osteoblastic MC3T3-E1 cells. Arthritis Res Ther. 2006;8(5):R146.
28. Ohba T, Cates JM, Cole HA, et al. Autocrine VEGF/VEGFR1 signaling in a subpopulation of cells associates with aggressive osteosarcoma. Mol Cancer Res. 2014;12(8):1100-11. 29. Ichikawa J, Cole HA, Magnussen RA, et al. Thrombin induces osteosarcoma growth, a
30. Ohba T, Cole HA, Cates JM, et al. Bisphosphonates inhibit osteosarcoma-mediated osteolysis via attenuation of tumor expression of MCP-1 and RANKL. J Bone Miner Res. 2014;29(6):1431-45.
31. Ando T, Hatsushika K, Wako M, et al. Orally administered TGF-beta is biologically active in the intestinal mucosa and enhances oral tolerance. J Allergy Clin Immunol. 2007;120(4):916-23.
32. Lo HM, Chen CL, Tsai YJ, Wu PH, Wu WB. Thrombin induces cyclooxygenase-2 expression and prostaglandin E2 release via PAR1 activation and ERK1/2- and p38 MAPK-dependent pathway in murine macrophages. J Cell Biochem. 2009;108(5):1143-52. 33. Sears BW, Volkmer D, Yong S, et al. Correlation of measurable serum markers of inflammation with lung levels following bilateral femur fracture in a rat model. J Inflamm Res. 2010;2010(3):105-14.
34. Vi L, Baht GS, Whetstone H, et al. Macrophages promote osteoblastic differentiation in-vivo: implications in fracture repair and bone homeostasis. J Bone Miner Res. 2014. 35. Sarahrudi K, Mousavi M, Thomas A, et al. Elevated levels of macrophage
colony-stimulating factor in human fracture healing. J Orthop Res. 2010;28(5):671-6. 36. Suda T, Kobayashi K, Jimi E, Udagawa N, Takahashi N. The molecular basis of osteoclast
differentiation and activation. Novartis Found Symp. 2001;232:235-47; discussion 47-50. 37. Sarahrudi K, Mousavi M, Grossschmidt K, et al. The impact of colony-stimulating factor-1
on fracture healing: an experimental study. J Orthop Res. 2009;27(1):36-41.
38. Pepke W, Eisenreich A, Jaster M, et al. Bivalirudin inhibits periprocedural platelet function and tissue factor expression of human smooth muscle cells. Cardiovasc Ther. 2013;31(2):115-23.
39. Kothari H, Kaur G, Sahoo S, Idell S, Rao LV, Pendurthi U. Plasmin enhances cell surface tissue factor activity in mesothelial and endothelial cells. J Thromb Haemost. 2009;7(1):121-31.
40. Mackie EJ, Loh LH, Sivagurunathan S, et al. Protease-activated receptors in the musculoskeletal system. Int J Biochem Cell Biol. 2008;40(6-7):1169-84.
41. Song SJ, Pagel CN, Campbell TM, Pike RN, Mackie EJ. The role of protease-activated receptor-1 in bone healing. Am J Pathol. 2005;166(3):857-68.
42. Deng X, Mercer PF, Scotton CJ, Gilchrist A, Chambers RC. Thrombin induces fibroblast CCL2/JE production and release via coupling of PAR1 to Galphaq and cooperation between ERK1/2 and Rho kinase signaling pathways. Mol Biol Cell. 2008;19(6):2520-33.
Figure Legends
Figure 1. MC3T3-E1 cells expressed functional thrombin receptor PAR-1
(A) Western blot analysis showed that PAR-1 was expressed on MC3T3-E1 cells at levels
similar to that on the positive control, RAW264 cells. MC3T3-E1 cells and RAW264 cells were stimulated with 50 or 100 nM thrombin. (B) Thrombin induced a rapid increase of intercellular calcium in MC3T3-E1 cells, an increase that was abrogated by the addition of SCH79797 selective non-peptide thrombin R inhibitor. Fluorescence measurements were made with a Molecular Devices Flexstation II 384 (C) MC3T3-E1 cells were cultured with several doses (0 – 200 nM) of thrombin for 24 h. The culture supernatants were then collected, and the MCP-1, MCSF, IL-6 and TNF-α concentrations were measured by enzyme-linked immunosorbent assay (ELISA). Values represent the means ± standard deviation. *, p < 0.05 compared with corresponding control. Similar results were obtained in at least 3 independent experiments.
Figure 2. Induction of TF expression in MC3T3-E1 cells led to thrombin production (A) Cell surface expression of TF on MC3T3-E1 cells. MC3T3-E1 cells were treated with
several doses of thrombin (12.5 – 200 nM) (open histogram) or PBS(-) (filled histogram) for the indicated periods (0 – 48 h). Cells were incubated with anti-TF antibody or isotype control, then with Alexa 647-conjugated secondary antibody. Data were collected using a FACSCalibur and calculated MFIs are shown in the lower panel. (B) MC3T3-E1 cells were stimulated with several concentrations (0 – 200 nM) of thrombin for 24 h. TF mRNA expression was then evaluated by reverse transcription-polymerase chain reaction. (C) MC3T3-E1 cells were stimulated with 100 nM thrombin with or without SCH79797 for 24 h. The cell lysates were then subjected to Western blot analysis with anti-TF and anti-β-actin
antibody. (D) On chamber slide glass, MC3T3-E1 cells were stimulated with 100 nM thrombin with or without SCH79797 for 24 h and stained for anti-TF antibody (brown) by immunohistochemistry. Representative images from 3 independent experiments are shown (Arrow, positive cell and scale bar, 100 μm). (E) MC3T3-E1 cells were incubated with or without 500 μg/mL or 1000 μg/mL TFPI. Fluorescence was monitored for 25 min. (F) MC3T3-E1 cells were cultured with several doses (0 - 400nM) of thrombin for 24 h. The culture supernatants were then collected and the plasminogen activator inhibitor-1 (PAI-1) concentrations were measured by ELISA.
Figure 3. MCP-1 produced by MC3T3-E1 cells induced migration of RAW264 cells
MC3T3-E1 cells were stimulated with several concentrations of thrombin (0 – 200 nM) with or without SCH79797. MCP-1 mRNA expression was then evaluated by PCR at several time points (0 – 24 h) (A) or by quantitative real-time PCR (B). The cell lysates were subjected to Western blot analysis with anti-TF and anti-β-actin antibody (C). The culture supernatants were then collected and the MCP-1 concentrations were measured by ELISA (D). (E) On chamber slide glass, MC3T3-E1 cells were stimulated with 100 nM thrombin with or without SCH79797 for 24 h and stained for anti-MCP-1 antibody (brown) by immunohistochemistry. Representative images from 3 independent experiments are shown (Arrow, positive cell and Scale bar, 100 μm). (F) MC3T3-E1 cells were cultured in the lower chamber with several concentrations of thrombin with or without 0.3 μM SCH79797. Then, RAW264 cells were added to the upper chamber. Cells that had migrated to the lower surface were fixed and stained with crystal violet(Scale bar, 100 μm). (G) Stained cultures were extracted with 99% ethanol, then absorbance was quantified at 590 nm (OD 590). Values represent the mean ± standard deviation. *, p < 0.05 compared with corresponding control. Similar results were obtained in at least 3 independent experiments.
Figure 4. MCP-1 and IL-6 production induced in MC3T3-E1 cells by thrombin involved the PI3K Akt and MAPK Erk pathways
MC3T3-E1 cells were stimulated with 100 nM thrombin for the indicated time periods with or without LY294002, PD98059 or SCH79797. The cell lysates were then subjected to Western blot analysis with antibodies specific for phosphorylated Akt, Akt (A), phosphorylated Erk P42/44, Erk P42/44 (B) phosphorylated P38 and P38 (C). The culture supernatants were collected and the MCP-1 and IL-6 concentrations were measured by ELISA (D). (E) MC3T3-E1 cells were cultured in the lower chamber with several concentrations of thrombin with or without PI3K inhibitor LY294002 or MAPK inhibitor PD98059. Then, RAW264 cells were added to the upper chamber. Cells that had migrated to the lower surface were fixed and stained with crystal violet(Scale bar, 100 μm). (F) Stained cultures were extracted with 99% ethanol, then absorbance was quantified at 590 nm (OD 590). Values represent means ± standard deviation. *, p < 0.05 compared with corresponding control. Similar results were obtained in at least 3 independent experiments.
Figure 5. Thrombin-induced cell signaling in osteoblastic MC3T3-E1 cells: a model
(A) MC3T3-E1 cells were stimulated with 100 nM thrombin for the indicated time periods with or without LY294002 or PD98059. The cell lysates were then subjected to Western blot analysis with antibodies specific for phosphorylated Akt, Akt, phosphorylated Erk P42/44, Erk P42/44 or β-actin. (B) Schematic model summarizing results obtained in this study.
Figure 6. An artificial fracture model in vivo
Male C57BL/6 mice, aged 8 weeks, received general anesthesia and an artificial fracture was made in the left femoral bone. Mice were separated into 3 groups: 1 - major fracture, 2 -
minor fracture, 3 – control (sham). Femoral bones were stained with hematoxylin and eosin (A), Safranin-O (B), Alizarin red (C) or Alcian blue (D). Osteoblast activity was detected by alkaline phosphatase (ALP) stain (E) and osteoclast activity was detected by tartrate-resistant acid phosphatase (TRACP) stain (F). Representative images from 3 independent experiments are shown (Arrow, positive cell and Scale bar, 100 μm).
Figure 7. Thrombin and related proteins expressed at the site of bone fracture
Localization of thrombin (A), PAR-1 (B), MCP-1 (C), TF (D), phosphorylated AKT (E) and phosphorylated Erk P42/44-positive cells (F) at the bone fracture site were detected by immunohistochemistry (same slide as Figure 6). Representative images from 3 independent experiments are shown (Arrow, positive cell and Scale bar, 100 μm).
Figure 1
A
C
PAR-1 β-actin Thrombin 0 50 100 0 50 100 nM MC3T3 RAW264B
IL-6
MCSF
MCP-1
350 300 250 200 150 100 50 0 300 250 200 150 100 50 0 50 40 30 20 10 0 (pg/mL) (pg/mL) (pg/mL) 2.5 2.0 1.5 1.0Fold change (value/baseline)
Thrombin Thrombin DDW Thrombin + SCH
TNF-α
50 40 30 20 10 0 (pg/mL) ND ND ND ND 0 50 100 200Thrombin (nM) 0 50 100 200Thrombin (nM) 0 50 100 200Thrombin (nM) 0 50 100 200Thrombin (nM)
* * * * * * * 0 30 60 90 0 30 60 90 (min)
Figure 2
A
B
C Th SCH Th+SCH TF β-actin 100x 0 400 800 1200 1600 no Ab IgG 0 12.5 50 200 0 400 800 1200 1600 no Ab IgG 0 6h 12h 24h 48h Thrombin Thrombin 100 101 102 103 104 no Ab IgG 0 Th 12.5 Th 50 Th 200 (nM) (MFI) (MFI) no Ab IgG 0 Th 6h Th 12h Th 24h Th 48h 100 101 102 103 104 Cell count 400 300 200 100 0 400 300 200 100 0 Cell count TF β-actinC
0 25 50 100 200 (nM)D
E
30 20 10 0 Thrombi n Generation (nM/min) 0 5 10 15 20 25 Time (min) (-) Thrombin SCH Thrombin + SCH MC3T3 +TFPI 500 +TFPI 1000 40x goat IgGF
0 25 50 100 200 400 8000 6000 4000 2000 0 PAI-1 (pg/mL) Thrombin (nM) 100 mm Thrombin * * * * * * * * * *Figure 3
A
D
5 4 3 2 1 0 MCP-1 mRNA (Relative expressi on) 0 3 6 12 24 12 (h) MCP-1 β-actin 0 25 50 100 200 (nM) ThrombinSCHB
C
C Th Th+SCH MCP-1 β-actin 400 300 200 100 0 MCP-1 (pg/mL) 0 50 100 200 (nM) Thrombin Cont +SCHE
F
0 50 100 200 (nM) Thrombin (-) SCH Cont +SCH 0.4 0.3 0.2 0.1 0 OD590 nm 0 50 100 200 (nM) ThrombinG
100x (-) Thrombin SCH Thrombin + SCH 40x goat IgG 100 mm Thrombin * * * * * * * * * * 100 mmFigure 4
A
D
pAKT AKT Thrombin 0 30 60 120 240 720 min pAKT AKT pAKT AKT Thrombin + LY Thrombin + PD Thrombin + SCH Thrombin + SCH pP42/44 P42/44 pP42/44 P42/44 pP42/44 P42/44 pP38 P38B
C
MCP-1 300 250 200 150 100 50 0 (pg/mL) Th - + + + + + LY - - 1.2 2.5 5 10 IL-6 20 15 10 5 0 (pg/mL) 250 200 150 100 50 0 (pg/mL) MCP-1 IL-6 20 15 10 5 0 (pg/mL) Th - + + + + + LY - - 1.2 2.5 5 10 Th - + + + + +PD - - 1.2 2.5 5 10 Th - + + + + +PD - - 1.2 2.5 5 10E
0 50 100 200 (nM) Thrombin (-) LY PDF
0.4 0.3 0.2 0.1 0 OD590 nm 0 50 100 200 (nM) Thrombin Cont +LY +PD 100 mm * * * * * * * * * * * * * * * * * * * 0 30 60 120 240 720 min 0 30 60 120 240 720 min 0 30 60 120 240 720 min 0 30 60 120 240 720 min Thrombin 0 30 60 120 240 720 min Thrombin 0 30 60 120 240 720 minFigure 5
A
B
pAKT AKT pP42/44 P42/44 β-actin Thrombin + LY 0 30 60 120 240 720 Thrombin + PD 0 30 60 120 240 720 min Thrombin PAR-1 Gq TF VII VIIa X Xa II PI3K AKT pAKT p MEK MEK Tissue factorMCP-1 MCSF IL-6 PAI-1 RAW264 migration MC3T3Figure 6
A
HEMajor fracture
Minor fracture
Control
Safranin O Alizarin red Alcian blue ALP TRACP
B
C
D
E
F
100 mmFigure 7
A
ThrombinMajor fracture
Minor fracture
Control
PAR-1