トップページ - 横浜国立大学学術情報リポジトリ
22
0
0
全文
(2) . international production linkages, we make an. has the special advantage of taking account of. analysis of international input-output tables,. intermediate inputs and backward linkages from. taking into account the activities of Japanese. a macroeconomic point of view. In particular,. multinationals in China, and we examine. the analysis is ver y useful in examining. the production-inducing ef fects of Japanese. international production linkages. For example,. multinationals on the Chinese economy. . Hasebe(2002)analysed the independence. Fur thermore, the implication of increasing. of production between East Asian countries,. international production linkages promoted. based on the Asian International Input-Output. by the activities of Japanese multinationals in. Table(1985, 1990, and 1995). Takagawa and. China is investigated from the viewpoint of. Okada(2004)developed the analysis of the. the production and transaction processes of. interdependence of the Asian-Pacific economy. Japanese multinational firms. In this regard, the. on the basis of the Asian International Input-. following three points are specifically addressed.. Output Table(2000)which they originally. Firstly, we investigate the diversity and evolution. estimated. Many researchers have analysed. of the activities of Japanese multinationals in. the impact of Japanese multinationals on. different industries in China in different periods.. the Chinese economy, but research based. Many researchers have analysed the positive. on the inter national input-output analysis. impact of FDI on the Chinese economy both. has not been developed suf ficiently. In this. theoretically and empirically.1) However, there. situation, Yamada’ s studies are considered. are few studies on the industrial specificities. as pioneering ones to analyse the activities of. of Japanese FDI. In this paper we analyse. Japanese multinationals in the framework of the. the dynamic ef fects of Japanese FDI and the. international input-output analysis(Yamada. activities of Japanese multinationals on the. (2001),(2002)and(2004)) .2) In this paper, we. Chinese economy, especially focusing on their. will analyse changes in the impacts of Japanese. industrial specificities. Furthermore, we analyse. multinationals on the Chinese economy on. different patterns which Japanese FDI exhibited. the basis of a comparison between the Asian. before and after the East Asian crisis.. Inter national Input-Output Tables for 1995. Secondly, we undertake an input-output analysis to investigate the inter national production linkages between Japanese multinationals and the Chinese economy. The input-output analysis. 1)For example, Huang(2001)suggested that FDI induced economic growth in China, introducing advanced operation and management practices. Liu and Song(1997)argued that FDI promoted economic growth in China via its influence on demand and supply conditions as well as firm strategies. Zhang(1999)and Sun(1998)found bidirectional causation between FDI and economic growth, and Zhang(2001)showed that the impact of FDI on growth increased in China.. 2)Yamada(2001)analysed the interdependence between the Japanese, Asian and US economies and the impact of Japanese multinationals on the Asian and US economies, based on the Asian International Input-Output Table for 1990, and Yamada(2002) also carried out significant research to recompile the US-Japan International Input-Output Table into three parts: Japan, US, and Japanese multinationals, and to analyse their interdependence. Yamada(2004) r e c o m p i l e d t h e Asian International Input-Output Table for 1995 and analysed the interdependence between Japanese overseas activities, the Japanese, Asian and US economies. Wang(2004)analysed the impact of the activities of Japanese multinationals on the Chinese economy, following the theoretical framework developed by Yamada..
(3) . and 2000, following the theoretical framework. processes of Japanese multinationals in the. developed by Yamada.. different manufacturing industries in the process. Thirdly, the implications of structural changes in international production linkages are explored by analysing the behaviours and organizations of Japanese firms in the manufacturing sector.3) Especially as for Japanese multinationals in the electrical machiner y and transpor tation. of economic integration(Isogai, Ebizuka and Uemura(2000) , Uemura(2004) . 2.Japanese FDI and the Activities of Japanese Multinationals in China. 2.1 Historical Trend of Japanese FDI in China. equipment industries in China, Fujimoto and. First of all, we will over view the historical. Shintaku(2005)emphasised that the impacts of. trend of Japanese FDI in the different industries. the “modularisation” of components in products on. in China in recent years. As FDI is influenced. the local procurement of Japanese multinationals. very much by financial conditions, Japanese FDI. are different between these industries. In this. was af fected by the East Asian crisis in 1997. paper we discuss recent str uctural changes. and 1998. In particular, it has shown different. in inter national production linkages which. patter ns in the dif ferent industries before. are promoted by the activities of Japanese. and after the East Asian crisis. The different. multinationals in China from such aspects as. patterns of Japanese FDI are shown in FIGURE. the evolution of production and transaction. 1a, FIGURE1b and FIGURE1c. 4). 3)For example, Kiyota, Matsumura, Urata and Wei(2005)examined the determinants of backward linkages of Japanese overseas affiliates, focusing on local procurements, and found that the length of operation had positive impacts on the local procurements of the af filiates in Asian counties. Fur thermore, it is suggested that the greater local sales orientation leads to the higher local procurements in the textile, general machinery, electrical machinery and transportation machinery industries.. As we can see in FIGURE 1a-c, Japanese FDI has fluctuated very largely in the manufacturing industry since the late 1980s. In fact, it increased. 4)The data are from the Ministr y of Finance, Foreign Direct Investment. This data is reportingbased, and is often larger than the actual amount of Japanese FDI. In Figure 1a, Hong Kong is excluded in the data of China even after 1997..
(4) . very much in 1994 and 1995, when the Japanese. of Japanese FDI is seen in transpor tation. economy was faced with an appreciation of. equipment, and this explains the considerable. the yen. In particular, Japanese FDI increased. par t of the increase in Japanese FDI in the. ver y remarkably in electrical machiner y and. manufacturing sector in China after 2000.. transportation equipment in the manufacturing. Japanese FDI in electrical machiner y star ted. sector and commerce and real estate in the non-. to recover in 2000, but dropped in 2002, being. manufacturing sector. When the East Asian. influenced by the recession in the electrical. crisis occurred in 1997 and 1998, Japanese FDI. machinery industry. In the non-manufacturing. declined very sharply in most of the industries.. sector, the recover y in commerce was also. The number of new projects approved in each. ver y remarkable from 2003, but Japanese. year continued to decrease, and the contracted. FDI has remained at a low level in other non-. FDI became lower than that in the early. manufacturing industries.. 1990s. Especially, Japanese FDI dropped very dramatically in real estate and commerce,. 2.2 Activities of Japanese Multinationals in China. because it was influenced very much by difficult. The sales activities of Japanese overseas. financial conditions in the East Asian crisis.. affiliates in China are examined below.5) The. Japanese FDI star ted to recover in the. sales of Japanese overseas af filiates slowed. manufacturing sector in 2000, and it has continued. after the East Asian crisis, but they started to. to grow since then. The remarkable growth. recover soon after, as seen in FIGURE 2a. If.
(5) . we include the sales in Hong Kong in the data,. East Asian crisis. The sales of iron and steel. the slow down was more severe in the Asian. as well as textile have stayed at a low level.. economic crisis because of a decrease in the. Commerce dropped in 1999, as it was influenced. non-manufacturing sector in Hong Kong in the. by the East Asian crisis. Electrical machinery. East Asian crisis. The trends of the sales of. was not af fected so much by the East Asian. Japanese overseas af filiates are diversified in. crisis, but it dropped very sharply in 2001 and. different industries in China, as seen in FIGURE. 2002, influenced by the collapse of the IT boom.. 2b. The sales of transportation equipment have been growing continuously since the mid-1990s,. 2.3 Profitability of Japanese Multinationals in China. supported by the expansion of Chinese domestic. Behind the large fluctuation of Japanese FDI,. demand which was not affected so much by the. there have been changes in the profitability of Japanese overseas affiliates in China since the. 5)We use the METI, Basic Survey on Overseas Business Activities . We can have data on the sales in China excluding Hong Kong, but we cannot have the data on the current profits/sales ratio and the procurement ratio of Japanese overseas affiliates in China.. mid-1990s. The diversified trends of the current profit/sales ratio of Japanese overseas affiliates in the different industries in China are shown in FIGURE 3. The current profit-sales ratios of Japanese.
(6) . overseas af filiates decreased ver y sharply in. The high and stable local procurement ratio of. iron and steel in the manufacturing sector as. transpor tation equipment is ver y impressive.. well as services in the non-manufacturing sector. On the contrary, there has been a remarkable. in the East Asian crisis in1997 and 1998. On. change in the local pr ocur ement ratio in. the contrar y, the current profit-sales ratio of. electrical machiner y since the middle of the. Japanese overseas af filiates in transpor tation. 1990s. In fact, the local procurement ratio of. equipment was relatively stable in the late 1990s,. Japanese overseas af filiates in transpor tation. and grew remarkably in the early 2000s. In. equipment was 43.3%, while that in electrical. electrical machiner y, the current profit-sales. machiner y was 18.7% in 1995. Therefore,. ratio rose in 1999, but was stagnant because of. there was a very big gap of local procurements. the IT recession at the beginning of the 2000s.. between those two industries in the middle of the 1990s. However, the local procurement. 2.4 Local Procurements of Japanese. ratio has gradually increased in the electrical. Multinationals in China. machiner y industr y in recent ten years, and. Local procurement is one of the most. the gap has disappeared completely. Behind. impor tant factors to promote inter national. this change in the production and transaction. production linkages and the transformation of. processes of Japanese electrical machiner y. the“value-chain”of production and transaction. firms, there seems to be the transformation of. processes. Local procurement ratio is defined. “value chains”in those firms and the growth of. as the share of local intermediate inputs to total. Chinese suppliers. Especially, the“modularisation”. costs. The local procurement ratios of Japanese. of components in products promoted the open. overseas af filiates in China have gradually. procurements of electrical machinery firms, and. increased in recent years, but there are also. that this also increased the local procurement of. diversified trends in the different industries, as. Japanese multinationals in the electrical machinery. shown in TABLE 1 and FIGURE 4.. industry in China(Fujimoto and Shintaku(2005) ).. The local procurement ratios of Japanese. The local procurement ratio of Japanese overseas. overseas affiliates in machinery and transportation. affiliates in textiles also increased rapidly in the. equipment were relatively high in 1995, and they. second half of the 1990s. Then, the ratio fell in. have been increasing gradually at a high level.. 2000, and recovered a little from 2000 to 2002. The.
(7) . local procurement ratio of Japanese overseas. We will see what industries Japanese overseas. affiliates in iron and steel has been gradually. affiliates procure components and materials from. decreasing with some fluctuations. This is. in Section 4, in which we will investigate the input. rather exceptional to the increasing trend of the. coef ficients of Japanese overseas af filiates in. local procurement ratios in the manufacturing. different industries in the manufacturing sector in. industries.. China..
(8) . FIGURE 4 Local Procurement Ratios % 80.0. Iron and steel Machinery Electrical Machinery Transportation Equipment Textile. 70.0 60.0 50.0 40.0 30.0 20.0 10.0 0.0 1995. 1996. 1997. 1998. 1999. 2000. 2001. 2002. Source: MET I, Basic Survey on Overseas Business Activities. 3.International Production Linkage of Japanese Multinationals in China: An InputOutput Analysis. input-output table consisting of three par ts: China, JMNs, and Japan. This basic framework of recompilation procedures was originally. 3.1 Recompilation of the China-Japan Input-. developed by Yamada(2002). The main. Output Table. procedures of recompilation are summarized as. A. Recompilation Procedure. follows(also Figure 5).. The input-output analysis has the special advantage of taking account of intermediate inputs and backward linkages from the viewpoint of macroeconomic input-output structures. In par ticular, an international input-output table describes the interdependent str uctures of transactions between industries among particular countries. In order to analyse structural changes. (1)Compilation of 16-sector I-O of JMNs for 1995 (2)Estimation of Input-output str uctures of JMNs (3)Estimation of value added str uctures of JMNs (4)Estimation of inter national freight and insurance of JMNs. in international production linkages, we recompile. (5)Compilation of export vectors of JMNs. the China-Japan international input-output table. (6)Recompiling the I-O table and re-adjustment. into three parts: China, Japanese multinationals. In FIGURE 5, the first column of the recompiled. (JMNs)and Japan, and make a comparative. China-JMNs-Japan I-O table shows the input. analysis of the input-output tables for 1995 and. structure of each industrial sector in China. The. 2000. We analyse changed in the impact of the. second column shows the input structure of each. activities of JMNs on interdependence between. industrial sector in JMNs. The third column. the Chinese and Japanese economies before and. shows the input str ucture of each industrial. after the East Asian crisis.. sector in Japan. The fourth and fifth columns. In the recompilation of the China-Japan. show the final demands fr om China and. Inter national Input-Output Table to include. Japan respectively. The sixth column shows. Japanese multinationals(JMNs), we extract. the expor ts from China, JMNs and Japan to. the inter mediate demand between China,. the rest of the world. The seventh column. JMNs, and Japan. Then, we formulate a new. is the statistical discrepancies generated in.
(9) . the process of recompiling the China-JMNsJapan I-O Table. More detailed recompilation procedures in our analysis are seen in the Appendix.. X irjs - the intermediate input of the product of sector i of countr y r (China JMNs or Japan)used by the industry j of country s (China, JMNs or Japan).. F ir s - the product of sector i of country r (China,. the rest of the world excluding country s (China, JMNs or Japan).. T rj TF r - the total import duty and tax vectors of country r (China, JMNs or Japan). V rj - the value added of sector i of countr y r. JMNs or Japan)used by the final demand of country s (China, JMNs or Japan). r E i - the export vector of country r to the rest of. X. r j. (China, JMNs or Japan). - the total input of industr y j of countr y r (China, JMNs or Japan).. the world excluding countr y s (China, JMNs or Japan). X ir - the total output of the sector i of country r (China, JMNs or Japan). r B j BF r - the international freight and insurance. B. Data Sources The Asian International Input-Output Table : The China-Japan I-O tables(1985, 1990, 1995. costs of country r (China, JMNs or Japan). and 2000)can be obtained from the Asian International Input-Output Table by Institute of. deducted from intermediate inputs and. Developing Economies(IDE)in Japan. M E T I , Basic Survey on Overseas Business. final demand. r C j CF r - the impor t vectors of intermediate. Activities : This sur vey is the most commonly. input and final demand of country r from. cited statistics on the activities of Japanese.
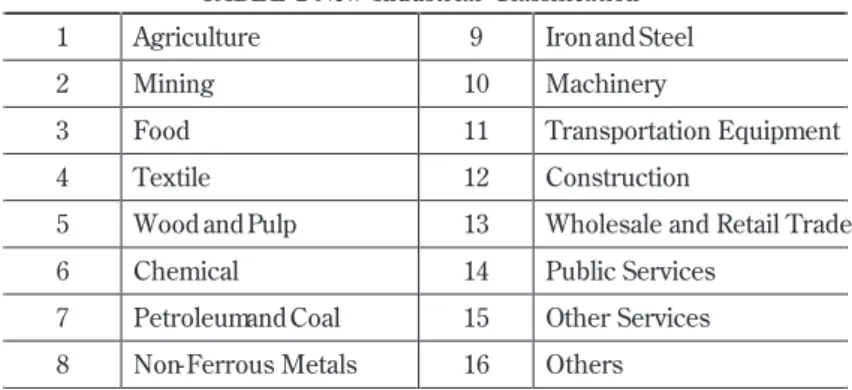
(10) . TABLE 2 New Industrial Classification. 1. Agriculture. 9. Iron and Steel. 2. Mining. 10. Machinery. 3. Food. 11. Transportation Equipment. 4. Textile. 12. Construction. 5. Wood and Pulp. 13. Wholesale and Retail Trade. 6. Chemical. 14. Public Services. 7. Petroleumand Coal. 15. Other Services. 8. Non-Ferrous Metals. 16. Others. overseas affiliates. The Ministr y of Economy,. i.e., local Chinese firms, JMNs themselves or. Trade and Industry(METI)provides the data. the multinationals in China. 3.2. Industrial Classification. of investment position, sales, procurements and profits of Japanese overseas af filiates by industry and host region.6). In the METI, Basic Survey on Overseas Business Activities , the data on the activities of Japanese. J A S M E , Survey on Activities of Japanese Small and Medium Enterprises in China :. overseas affiliates are aggregated into twelve. JASME(Japan Finance Corporation for Small. industries in non-manufacturing sector. METI’. and Medium Enterprise)conducts a survey of. s survey provides the data of 18 sectors, and the. Japanese business activities in China from 2000.. Asian International Input-Output Table(2000). The data covers JASME’ s 903 clients in China. provided by Takagawa and Okada(2004)has. in 14 manufacturing and 3 non-manufacturing. 19 sectors(electrical machinery is included into. industries. Compared with METI’s sur vey,. “machinery”). Therefore, we use the 16-sector. the coverage and reliability might have a. classification here. The original China-Japan I-O. problem, but JASME survey gives us important. tables(1995)have 78 sectors and 19 sectors,. information on intermediate input relations. but we have to integrate them into a 16 sectors. between JMNs in China by industries. This data. in our analysis.7) TABLE 2 shows the sector. provides us with where the inputs come from,. classification of our new I-O tables.. 6)The response rates of METI’ s survey are about 60%, which is a limitation of the data. In fact, the response rate was 60.4% in 1995 and 62.9% in 2000. 7 In the input-output analysis in this paper,. industries in the manufacturing sector and six. 7)In the input-output analysis in this paper,“electrical machinery”is not classified as an independent sector, but it is included in“machinery”, because we use the Asian International Input-Output Table :24 Sectors (2000). We will make another input-output analysis, setting“electrical machiner y”as a sector in the classification on the basis of the Asian International Input-Output Table :78 Sectors (2000)..
(11) . 3.3. Theoretical Framework of International Input-. also be rewritten as follows.. output Analysis. In our study, we use the theoretical framework. (4). of input-output analysis which was originally developed by Yamada(2001, 2002)so that we. Thus, with equation(4), we can investigate. can illustrate how production in the Chinese. how much production is induced by a unit. economy is pr omoted by the pr oduction. change in final goods supply in different sectors.. activities of JMNs which are located in China. We construct an International I-O Table with. 3.4. Results of the Analysis. three parts: China, JMNs, and Japan, using the. A. Share of JMNs in Production in each Industry. following notations, X 1: Chinese production. in China. X 2: the pr oduction of JMNs, X 3: Japanese production.. A typical input-output model with. these three parts can be written as follows.. Before performing the input-output analysis, we report the relative share of JMNs in production in each industry in China in 1995 and 2000. The production of JMNs increased ver y rapidly in. (1). China during the 1990s. Accordingly, the share of JMNs has risen continuously, although the. Where,. A. 12. ,. A. 22. ,. A. 32. represent the input. Chinese economy has achieved rapid economic. coefficient matrices of JMNs, A 21X 1, A 22X 2, A 23X 3. growth at the same time.. represent the sales of intermediate goods of. As we can see in TABLE 3, the share of JMNs. JMNs respectively. F 21 represents the sales of. in production shows a large increase from 0.43%,. final goods of JMNs in Chinese markets,. F. 23. 2.20%, 2.83%, 0.77% to 0.74%, 3.81%, 4.00%, 2.47%. represents the export of final goods from JMNs. in the textile, machiner y, and transpor tation. to Japan, and E 2 represents the export of final. equipment, wholesale and retail trade industries,. goods of JMNs to the other countries.. respectively. Therefore, production in those industries in China has been promoted ver y. Equation(1)can be rewritten as follows.. much by Japanese FDI in China. Especially, the share of JMNs in production in the transportation (2). equipment industry increased very much from 1995 to 2000, supported by the vigorous FDI of JMNs with increasing profitability which was. (3). seen in Section 2. Therefore, Japanese FDI has acquired greater importance in the machiner y. Note that the final demand is described as. and transportation equipment industries in China. follows,. recently. On the contrar y, shares increased relatively little from 0.56%, 0.29% to 0.69%, 0.49% in the chemical, iron and steel industries, respectively.. F C denotes the supply of final goods by China, F M. denotes the supply of final goods by JMNs, and. B. Induced Production by Unit Change in Final. F J denotes the supply of final goods by Japan. With newly defined, F C , F M , F J equation(3)can. Goods Production Production in the Chinese industries is induced.
(12) . by an increase in final goods production of JMNs. in 1995, a unit increase in the final goods. in China, which is driven by the demand for the. production of JMNs in iron and steel, food,. products of JMNs in each industry in China. To. chemical, non-ferrous metals, wood and pulp,. investigate the production-inducing effect by a. and transportation equipment had a significant. unit change in the final goods production of JMNs. impact on the Chinese economy, with the values. in different industries in China, we calculate the. of 1.45, 1.27, 1.21, 0.96, 0.88 and 0.67 units,. “Leontief inverse”of the input matrices of the. respectively. The production-inducing ef fects. China-JMNs-Japan I-O tables for 1995 and 2000. In. of JMNs in machinery and textile were limited. particular, we analyse coefficients in the Leontief. and one unit increase in final goods production. inverse matrices for 1995 and 2000, which are. of JMNs in these industries results in 0.26, and. shown in TABLE 4.. 0.24 units change, respectively.8) . In TABLE 4, FIGRE 6a and FIGURE 6b, we. Secondly, in 2000, a unit increase in the. can make the following obser vations. Firstly,. final goods production of JMNs in wood and.
(13) . TABLE 4 Subtotals of Column Values in the Leontief Inverse Matrix --Changes in Final Demand for JMNs--. Final Goods Production of JMNs. 1995 Food Textile Wood and Pulp Chemical Petroleum and Coal Non-Ferrous Metals Iron and Steel Machinery Transportation Equipment. CHINA 1.27 0.24 0.88 1.21 0.81 0.96 1.45 0.26 0.67. JMNs 1.03 1.02 1.03 1.05 1.01 1.09 1.04 1.03 1.06. JAPAN 0.08 0.99 0.47 0.06 0.01 0.35 0.06 0.64 0.94. CHINA. JMNs. JAPAN. Final Goods Production of JMNs. 2000 Food Textile Wood & Pulp Chemical Petroleum and Coal Non-Ferrous Metals Iron and Steel Machinery Transportation Equipment. pulp, and non-ferrous metals had a relatively. 0.91 0.81 1.24 0.88 0.91 1.22 0.51 0.69 0.81. 1.09 1.05 1.08 1.04 1.00 1.02 1.03 1.06 1.04. 0.02 0.52 0.19 0.43 0.17 0.29 0.72 0.62 0.90. became suf ficiently strong with the values. significant impact on China with the values. of 0.81, 0.81 and 0.69, respectively. Taking. of 1.24 and 1.22 units, r espectively. The. into account the considerable increase in the. production-inducing effects of JMNs in textile,. production of JMNs in the textile, transportation. transpor tation equipment, and machiner y. equipment, and machinery industries in China,.
(14) . their impact on China is great. On the contrary,. the ef fect slightly declined in transpor tation. the production-inducing effects of JMNs in iron. equipment from 1995 to 2000. The production-. and steel was small on China in 2000.. inducing ef fect decreased remarkably in the. Thir dly, JMNs in food, wood and pulp,. textile industry from 1995 to 2000. The effect on. petroleum and coal, and non-ferrous metals. exports from Japan to China, which is typically. with higher production-inducing ef fects on. seen in the transportation equipment industry,. China seem to have a cooperative purchasing. is often called“induced-export effect” . We will. r el at i on s hi p wi th local fir ms and str ong. investigate it in more detail in Section 4.10). backward linkages in China. The productioninducing ef fects of JMNs in machiner y and textile were very limited in 1995, and JMNs in. 4. Changes in International Production Linkages and Japanese Firms. those industries purchased a small amount of. 4.1 Investigation of Input Structures of Japanese. raw materials and components from local firms. Multinationals. in China. However, the production-inducing. In order to consider structural changes in. effects increased in machinery and textile from. inter national production linkages between. 1995 to 2000, that is, from 0.26, 0.24 to 0.48,. China, Japanese multinationals and Japan in the. 081, respectively. In other words, the backward. East Asian economic integration, we investigate. linkages of JMNs became much stronger in. thoroughly changes in input structures of JMNs,. machiner y and textile. On the contrar y, the. comparing the input coefficients of the three-. production-inducing effects on China decrease. part input-output tables for 1995 and 2000, which. in food, chemical, and iron and steel from 1995. is shown in TABLE 5. The input coefficients of. to 2000, that is, from 1.27, 1.21, 1.45 to 0.91, 0.88,. JMNs represent the structures of“value chain”. 0.51, respectively.. of production and transaction processes of. 9). Four thly, the production-inducing ef fects. Japanese multinational firms in China.. of JMNs in transpor tation equipment on the. Firstly, the input coefficients of JMNs in the. Japanese economy were ver y strong in both. textile industr y are relatively high from the. 1995 and 2000. This can be explained by the. agriculture, textile, chemical, and wholesale and. large amount of induced export of machiner y. retail industries in China. This shows that JMNs. goods and the components of transpor tation. in the textile industry purchase a large amount. equipment from Japan to China. However,. of materials from local material producers and traders in China. Furthermore, the input. 8)Wa n g(2004)a n a l y s e d t h e p r o d u c t i o n inducing effects of JMNs in China, recompiling the Asian International Input-Output Table(1995)with the sector classification of“electrical machiner y” as a industrial sector, and found that the productioninducing effects of JMNs in transportation equipment was much stronger than that in electrical machinery in 1995. 9)The operation of JMNs was very preliminary in both chemical, and iron and steel in 1995, and this seems to be reflected in the sharp decline in the production-inducing effects of JMNs on China.. coef ficients of JMNs in the textile industr y increased considerably from local firms in the textile industry and wholesale and retail traders in China from 1995 to 2000. Secondly, the input coefficients of JMNs in the iron and steel industr y from petroleum. 10)As for the explanation of“induced expor t effect” , see Yamada(2002)..
(15) . and coal, and machiner y industries in China. the iron and steel industry.. decreased very much from 1995 to 2000. On the. Thirdly, the change in the input coefficients. contrary, the input coefficients of JMNs in the. of JMNs in the machiner y industr y arouses. iron and steel industry were high from the iron. great interest, because it implies changes in the. and steel industry itself in both China and Japan.. behaviours and organizational architectures. The strong intra-industrial production linkages. of Japanese machiner y fir ms. The input. between firms are the remarkable specificity of. coefficients from the iron and steel, and machinery.
(16) . industries in China as well as those from the. The backward linkages of Japanese multinationals. iron and steel, and machinery in Japan increased. in the transportation equipment industry were. remarkably from 1995 to 2000. This is a change. much stronger than those in the electrical. in the input-output structures of JMNs in the. machiner y and textile industries in 1995.. machiner y industr y behind the increase in. Correspondingly, Japanese multinationals in the. their local procurements which we have seen in. transportation equipment industry had stronger. Section 2.. production-inducing ef fects on the Chinese. Four thly, the input coef ficients of JMNs in. economy. The production process is highly. the transportation equipment industry from the. integrated in the transpor tation equipment. iron and steel, machiner y, and transportation. industry, so production has been supported by. equipment, and wholesale and retail trade. subcontractors and related firms which not only. industries in China were ver y high and stable. remain in Japan but also transfer their plants. in both 1995 and 2000. The input coefficients of. to China. In the transpor tation equipment,. JMNs in the transportation equipment industry. e s p e c i a l l y, c a r i n d u s t r y, t h e p r o d u c t i o n. from JMNs within the same industr y became. process is not easily modularised, so Japanese. higher from 1995 to 2000, and this showed. multinational firms have kept the high and. that JMNs have been increasingly suppor ted. stable level of local procurements, supported by. by subcontractors or related firms which are. the activities of subcontractors which transfer. shifted to China.. It is also very important that. their plants to China. Furthermore, the market. the export of iron and steel as well as machinery. strategy of Japanese multinational firms was. goods from Japan to JMNs in China increased. “Chinese-market-oriented”in the transportation. very much from 1995 to 2000. This means that. equipment industr y, so they developed strong. the“induced export effect”of the operation and. ties with their subcontractors and local firms,. plant investment of JMNs has increased in the. suppor ted by the expansion of the Chinese. transportation equipment industry in China.. market and their high profitability which was seen in Section 2.. 4.2 Evolution of Japanese Multinational Firms. In the machiner y, especially, electrical. behind Increasing International Production. machiner y industr y, assembly lines were. Linkages. transferred to China, but a lot of the components. In order to understand structural changes in. were procured from their subcontractors or. international production linkages in the East. related firms in Japan in the mid-1990s. This. Asian economic integration, we investigate them. was caused by the specific characters of the. from the viewpoint of the industrial specificities. electrical machiner y industr y that production. of the“value chain”of production process as. and transaction processes are integrated into a. well as the behaviours of Japanese multinational. “vertical value chain”. However, the design. firms. The interpretation of the changes in international production linkages of Japanese multinationals is given from the viewpoint of the institutional analysis of the Japanese firm system.11)The summary of the analysis is shown in TABLE 6.. 11)As for relevant researches on the Japanese firm as a system, see Aoki and Dore(1994). Aoki (2001)also summarizes the recent development of the theoretical framework of“comparative institutional analysis”..
(17) . TABLE 6 Interpretation of International Production Linkages -From the Institutional Point of View-. Japanese Multinationals (JMNs) in China Machinery (especially Textile Iron and Steel Electrical Machiner y) Increasing local Low local Increasing local procurements, the procurements, and procurements and increasing purchase of decreasing production- production-inducing effects CHINA materials from from the late 1990s inducing effect agriculture and commercial sectors Backward Linkages. Purchasing materials from JMNs JMNs within the textile industry Decreasing procurements from JAPAN domestic plants in Japan Spinning and manufacturing Industrial processes depend Specificities of on low wage Institutional workers Architectures. Purchasing materials Increasing open from JMNs within the procurements and weakened iron and steel industry production linkages between JMNs Little import of Import of components from manufactured goods related firms in Japan from Japan The process industry with big centralized plants. Increasing modularization of products, but some integrated production processes remain. Export market-oriented originally, but increasingly Chinese market oriented. Transportation Equipment Profitable operation with high local procurements and strong productioninducing effects Transfer of subcontractors' plants to China. Induced-export effect from Japanese subcontractors and steel producers Integrated production process with subcontractor networks (Just-in-time), Chinese market-oriented. rules of electrical products, for example, PC and. in China.13). VTR, have been“modularised”in the 1990s.12). On the contrar y, in Japan, the creation of. Accordingly, the local procurements of Japanese. value added has been diminished very much in. multinationals in the electrical machiner y. the manufacturing and assembly processes in. industr y have rapidly increased in China,. electrical machiner y plants, and business has. and this has produced stronger production-. been shifted to the design department as well as. promoting effects and has created more value-. the solution department in Japan. Accordingly,. added in the Chinese manufacturing industr y.. the decrease in value added creation in the. As for the behaviour of electrical machiner y. manufacturing and assembly processes in the. firms, the market strategy of those firms was. “value chain”causes the restructuring of firm. “export-oriented”in the mid-1990s, but it has. organisation and a reduction in manufacturing. been shifted gradually to“Chinese-market-. workers in electrical machinery firms in Japan.14). oriented”recently. This has also promoted the. In this sense, there is asymmetry in value-added. local procurements of electrical machinery firms. 12)As for the“architecture”of manufacturing firms in China, see Fujimoto and Shintaku (2005). The original idea of design r ules and “modularization”was presented by Baldwin and Clark(2000).. 13)As for the relationship between market strategy and local procurement, see Wang(2004), and Kiyota, Matsumura, Urata and Wei(2005). In our international input-output analysis, we don’ t check changes in the backward linkages of electrical machinery firms before and after the collapse of the IT boom because of the limitation of the data..
(18) . creation between electrical machiner y firms. multinationals in commerce dropped very much. in Japan and Japanese multinationals in China.. with a decrease in profitability in the East Asian. The creation of value added has decreased. crisis.. in manufacturing and assembly processes in. Secondly, international production linkages. Japan, while the manufacturing and assembly. have become deeper and wider, promoted by. plants of Japanese multinationals in China have. Japanese multinationals. In particular, the local. increasingly promoted the value-added creation. procurement ratios of Japanese multinationals have. in the Chinese manufacturing industry.. increased in China. The procurement ratios were. 5. Conclusions. high in the transportation equipment industr y in the mid-1990s, while they were ver y low in. As structural changes in international production. the electrical machinery and textile industries.. linkages in economic integration process are. However, the local procurement ratios have. caused by interactions between the behaviours. risen in those industries, and according to. of firms and the evolution of macroeconomic. our inter national input-output analysis, the. str uctures, we have analysed the changes,. intermediate inputs of Japanese multinationals. focusing on international input-output structures. from local firms have also increased in China.. and the production and transaction processes of. The production-inducing ef fect of Japanese. Japanese firms. The results of our analysis are. multinationals in the transportation equipment. summarised as follows.. industry was larger than that in the machinery. Firstly, Japanese FDI in China reached a. industr y in 1995, but the ef fect increased in. peak in the mid-1990s, and fell sharply in the. the machiner y industr y from 1995 to 2000.. East Asian crisis. Then, it recovered, and has. Namely, the backward linkages of Japanese. subsequently increased with different patterns. multinationals have increased considerably in. in dif ferent industries. Japanese FDI has. the machinery, especially electrical machinery,. fluctuated in the manufacturing sector, affected. industry in China behind the East Asia crisis.. by the East Asian crisis. Japanese FDI has. Thirdly, different backward linkages of Japanese. grown remarkably with high profitability in the. multinationals between different industries imply. transpor tation equipment industr y after the. the industrial specificities of“value chain”of. crisis. Japanese FDI in the electrical machinery. Japanese firms. The backward linkages of Japanese. industry also started to recover in 2000, but it. multinationals in the transportation equipment. dropped with the sharp decline in sales in the. industry were stronger than those in the electrical. collapse of the IT boom in 2002. In the non-. machiner y industr y in China in the mid-1990s.. manufacturing sector, the sales of Japanese. In the electrical machiner y industr y, assembly lines were shifted to China with the procurement of components from subcontractors in Japan,. 14)Uemura(2004)analyses the ef fects of changing value chains in electrical machiner y firms on the employment system on the basis of a questionnaire sur vey. The change also af fects the boundar y of firm in the electrical machiner y industry. As for the dynamic theory of the boundary of firm, see Langlois(1995).. because production processes were still vertically integrated. However, with the modularisation of electrical products, the local procurements of Japanese multinationals have rapidly increased in the electrical machiner y industr y. In the transportation equipment industr y, production.
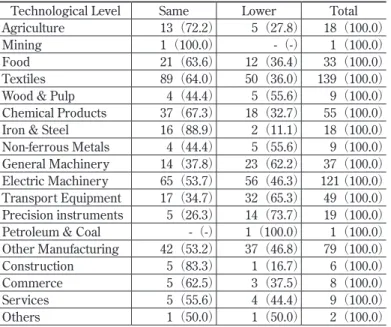
(19) . TABLE 8 Comparison of Technological Levels Between JMNs and Japan Technological Level Agriculture Mining Food Textiles Wood & Pulp Chemical Products Iron & Steel Non-ferrous Metals General Machinery Electric Machinery Transport Equipment Precision instruments Petroleum & Coal Other Manufacturing Construction Commerce Services Others. Same 13(72.2) 1(100.0) 21(63.6) 89(64.0) 4(44.4) 37(67.3) 16(88.9) 4(44.4) 14(37.8) 65(53.7) 17(34.7) 5(26.3) -(-) 42(53.2) 5(83.3) 5(62.5) 5(55.6) 1(50.0). Lower Total 5(27.8) 18(100.0) -(-) 1(100.0) 12(36.4) 33(100.0) 50(36.0) 139(100.0) 5(55.6) 9(100.0) 18(32.7) 55(100.0) 2(11.1) 18(100.0) 5(55.6) 9(100.0) 23(62.2) 37(100.0) 56(46.3) 121(100.0) 32(65.3) 49(100.0) 14(73.7) 19(100.0) 1(100.0) 1(100.0) 37(46.8) 79(100.0) 1(16.7) 6(100.0) 3(37.5) 8(100.0) 4(44.4) 9(100.0) 1(50.0) 2(100.0). Source: METI, The 26th Basic Survey on Overseas Business Activities(1998). processes have continued to be integrated, so. China or Japan depends on the technological level. the level of local procurements has been stable. of JMNs. Here, a survey of the technological level. with the shift of Japanese subcontractors’plants. of JMNs in China by sectors from the 26th METI. to China. International production linkages. sur vey will be used as our empirical evidence.. will be stronger, promoted by the activities of. TABLE 8 is the technological level sur vey by. Japanese multinationals. This will determine. METI. For JMNs whose technological levels are. the evolution of the production and transaction. shown to be the same as Japan, the coefficient of. processes of Japanese firms as well as the. the corresponding sector of Japan is used, while. growth pattern of the Chinese manufacturing. the coefficient of China is used for the rest of the. industry in the process of economic integration. sectors. . in East Asia. Appendix. Step 2: Estimation of the Value Added Coefficients of JMNs. The detailed procedure of recompiling the China-. In this research, the value added coefficient. Japan Input-output table is as follows.. of each sector is based on the new estimated. Step 1: Estimation of the Total Input Values of JMNs. input coefficient. The value added coefficient. For JMNs in China, total inputs and value. of wood & pulp and iron & steel is adjusted by. added of each sector are estimated by multiplying. information from the METI data to make sure. production value by the coef ficient of the. the coverage of the firms more accurate, and. corresponding sector of China or Japan. Whether. these revised data are used in the recompilation. to use the coef ficient of corresponding sector of. work..
(20) Step 3: Estimation of the Inputs and Value Added. Step 6: Separation of Inputs from JMNs in Non-JMNs. Values of JMNs. Activities. For JMNs in China, total inputs and value added. China activities are composed of two, one for. of each sector are estimated by multiplying. JMNs and the other for non-JMNs according to. production value by the newly defined input. step 4. Input of non-JMNs still includes that from. coef ficient and value added coef ficient in the. JMNs, which should be separated. Input value. previous step. Then, with the procurement. from JMNs in China. ratios by region from the METI sur vey, we. = Intermediate Input Value from China ×. divide total input into three regions: China, Japan and ROW. The METI survey provides us. Local Sales Value of JMNs (────────────────) Input of China. the portion of purchases of raw materials, parts. Then, we estimate the sum of input values from. and semi-finished products, and merchandise. JMNs in China for each input category, and the. of each sector in the term of local procurement,. ratio of this to the corresponding sum of China.. impor ts from Japan and ROW. We estimate. The remaining input values are those for Non-. input values by multiplying total input by the. JMNs in China.. procurement ratio. Thereafter, we divide the input values into values by sector, using the. Step 7: Intermediate Input within JMNs. input coefficient estimated in step 1.. The METI sur vey provides data on local. 15). procurement, but it does not give us accurate Step 4: Separation of Activities of JMNs from China. data on transaction relations between JMNs. Subtracting the value of each input and value. in China by industries. In order to divide the. added of JMNs from the corresponding values. input from China by JMNs into two: that from. of China, we estimate the value of those of non-. the JMNs and from the non-JMNs in China, a. JMNs activities in China.. sur vey conducted by JASME in 2000 will be used in this research. Data for the year 1995 is. Step 5: Separation of Inputs from JMNs in Japan. unavailable. Even though there is a 5- year time. Inputs from China include those from JMNs. lag, we use this data as second best. Thereafter,. in China. We use the following equation for. we estimate the sum of input among JMNs for. separation. Input Value from JMNs in Japan. each input categor y, and the ratio of it to the. = Intermediate Input Value from China ×. corresponding sum.. Sales Value of JMNs to Japan (────────────────────) Export Value from China to Japan. Step 8: Final Demand of Japan. Then, we estimate the sum of input values from. Japanese final demand from China is divided. JMNs in China for each input category, and the. into two: that from JMNs and non-JMNs. We. ratio of this to the corresponding sum of China. 16) 15)For commerce, other ser vice and other industries, the result might be meaningless because of the definition and discrepancy. However, the main object of this paper is to analyze the economic impact of manufacturing sector. It will not matter so much.. 16)The METI survey provides a total sales statistics by sector composed of local sales, exports to Japan and expor ts to third countries. Unfor tunately, it doest not tell us whether these sales are of intermediate goods or final goods, so the exports vales are the sum of intermediate goods and final goods..
(21) . use the ratio of sales from JMNs to Japan to the. Asian Economic Development ( C h i c a g o :. China sales of final goods in China. We obtain. University of Chicago Press).. final demand from JMNs by multiplying this. Fujimoto, T. and J. Shintanku(eds.) (2005), The. ratio to the purchase from China for each sector.. Architecture-based Analysis of Chinese. Final demand from the non-JMNs in China is. Manufacturing Industries (Tokyo:. the subtraction of the value of JMNs from that of. Toyokeizaishinposha: in Japanese). Hasebe, Y.(2002),“Trade and Economic Growth in. China.. East Asia: The Analysis of Interdependence Step 9: Final Demand of China. by Asian International Input-Output Tables,. The Chinese domestic final demand is also. 1 9 8 5 - 9 0 - 9 5 ” , Yokohama Journal of Social. divided into two: that from JMNs and non-JMNs.. Sciences , Vol.7, No.3. pp1-21.. Here we estimate ratios of local sales of JMNs,. H u a n g , Y.(2001) , Selling China: Foreign Direct. after subtracting intermediate goods to China. Investment during the Reform Era ( N e w. sales of final goods in the same market. Using. York: Cambridge University Press).. these rations, we obtain appropriate values in. Isogai, A., A.Ebizuka, and H.Uemura(2000),. the same way as in Step 8.. “Hierarchical Market-Firm Nexus as the Japanese Mode of“Regualtion”, in Boyer, R.. Step 10: Export to the ROW. and Yamada, T.(eds.)Japanese Capitalism. Expor t to ROW is estimated; assuming that. in Crisis: A regulationist interpretation. JMNs’sales to the third countries are equal to. (London: Routledge).. it. Export from the non-JMNs in China is the. Kiyota, K., T.Matauura, S. Urata and Y. Wei(2005),. subtraction of the value of JMNs from the total. “Reconsidering Backwar d Linkage of. export of China.. Foreign Affiliates: Evidence from Japanese References. Aoki, M.(2001) , Towards A Comparative Institutional. Analysis (Massachusetts: The MIT Press). Aoki, M. and R. Dore(1994), The Japanese Firm (Oxford: Oxford University Press). Baldwin, C. and K. B. Clark(2000), Design Rules:. Multinationals”, RTETI Discussion Paper. Series , 05-E-019. Landesmann, M.A. and Scazzieri, R.(eds.)(1996),. Production and Economic Dynamics , Cambridge University Press. Langlois, R.N. and P.L.Riber tsin(1995), Firms,. Markets and Economic Change: A Dynamic. the Power of Modularity (Massachusetts:. Theory of Business Institutions ( L o n d o n :. The MIT Press).. Routledge).. Bayoumi, T, and G. Lipwor th(1998),“Japanese. L i u X . a n d H . S o n g(1997) ,“C h i n a a n d t h e. Foreign Direct Investment and Regional. Multinationals: A Winning Combination”,. Trade,”Journal of Asian Economics , 9(4),. Long Range Planning , Vol.30, No.1, pp.74-83.. pp.581-607. Belderbos, R., G. Capannelli, and K. Fukao(2000), “The Local Content of Japanese Electronics. Sun, H.(1998),“Macroeconomic Impact of Direct Foreign Investment in China: 1979-96,”The. World Economy , No.21, pp.675-694.. Manufacturing Operations in Asia”, in. Takagawa, I. and T. Okada(2004),“Input-Output. T. Ito and A.O.Kr ueger(eds.)The Role. Study in the Asia-Pacific Region: An Analysis. of Foreign Direct Investment in East. Based on a New Method for Updating Input.
(22) . Coef ficients,”The Bank of Japan Working. Paper , No.04-J-6. . Uemura, H.(2004),“’Selection and Focusing’ and the Employment System: An Analysis. (International Centre for the Study of East Asian Development) , No.2001-21. Yamada, M.(2002) ,“Overseas Production of Japanese Firms and Japan-US Interdependence: An. of Employment and Internal Labour Market. Input-Output Analysis” , Journal of Applied. with Changing Value Chains”, Tsur u,. Input-Output Analysis , Vol.8, December.. T.(ed.)The Selection and Focusing:. Yamada, M.(2004) ,“Japanese Overseas Production. An Empirical Analysis of Electronics and. within the Asian International Input-Output. Information Technology Firm in Japan (Tokyo: Yuhikaku: in Japanese). We i , Y. a n d X . L i u(2001) , Foreign Direct. Investment in China: Determinants and Impact (Cheltenham UK: Edward Elgar). W u , Y . ( 1 9 9 9 ), Foreign Direct Investment and. Economic Growth in China ( C h e l t e n h a m UK: Edward Elgar). Wang, J.(2004),“The Impact of the Japanese. Model: Japan, the US, and Asia,”The. Journal of Econometric Study of Northeast Asia , Vol.1, No.1. Zhang, K. H.(1999),“How Does FDI Interact with Economic Growth in a Large Developing Countr y? The Case of China”, Economic. Systems , Vol. 21, No.4, pp.291-304. Zhang, K. H.(2001), “ What Attracts Foreign Multinational Corporations to China?”. Multinationals in China ― An Input-Out. Contemporar y Economic Policy , Vol. 19,. Study ―. No.3, pp. 336-346.. ”, Yokohama Journal of Social. Sciences , Vol.9, No.2. Wang, J.(2005),“The Impact of the Japanese. Zhang, Y-X.(1997) ,“Compilation of 1990 China Input-Output Table for China-Japan Bilateral. Multinationals - A Study on Local-. I-O Table”, V.R.F . Series, No.302, Institute of. International Linkages in China-”,(PhD. Developing Economics.. Theses, Yokohama National University). Yamada, M.(2001),“The Interdependence of Japan-US-Asian Economies and Japanese Firms: An Analysis by Asian International Input-Output Table”, Working Paper Series. (Jian Wang : Ph, D. Yokohama National University, Citizen Watch Co., Ltd., Japan) (Hiroyasu Uemura : International Graduate School of Social Sciences, Yokohama National University).
(23)
図

関連したドキュメント
In this, the first ever in-depth study of the econometric practice of nonaca- demic economists, I analyse the way economists in business and government currently approach
The approach based on the strangeness index includes un- determined solution components but requires a number of constant rank conditions, whereas the approach based on
Analogs of this theorem were proved by Roitberg for nonregular elliptic boundary- value problems and for general elliptic systems of differential equations, the mod- ified scale of
“Breuil-M´ezard conjecture and modularity lifting for potentially semistable deformations after
Then it follows immediately from a suitable version of “Hensel’s Lemma” [cf., e.g., the argument of [4], Lemma 2.1] that S may be obtained, as the notation suggests, as the m A
Correspondingly, the limiting sequence of metric spaces has a surpris- ingly simple description as a collection of random real trees (given below) in which certain pairs of
[Mag3] , Painlev´ e-type differential equations for the recurrence coefficients of semi- classical orthogonal polynomials, J. Zaslavsky , Asymptotic expansions of ratios of
Tanaka; On the existence of multiple solutions of the boundary value problem for nonlinear second order differential equations, Nonlinear Anal., 56 (2004), 919-935..
