東京農大農学集報 論 文 ῌ ῍ ῎ῌ ῌ ῍ ῎ ῌ ῌ ῍῍῍῍῍῍῍῍῍῍῍῍῍῍῍῍῍῍῍῍῍῍῍ ῌ ῌ Articles HIFERAW OLDEN HAN DEMOLA
(Received February , /Accepted January , )
* Department of Agricultural Engineering, Graduate school of Agriculture, Tokyo University of Agriculture
** Faculty of Regional Environment Science, Department of Bioproduction and Environment Engineering, Tokyo University of Agriculture
ARA UZUKI ATANABE
HIMADA OYODA
tor employs of the labor force (S and H , agricultural deficit and explains the problem of poverty
: Landscape degradation by soil erosion has increased considerably in Ethiopian lands due to deforestation of natural mountain forests and the cultivation of large areas, resulting in a serious threat to the Ethiopian population. In fact, soil erosion and nutrient depletion, drought and famine have frequently occurred in Ethiopia. Most of the productive topsoil has been degraded, resulting in chronic food shortage and persistent poverty. Soil erosion is a major environmental problem threat-ening the sustainability of agriculture. The purpose of this study is to establish spatial information of soil erosion risk at East Shewa Zone, Oromia Region in Ethiopia by conducting the integration of the Universal Soil Loss Equation (USLE) using Geographic Information System. Precipitation, topo-graphic, soil data, and land use data were obtained from USGS records and from Ethiopian govern-mental o ces and put into a spatial database using GIS. The factors that influence soil erosion are rainfall erosivitiy ( ) obtained from the precipitation database, soil erodibility ( ) obtained from the soil database, slope length and steepness ( ) obtained from the topographic database, while crop and management ( ) and conservation supporting practices ( ) were obtained from the land use database. The erosion analysis through USLE applied on GIS show that most of the lands is East Shewa zone ( ) are under high, very high, severe or very severe erosion and are covered mainly by cultivation, shrublands and grasslands. These lands essentially prone to erosion are located mostly in the north-east, center and south-west of the study area. This study presents the evidence for erosive areas repeatedly cultivated or frequently suggested for grazing such as shrublands and grasslands as is the case of most areas in East Shewa.
: Soil erosion, Land cover, GIS, USLE, Ethiopia
land vulnerable to degradation. The latter is exacer-bated by population pressures that have led to farming According to FAO ( ), the average annual agricul- new marginal areas not suited to agriculture. In Ethio-tural growth rate in Ethiopia is . , while the average pia, cultivation on steep slopes and clearing of vegeta-annual population growth rate is . . This shows the tion has accelerated erosion in the highlands (B
).
in Ethiopia. Decrease in agricultural productivity is A ( ) reported that Ethiopia loses over due to many reasons : frequent drought and also land . billion tons of topsoil per year by erosion. However, degradation. In fact, land degradation is a serious Ethiopia’s economy is mainly based on small-scale agri-threat for the environment and socio economic situa- culture, which represents the principal engine of eco-tion for rural populaeco-tion in many countries in the nomic growth.
world and particularly in Ethiopia. Accounting for half of the GDP, the agriculture sec-The undulating topography and heavy rainfall make
By
Anissa G
*, Shinji S
**, Fumio W
**,
Sawahiko S
** and Hiromichi T
**
R K LS C P et al. Summary
.
Introduction
Soil Erosion Assessment Using USLE
in East Shewa, Ethiopia
Key words /0 + + 2 ,*++ ,/ ,*+* ,+ ,*++ 2/ $ 2, ,**-, . - , +322 ,**2 + /
+
῍ ῌ ῍ ῌ ῌ ῌ ῌ ῌ ῌ EE ISCHMEIER MITH
Showa zone in center Ethiopia, including part of Oromiya water harvesting constructions. Soil erosion can be
lim-considered as main models used by United States -where
represents elevations ranging from , to , m a.s.l. ).
In East Shewa in Ethiopia, the farmers are producing for subsistence and facing an increasing erosion of the land. In fact, to satisfy their needs in food they are ploughing in marginal areas at slope lands. They cut trees in mountains and cultivate cultural vegetation.
Nevertheless, soil and water resources degradation advanced by natural and anthropologic activities are usually controlled by soil conservation techniques and
ited with proper management of vegetation, plant res-idue and tillage (L , ). That is why it is useful to assess physically and then estimate financially the ad-vantage that can be procured by conservation prac-tices in increasing the farmer’s benefits and preventing erosion, in zones under desertification threat. It is im-portant to demonstrate and explain how environment degradation could lead to socioeconomic deficiency.
Therefore, it is essential first to establish a GIS (geo-graphic information system) method for spatial distri-bution of soil erosion, based on the USLE (Universal Soil Loss Equation). Thus, areas su ering from soil erosion were assessed and mapped. This represents the
objective of the current article focusing on all East Location map of the study area of East Shewa Shewa zone. GIS provided detailed and accurate land
data information which contributes to improving
sta-tistical and up-dated analysis results of area frame to define the boundaries of the study area. Then, we study. In fact, GIS provides national institutions with applied the integration of GIS with USLE Model. a standardized and multi-purpose product useful for
several environmental and agricultural purposes.
Fur-thermore USLE is an erosion model and one of the Arc GIS . software was used to integrate data and most widely used methods for predicting soil loss that obtain topographic maps of slope and elevation. In ad-would result from splash, sheet, and rill erosion occurr- dition, a GIS Arc-View . Software was used to inte-ing in agricultural plots. grate data and various maps and o cial censuses of soil, rainfall and land-use obtained from Ethiopian gov-ernmental o ces records ( ).
USLE (Universal Soil Loss Equation) is a mathemat-In this research, we carried out a field survey of East ical model used to describe soil erosion processes. The USLE and its derivatives (i.e. RUSLE and MUSLE) are Region (Fig. ). The study area is about , . km .
According to FAO ( ), annual average temperature it originated- and around the world to measure water ranges from to . Average annual precipitation erosion. This is why the model has been used for dec-ranges from to mm. The topography of the area ades for purposes of conservation planning. The USLE is a multiple-factor equation (Eq. ) in which four non The landscape of the study area is harshly undulating dimensional parameters ( ) are used to modify with sparse vegetation and highly covered with stones. a potential soil loss equal to the product of two dimen-In fact East Shewa Zone is located at the Great Rift sional parameters which respectively represent the ero-Valley. The agricultural productions are mainly te , sivity of rainfall ( ) and the erodibility of a particular barley, sorghum maize, cafe, haricot beans, fruit trees soil ( ). The USLE has the following form as defined such as mango, papaya, etc. The major soil types are by W and S ( ) :
andosols, lithosols, cambisols, luvisols and fluvisols. A
(Eq. ) topographic map of East Shewa was used as input map
L, S, C, P R K A R K L S C P Fig. Model Description
Study Site overview
.
Methodology
, + /** , .** +333 ,**. # 3 , -$ $ ,**/ + +, ,.2 0 ,**-,* ,2 0** 3** + # ÿ +312 + +,
῏ ῏ ῏ ῏ ῏ ῏ ῏ ῏ ῏ ῐ ῌ ῎ ῎ ῍ ῑ ῐ ῐ ῏ ῎ ῌ ῌ ῎ ῍ ῏ ῐ ῐ ῌ῍ ῍ ῐ ῐῑῌ ῏ ῒ῎ ῎ OORE RUCH ENARD REIMUND OUMIER MOLDUS ENARD REIMUND ISCHMEIER MITH OWMAN ISCHMEIER MITH . sin . sin . .
where : factors are typically combined together and defined as : soil loss (t ha yr ), the topographic factor which is a function of both the : rainfall erosivity factor (MJ mm ha h yr ) slope and length of the land. The topography a ects : soil erodibility factor (t h MJ mm ) the runo characteristics and transport processes of : slope length factor (unitless) sediment on a watershed scale. We obtained the topo-: slope steepness factor (unitless) graphic factor which is a function of both the slope : cover and management factor (unitless) steepness ( ) and the slope length ( ) of the land com-: support practice factor (unitless) bined together through ArcView . . We derived the The soil erosion distribution map was generated as a digital elevation model (DEM) data of the study area product of six vector layers. Each of the USLE factors, using the interaction between topography and flow with associated attribute data, was digitally encoded in accumulation (M and B , ). Flow accumu-Arc-view . database to create five thematic layers and lation in a raster-based analysis, is the total number of obtained maps respectively corresponding to these cells, including non-neighboring cells, that drain into a factors. Then, we made an overlay of these layers selected cell (GIS Glossary).
using USLE/GIS calculation and we obtained values of As for the factor, they were derived from (DEM) soil loss in t ha yr . using hydrological modeling which is an extension of
ArcView.
The factor was calculated as the following equa-tion :
Rainfall erosivity is the ability or power of rain to
(Eq ) cause soil loss. The factor is a function of the falling
raindrops and the rainfall intensity. The greater the
intensity and duration of the rain storm, the higher is Where is the slope length (m), is the angle of the the R factor and thus the higher is the erosion poten- slope in degrees, is an exponent that depends on the tial. Rainfall data were obtained from Ethiopian Minis- slope steepness. m was attributed the value of . for try of Agriculture ( ). slopes between and and attributed the value of
R and F ( ) developed statistical re- . for slopes . lationships between factor and both total annual
precipitation using a modified Fourier coe cient ( )
(F , ; A , ). The is calculated as : The factor is used to determine the relative e ec-tiveness of soil and crop management systems in terms of preventing soil loss. In fact, crop management factor (Eq. )
depends on vegetation cover, which dissipates the ki-R and F ( ) recommended to use the netic energy of the raindrops before impacting the soil equation below when is greater than mm, factor surface. Therefore, vegetation cover and cropping sys-is calculated as : tems have a large influence on runo and erosion rates. The values of factors were decided with the use of
. . . (Eq. )
land cover data described by W and S Where (mm) is average monthly precipitation, ( ).
(mm) is average annual precipitation. The factor is defined as the ratio of soil loss from land cropped under specified conditions to the corre-The soil erodibility factor is a measure of the suscep- sponding loss from clean-tilled continuous fallow land. tibility of soil particles to detachment and transport by The clean tillage consisted of chisel plowing each treat-rainfall and runo . The factor represents the ability ment pasture one time followed by disking two times of soils to resist erosion and depends on soil texture, with a cutting disk to incorporate any plant material structure, and composition. Soil properties were ob- and fertilizer and lime into the soil (B ). tained from Ethiopian government data. Then, we cor- The conservation practices factor ( ) indicates the responded every soil property to the value referring e ects of practices in reducing the volume of water to Nomograph values calculated by W and runo and thus the amount of soil loss. In fact, the S ( ). factor represents cropland practice factor and erosion
) control practices such contouring, strip cropping, ter-The slope length factor ( ) and slope steepness ( ) racing, etc. Area with no conservation measures has
m i a l LS A R K L S (LS) C S L P LS LS R l m R F F C F F R C R F F p P C K et al., P K P L S P
Cover, management and support practices factor ( )
Development of model database for USLE a) Rainfall erosivity factor ( )
d)
b)
c) Slope length and steepness factor (
CP R
Soil erodibility factor (K)
LS , + + + + + + + + + , 0/ .+ . /0 * *0/ ,, + # # -+320 -. . * / ,**/ / ,+ +33. * - / $ +30* +311 # , +33. // # 3/ 11 0 *2+ * *.11* -+312 # ,**/ # # +312 f f F
ῌ ῌ ῌ ῍ OORE RUCH UNNPHENG
Spatial distribution of the soil erodibility factor h yr was located in the north east, center and
south-value of . . The factor is defined as the ratio of soil ( ), the highest ones being located in the north-east, loss with a specific support practice to the correspond- center and south-east of the study site which reflects ing loss with upland and down slope culture. Due to the most erodible soils, prone to degradation. In fact, in the fact that there were feeble erosion control practices these areas we find silty soils and impermeable subsoils in the research area, the factor was assumed as a unit such as clay and soils low in organic matter which are value ( ). the most susceptible to be eroded (FAO, ).
The cover and management and support practices factors are commonly used to determine the combined
land use management factor (the factor). Data re- We obtained the factor using the interaction be-lated to the cover management and conservation prac- tween topography and flow accumulation (M and tices index are derived from USDA ( ) and based on B , ). Regarding factor, we create DEM map the index value used by F ( ) ; the (Fig. ) from the elevation data provided by the Ethi-values were adjusted for the study area. The land use/ pian government. Then from DEM, we derived the land cover map, obtained from Ethiopian Ministry of values and created the map corresponding to topogra-Agriculture, was derived from the satellite images and phy factor ( ) (Fig. ). This latter is classified into served as a guiding tool in the allocation of the and classes.
the factors for di erent land use classes. We noted that the lowest values are located in the
We obtained the factor values using the digital data. The spatial distribution of the factor is shown in the Fig. .
We obtained classes for the rainfall erosivity factor ( ). We observed that the high value of rainfall ero-sivity factor ranging from , to , MJ mm ha
east of the study area and is prone to soil erosion.
The value ranges from to . . The higher value indicates a lower infiltration rate thus the soil is more prone to erosion. The following map (Fig. ) re-presents the spatial distribution of the soil erodibility in East Shewa.
We obtained also classes of soil erodibility factor
Spatial distribution of rainfall erosivity factor Digital elvation model of the study area
P K P P CP LS S et al. CP LS LS C P LS R R R K K Fig. Fig. Fig.
.
Results and discussion
LS factor R factor K factor + + + + * + ,**-+31, +320 +33+ . / / # , / + *2+ + 131 * * . -/ -, .
-῍ ῍ ῍ ῍ ῍ ῍ ῍ ῍ ῍ ῍ ῍ ῍ ῍ ῍ ῎ ῌ ῌ ῌ ῌ ῌ ῌ ῌ ῌ ῌ ῌ ῌ ῌ ῌ ῌ
Area distribution area of land cover in East Shewa ( )
Spatial distribution of LS factor
Land use distribution map
Spatial distribution of factor
land, grassland and water bodies at almost equal per-centage of land occupation ( . , , and . re-north-west part of East Shewa which reflects that it is spectively). Fig. states this outcome.
less prone zone to erosion.
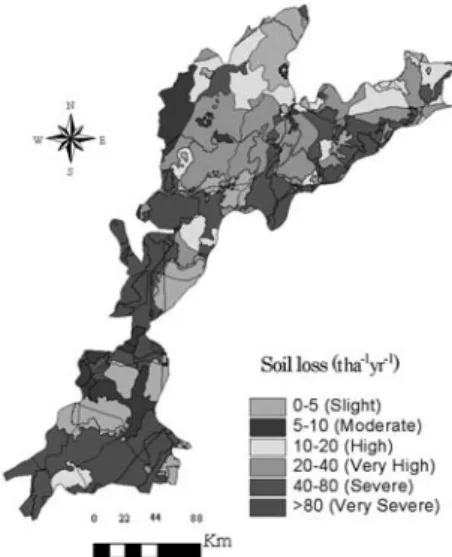
The soil erosion map resulting from the spatial over-A map of the (Fig. ) was generated through re- lay of USLE factors in East Shewa zone is presented classification of each land-use/land-cover type into its below (Fig. ). The estimated soil erosion was classified corresponding values. into six di erent erosion severity classes : slight ero-Then we generated the land use/land-cover map. sion is t ha yr , moderate is t ha yr , high This latter shows the existence of nine types of land is t ha yr , very high is t ha yr , severe cover : bareland, cultivation, grassland, natural forest, is t ha yr , very severe is t ha yr . We plantation, shrubland, water, wetland, and woodland. obtained the map below.
The distribution map of the factor and land cover The area of damage or the eroded area represents map demonstrate that the zones of high values almost of to the total area of East Shewa as ranging from . to correspond to the most erodable illustrated in Fig. .
areas covered with cultivation, shrubland and grass- The result of the erosion study indicates -as shown in land and are distributed randomly all over East Shewa. the map of spatial distribution of soil loss- that : These types of land cover occupy the largest areas in . of the total area is under very high erosion, East Shewa. In fact, cultivation represents . of the comprising between to t ha yr
total land-cover in East Shewa zone, followed by shrub- The potential of erosion under very severe class CP CP C CP CP Fig. Fig. Fig. Fig.
Soil loss distribution CP factor + + + + + + + + + + + + + + ++ 2 +* 3 , 2 0 3 # * / / +* +* ,* ,* .* .* 2* 2* 2, * */ + +* ,, -0* 1 ,* .* 2 / 1 0
῍ ῍ ῍ ῍ ῌ ῌ ῌ ῌ ῌ ῌ ῌ
Area distribution across slope and erosion ( )
agement factor and topography factor have high values Spatial distribution of soil loss in East Shewa
values of the which relates the severity of soil erosion with the steepness and length of the slope. Table shows the evidence that large areas which are prone to severe to very severe erosion are located on moderate and steep slopes. These areas range between
to . of the total area of East Shewa.
It has been attested that Ethiopia has a lonf history of soil erosion. The results of this study confirm this statement. In fact, we may a rm the critical situation of degradation in East Shewa. Actually, we observed Area distribution of erosion risk ( )
that rainfall erosivity, soil erodibility, land-cover
man-defined with an amount of erosion beyond t ha in areas located essentially in the north-east, center and yr and occupying . of the total study area. south-east of East Shewa which reflects the most erod-Severe erosion corresponding to an amount of soil ible soil locality prone to degradation.
loss between and t ha yr is occupying . Hence, according to the obtained results, we con-of the area. cluded that of the lands in East Shewa zone are If we observe both maps of rainfall erosivity and soil under high, very high, severe and very severe erosion loss spatial distribution, we note that the zones where and located in the north-eastern, central and southern rainfall erosivity is high the erosion is severe to very parts of the study site and are covered mainly with severe. From the land cover map and soil loss map, we cultivation, shrubland and grassland. This is the evi-note that shrubland and cultivation zones correspond dence for erosive areas repeatedly cultivated or fre-to the high, very high, severe and very severe soil loss. quently used for grazing such shrublands and grass-Accordingly, high erosion classes concentrate in areas lands.
where land is used for field crops with feeble conserva- This study is valuable as a step to further research tion activities. on the relationship between environmental and socio-These areas are notably located in the center and economic conditions and to illustrate the e ciency of south, and are covered mainly by cultivation. Thus we conservation techniques at both levels.
concluded that croplands are most prone to erosion Still, there is a need to confirm and validate the because they are tilled repetitively and left without results of USLE prediction with direct field measure-vegetation cover. Besides, natural forests, plantation ments of soil erosion on farmland. For that reason, pre-and woodlpre-and correspond to the lowest area prone to vious measures were accomplished in order to assess erosion because plant cover protects the soil from the soil loss at a small scale at the visited farmlands of erosive power of runo and rain drops. Dalecha Gada village in Boset Wareda (North East
These eroded areas correspond also to the highest Shewa).
LS Table
Fig.
Fig.
.
Conclusion and perspectives
+ + + + + ,1 -. 0 $ 2* ,* 1 .* 2* +2 + 2, $ # + 3 +*
.
ῌ ῌ ῍ ῌ ῌ ῌ ῌ ῌ ῌ ῌ ῌ ῌ ῌ ῌ ῌ ῌ ῌ _
OWMAN ECK USBY UNTER UBBELL
URNI
EFENI
DEMOLA AUL
ENARD ENNETH REIMUND
MOLDUS
GAWA AITO INO CHIDA HAN
HAFIQ HAN OORE URCH EE ONO EILER HIFERAW OLDEN EIGEL OUMIER ISCHMEIER MITH
UNNPHENG ATINAVIN EKPAIBOONWATANA RAMOJANEE
UHAMMAD
GIS Glossary, URL : http : //www.gisdevelopment.net/glossary/ f.htm
B , M.T., B , P.A., L , K.S., G , S.A. and H ,
H , H. ( ). Erosion Productivity Conservation Systems
ference on Soil Conservation, Maracay, Venezuela, pp. ment. Asian Institute of Technology, Khao Yai National Park, Thailand, pp. .
in Ethiopia. In : Pla Sentis, I. (Ed.) :
Vol. . Proceedings IV International
Con-.
K , K. ( ). The Soils of the Anjeni Area Gojam Re-search Unit, Ethiopia. ReRe-search .
University of Berne. A K. Braimoh and P L.G. Vlek. ( ). Impact of
R , K.G., K G. and F , J.R. ( ). Using
Land Use on Soil Resources. Springer, p : .
monthly precipitation to estimate the R-factor in the re-A , H.M.L. ( ). Methodology used to determinethe
vised USLE. , , pp.
maximum potential average annual soil loss due to sheet
O , S., S , G., M , N., U , S., K , N.M. and and rill erosion in Morocco. FAO, Soils Bulltein ; .
S , M. ( ). Estimation of soil erosion using USLE B , C. ( ) Spatial anaysis of potential soil erosion risks in
and Landsat TM in Pakistan (ACRS ). URL : http : // Welo Region, Ethiopia : a geomorphological evaluation.
www.gisdevelopment.net/application/natural hazards/
, .
landslides/index.htm
M , I.D. and B , G. J. ( ). Physical basis of the length-D.S. ( ). No-till, Reduced Tillage and Conventional
Till-slope factor in the Universal Soil Loss Equation. age Systems for Small-grain Forage Production. Arkansas
, .
Animal Science Department Report, , pp. .
L , S. ( ). Soil erosion assessment and its verification using B , R. and S , W. ( ). Erodibility in the Suke-Harerge
the universal soil loss equation and geographic informa-and Andit Tid Research Units (Ethiopia).
tion system : A case study at Boun, Korea. . Soil Conservation Research Project (SCRP), Centre for
, .
Development and Environment, University of Berne.
S , B. and H , S., ( ). Soil erosion and small-Ethiopian Ministry of Agriculture, ( ) Topographic and
holder’s conservation decisions in the highlands of Ethio-agrarian digital database.
pia, ( ) : .
FAO ( ), Food and agriculture for poorest countries. URL :
USDA ( ), USDA History Collection Series VI. Newsletters, http : / / blog. populationinstitute. org / / / /
fao-. another-food-crisis/http : //www.fao.org/
W , G. ( ). The soils of the Maybar area Wello Re-F , F. ( ). Climat et Erosion. Presses Universitaires de
search Unit, Ethiopia. Research Report. France, Paris, , pp. .
W , W.H. and S , D.D. ( ). Predicting Rainfall
F , P., P , S. M , S. and
Erosion Losses. P , P. ( ). Application of remote sensing and
No. , U.S. Department of Agriculture. GIS for appraisal of soil erosion hazards. In : Proceedings
of the Meeting on Conservation and Sustainable Develop-This work would have not been completed without the contribution of many individuals and institutions, among them Dr. M AQIL (Post-Doctoral fellow at Tokyo University of Agriculture) to whom we ex-press our deep gratitude and to the Ministry of Agricul-ture of Ethiopia for the valuable data provided to us.
Soil Conservation and Productivity,
Report Soil Conserva-tion Research Project, Centre for Development and Environ-ment,
Journal of Hydrology
Mountain Research and Development
Soil Science Society of America Journal,
Research Report
Environmental Geology,
World Development
A Guide to Conservation Planning. Agricul-ture Handbook References
Acknowledgement
+32/ 0/. 11 3+ + , 01. +32/ ,1 ,**2 +33. ,/. +311 ,21 -**0 -3 /+ +331 +322 + / +-3 +.. +320 ,**/ +,3. +,32 2* 2, ,**. +32. / ./1 .0/ +333 ,**/ . 1-3 1/, ,**-+31, ,*+* ++ +2 +3+2 +330 +320 +30* +0 ,+ +312 +33+ +/1 -. 2 /* +*, ./ ,1 /, /-1平成 年 月 日受付 平成 年 月 日受理 東京農業大学大学院農学研究科農業工学専攻 東京農業大学地球環境科学部生産環境工学科 エチオピア国では山林の伐採および耕作区域の拡大のため 土壌侵食による国土の荒廃が著しく 人 の生活を脅かす深刻な問題となっている 実際に 土壌侵食に伴う土壌栄養分の減少 干ばつおよび飢 饉がエチオピアで頻繁に起こっている 生産性の高い表土のほとんどは侵食作用で削り取られ 結果として 慢性の食糧不足および回復の困難な貧困がつづいている 土壌侵食は エチオピア国において農業の持続性 を脅かす重要な環境問題である 本研究の目的は エチオピア国オロミア地域の東ショワ地帯を対象として 土壌流亡予測式 と地 理情報システム を統合することにより 広域的な土壌侵食の危険性を明らかにすることである 降雨 量 地形 土壌および土地利用デ タを およびエチオピア政府から入手し を使用して広域デ タベ スを作成した その結果 侵食の程度が高い 非常に高い 著しい 非常に著しいと分類された面積 が対象地域の に上ることが明らかになった それらの地域は北東地域 中央部及びと南部に分布し 主 に耕作が繰り返されている土地や 家畜の放牧にさらされる潅木地と草原であった 土壌侵食 土地被覆 エチオピア