Contents lists available atScienceDirect
Optical Materials: X
journal homepage:www.journals.elsevier.com/optical-materials-x
Femtosecond transient absorption spectroscopy of laser-ablated graphite
and reduced graphene oxide for optical switching behavior
Yatin Madhukar Bhamare
a, Pankaj Koinkar
a, Akihiro Furube
a,*, M.A. More
baDepartment of Optical Science, Graduate School of Technology, Industrial and Social Science, Tokushima University, 2-1 Minamijosanjima, Tokushima, Japan bDepartment of Physics, Center for Advanced Studies in Material Science and Solid State Physics, S.P. Pune University, Pune, 411007, India
A R T I C L E I N F O
Keywords: Laser ablation
Transient absorption spectroscopy Optical switching
Ultrafast spectroscopy Graphite
Graphene
A B S T R A C T
Carbon based materials are considered as a rewarding contestant for optical devices due to its novel properties. In this study, graphite is laser-ablated and different analytical methods such as XRD and Raman spectroscopy are used to evaluate the crystalline nature. In XRD, it indicates the decreased intensity after laser ablation but no change in peak positions resulted as graphite is very strong and hard material. Scanning electron microscopy (SEM) used to evaluate structural characteristics shows the overlapping layered structure after ablation. Reduced graphene oxide (rGO) is prepared by using modified Hummers' method and reduced it by thermal reduction method. UV–Vis spectra confirmed the peaks of graphite and rGO at 274 nm and 267 nm, respectively. To study the carrier relaxation dynamics of graphite and rGO, ultrafast Visible-pump/NIR-probe femtosecond transient absorption spectroscopy was used. Carrier relaxation occurred between 260 and 309 fs even after laser ablation damage, which is useful for future application of optical switching under high laser repetition.
1. Introduction
Carbon is the wonder element for research activities from many years because of its physical and electromagnetic properties [1]. Gra-phite is the most stable allotrope of carbon with a layered and planar structure. Unique electronical and lattice properties of graphite are of high current interest for applications in carbon-based electronics [2]. Recently, in the carbon and graphite like materials attention has been paid to the optical switching behavior.
In 2004, Andre Geim and Konstantin Novoselov discovered the material named as Graphene [3]. Graphene is two-dimensional (2D) lattice of carbon atoms arranged in a honeycomb structure. Nowadays graphene attracts significant attention by the scientific community all over the world because of its unique optical, electronic, thermal and structural properties [4]. Its transport properties display promising fu-ture in optical devices. Graphene consists a unique band strucfu-ture; that is, the conduction band and the valence band touch each other at the Dirac point, which exhibits a zero band gap semiconductor behavior. Recently, in graphene-based materials there is a rapid growth in 2D counterparts, graphene oxide (GO) is the most famous among them. Reduced graphene oxide (rGO) has been proven to be an effective method in the development of graphene-modified materials and de-vices.
GO has been used for many applications like supercapacitors [5],
film transistors [6], optical limiters [7], sensors [8] and optical switchers [9] etc. In the development of optical devices and im-plementation of graphite and rGO based nano-systems, investigation of optical properties of graphite and rGO is essential. Femtosecond tran-sient absorption (TA) spectroscopy is a powerful experimental tech-nique for studying photo-generated carrier dynamics while controlling the physical parameters such as the size of nanoparticle (NP).
J.P. Yang et al. also studied the switching behavior of two types of individualized single-walled nanotubes (SWNTs) [10]. Careful selection of pump/probe wavelengths shows extremely fast and monotonic de-cays. Only a few hundreds of fs decay time is observed for both high pressure CO conversion single-walled nanotubes (HiPco-SWNTs) and pulsed laser vaporization single-walled nanotubes (PLV-SWNTs). Ul-trafast response is governed by a competition of photo-induced ab-sorption (PA) and photo-induced bleaching (PB) from different tubes. Resulted that, these are the suitable candidates for developing femto-second all-optical switches.
X. Zhang et al. investigated the transient optical response of wave guided gold nanowires using pump-probe spectroscopy [11]. TA ki-netics showed an optical-switching effect as fast as 200 fs in coupled spectrum, induced by electron-electron scattering and due to the strong optical excitation. It is mainly based on broadening and red-shift of the resonance spectrum of the plasmon polaritons. This effect is spectrally narrowed and enhanced through coupling with the narrow-band
https://doi.org/10.1016/j.omx.2019.100026
Received 12 December 2018; Received in revised form 6 April 2019; Accepted 8 April 2019
*
Corresponding author.
E-mail address:furube.akihiro@tokushima-u.ac.jp(A. Furube).
Available online 04 July 2019
2590-1478/ © 2019 The Authors. Published by Elsevier B.V. This is an open access article under the CC BY license (http://creativecommons.org/licenses/by/4.0/).
waveguide mode.
Very recently, Y. Wang et al. demonstrated ultrafast optical switching processes using gold nanowires through laser pulse induced thermal effects [12]. The importance of this experimental work lies mainly in the investigation of transverse electric (TE) and transverse magnetic (TM) polarization dependence of the optical switching effect of the waveguide gold nanowire grating. They had achieved efficiency of optical switching more than 7% modulation on the transmission in the optical switching signal at the pumpfluence of less than 18 μJ/cm2
using TM-pump/TE-probe.
In this study, the ultrafast optical response of graphite in powder form treated by laser ablation and rGO is investigated, aiming future application of optical switching.
2. Experimental
2.1. Sample preparation
Graphite powder (˃20μm size), H2SO4, NaNO3, NaOH, H2O2(30%),
K3Fe (CN)6and KMnO4were purchased from Sigma-Aldrich Co., 3050
Spruce street, St. Louis, MO 63103 USA. All the chemicals are used as received without further purifications. GO was prepared from graphite powder using modified version of Hummers' method [13]. Graphite powder (1 g) and sodium nitrate (0.5 g) were mixed together followed by the addition of conc. sulphuric acid (23 ml) under the constant stirring. After 1 h, KMnO4(3 g) was added to the above solution
gra-dually. To prevent explosion and overheating, temperature is main-tained less than 20 °C. Further, the mixture was stirred at 35 °C for 12 h and 500 ml of water was added under vigorous stirring in the resulting solution. The suspension was treated with 30% H2O2solution (5 ml), to
ensure the completion of reaction with KMnO4. The mixture was further
washed with HCl and H2O respectively. The resulting solution was
fil-tered and dried to get the graphene oxide (GO) powder. The thermal reduction of GO was carried out in a quartz tube at 1050 °C under Ar gas ambience for 30-min duration. The GO was completely converted into reduced graphene oxide (rGO).
2.2. Laser ablation
The solution of graphite powder (200 mg) and acetone (20 ml) were mixed in a glass bottle. The laser ablation was carried out under mag-netic stirring. The laser pulses generated from the second harmonic of a Nd:YAG laser (wavelength 532 nm, repetition frequency 10 Hz, 10 ns fwhm pulse−1, 55 mJ pulse−1, spectra Physics Quanta-Ray) has been used for laser ablation.
The laser ablation time was 240 min with the solution being con-tinuously stirred by a magnetic rotor during irradiation. The size of laser beam was about 5 mm in diameter. After laser ablation, solution was cooled at room temperature. Then the solution was heated at 90 °C to evaporate the acetone and get the dry sample in powder form for characterization.
2.3. Characterization
Ultraviolet–visible (UV–vis) absorption spectra of the original and laser-ablated graphite powder and reduced graphene oxide (rGO) were obtained with absorption spectrometer (JASCO, V-670). The mor-phology of laser ablated graphite powder was observed under scanning electron microscope (SEM, S-4700, Hitachi). Raman spectroscopy analysis was performed using confocal micro-raman LabRAM HR evo-lution Raman microscope (Horiba) with 532 nm laser. X-ray diffraction analysis (XRD) of the original and laser-ablated graphite powders were carried out on Bruker AXSD-8 Advance X-ray diffractometer with monochromatic CuKα, radiation (λ = 1.5406 A°). Data were collected from 10° to 80° at a scan rate of 0.1° min−1.
2.4. Femtosecond transient absorption spectrometer
Visible-pump/NIR-probe femtosecond transient absorption spec-troscopy was used to measure charge carrier dynamics. The light source for transient absorption spectroscopy was a femtosecond titanium sapphire laser with a regenerative amplifier (Hurricane, Spectra Physics, 800 nm wavelength, 130 fs fwhm pulse width, 0.8 mJ pulse−1, 1 kHz repetition). The fundamental beam was split into two and one of them was used as pump light after converting to the second harmonic of 400 nm wavelength at a 500 Hz modulation frequency. The other beam was used as probe light after converting to the white-light continuum by focusing the fundamental beam into a sapphire plate (2 mm thick). At the centre of the pump light (~0.3 mm diameter) the probe light was focused on the sample. The diffuse reflected probe light from the sample was detected by the Si photodiode after passing through a monochromator (Acton Research, SpectraPro-150). TA intensity was evaluated as %Abs. = 100(R0-R)/R0, where R0and R were diffuse
re-flected probe light intensity without and with excitation, respectively [14].
3. Results and discussions
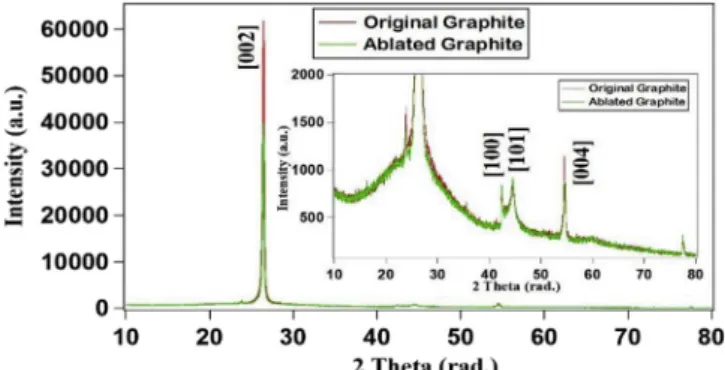
3.1. X-ray diffraction (XRD)Fig. 1. Femtosecond transient absorption spectra
XRD was used for the determination of lattice parameters and the crystal structure. In Fig. 1, we observed peak (002) at the plane (2θ = 26°) of original graphite powder. In the zoom image, we ob-served the normal peaks (100), (101), (004) at the plane (2θ = 43°,46°,55°) in Cu anode (and corresponding to 31°, 50°, 52°, 64° peaks for Co anode respectively) [15]. After the laser ablation for 240 min, peaks at 26° and 55° that are assigned to (002) and (004) layers of graphite, stipulate the formation of graphitic nature which indicates it is not an amorphous structure. Narrow FWHM (Full width and half maximum) of (002) peak appears from the continuity of gra-phene layers, the broadness of this peak in the carbon soot originates from the random distribution of the basic structure. The lack of in-tensity in the other graphite peaks in XRD patterns shows that there are fewer groups of lattice planes in the laser ablated graphite structure compared to the original graphite structure. The fragmentation of the structure to smaller pieces can be concluded, but no change in peak positions indicating that the graphite is hard and stable material in the case of structural properties. In our group, under the same experimental set-up, laser ablation of boron nitride shows change in peak position in XRD patterns [16].
3.2. Raman spectral analysis
Raman spectroscopy is an essential tool for characterization for carbon based materials, and the spectrum is highly sensitive to the lattice and electronic structures. Raman spectroscopy analysis was
carried out for original graphite and laser ablated graphite. InFig. 2, the band observed at about 1577 cm−1shows G-band, which corre-sponds to a splitting of the E2gstretching mode of graphite and reflects
the structural intensity of the sp2-hybridized carbon atom. D-band
ap-pears at 1350 cm−1, assigned to zone centre phonons of K-point pho-nons of A1gsymmetry, characterizes the disordered graphite planes and
the defects incorporated into heptagon and pentagon graphitic struc-tures. G′-band at 2712 cm−1is related to the intrinsic property of
well-ordered sp2carbon structures for graphite [15]. After laser ablation,
D-band and G′-D-band peaks are slightly shifted to right side by 5–10 wave numbers, but there is no obvious change in peak position for G-band. However, the G/D ratio decreases from 4.13 to 3.38, indicating the edge effect in laser ablated nanostructures. In our group, under the same experimental set-up, laser ablation of MoS2shows change in peak
position in Raman spectra [17].
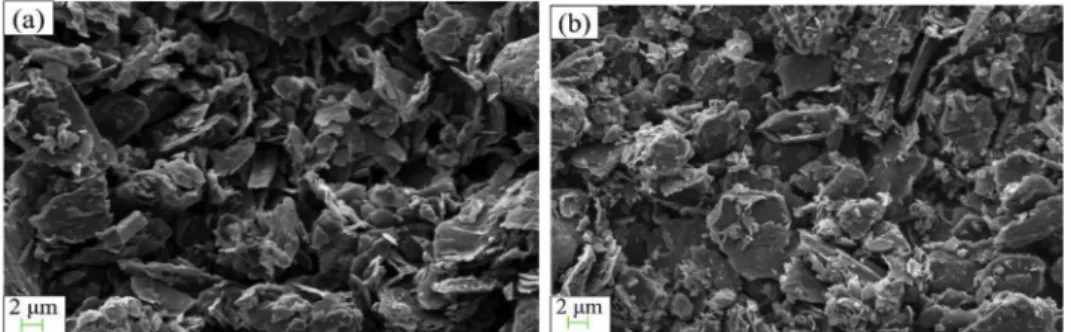
3.3. SEM analysis
In scanning electron microscopy, by using electron beam surface of the specimen is analysed.
Fig. 3(a) shows SEM image of the graphite before ablation. The surface of graphite is found to have a layered structure [18] and some ununiformed layers in the original graphite powder.Fig. 3(b) shows SEM image of graphite after 240 min laser ablation, in which composed overlapping graphite thin layers are formed. This structure clearly shows the effect of laser ablation.
3.4. UV–vis spectroscopy
To evaluate the optical absorption nature of the opaque solid spe-cimens dispersed influids, UV–Vis absorption spectroscopy was used. 10 mg original graphite powder was added into 10 ml of acetone. 10 mg ablated graphite powder was added into 10 ml of acetone. 10 mg of rGO was added into the mixed solvent of 7 ml distilled water and 3 ml me-thanol. InFig. 4, original graphite and ablated graphite show the ab-sorption peaks same at 274 nm [19], while only the absorption intensity increased after ablation. On the other hand, the absorption peak of the
rGO shifts to 267 nm [20], corresponding to the thermal reduction of graphene oxide produced by hummers method. The absorption rise toward 200 nm in original and ablated graphite samples are seen. These are the effects of acetone used as a solvent. Although light scattering by the particle nature gives an offset to absorbance, it seems the main optical property of graphite remains unchanged even after the laser ablation treatment.
3.5. Femtosecond transient absorption spectra
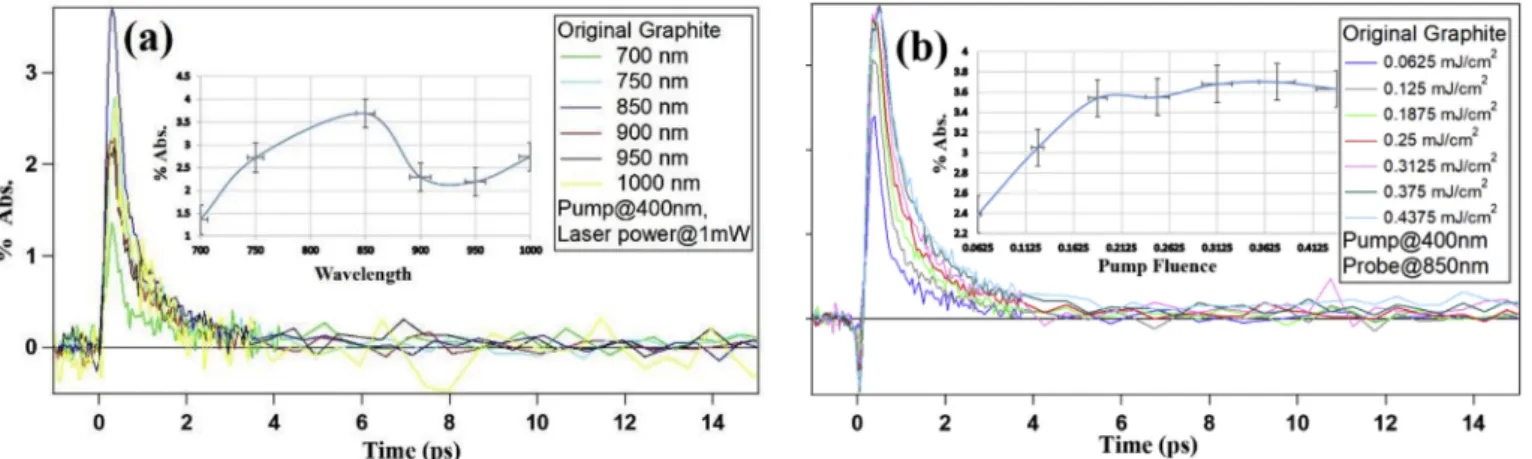
As shown inFig. 5, a prompt absorption rise was clearly observed in femtosecond transient absorption time-profiles of the original graphite. After prompt absorption rise, graphite shows decay about 300 ± 20 fs. This fs decay is obtained due to intra-band relaxation of the excited electrons [21]. InFig. 5(a), highest absorption intensity is observed at 850 nm probe wavelength as we experimented different probe wave-lengths among 700 nm–1000 nm. The spectrum is shown in the inset of Fig. 5(a). Also, we have experimented different pump fluence depen-dence spectra.Fig. 5(b) shows TA peak intensity with 0.25 mJ/cm2
pump fluence is most strong with stable optical response among 0.0625 mJ/cm2to 0.4375 mJ/cm2. At 0.25 mJ/cm2pumpfluence, peak
absorption started saturating as the dependence is shown in the inset of Fig. 5(b). An inter-band transition is an electronic transition between a lower filled band and an upper band. Photo-excitation is known to cause a bleaching of this transition. This phenomenon appears as the initial response with a small negative dip at time zero. An intra-band transition is a transition between electronic states within the conduc-tion band. This contribuconduc-tion becomes dominant as a positive optical response is observed [21]. The decay process reflects cooling of ther-mally excited electrons near the Fermi level (the Dirac point in the case of rGO). An energy scheme for graphite is shown for the optical tran-sitions of excitation (at 400 nm) and probe (at 850 nm) inScheme 1.
Comparison of transient absorption spectra of original graphite, laser ablated graphite, and reduced graphene oxide (rGO) is
Fig. 2. Raman spectra of original graphite and laser ablated graphite.
Fig. 3. SEM Images of graphite (a) before ablation and (b) after ablation.
experimented with 850 nm probe wavelength and pump fluence of 0.25 mJ/cm2. InFig. 6, we notice that normalized transient absorption
spectra of all three samples give similar dynamics, in which the decay after the prompt excitation is composed of an ultrafast component for
original graphite at 287 fs, ablated graphite at 309 fs and rGO at 260 fs. The result shows that rGO decays faster than graphite. Previous report also reveals ultrafast component for graphite and graphene about 200 fs at the pumpfluence of 150 mJ/cm2 [22]. In an electron hole pairs separation, graphite can confine the recombination hole pairs, because graphite is a layered structure therefore it can move layer to layer, therefore rGO decays faster that graphite.
These decay profiles are analysed using a double exponential function (Table 1).
A1exp(-t/τ1) + A2exp(-t/τ2) + C
Focusing onτ1, this parameter of rGO is smaller compared to
gra-phite before ablation and after ablation. In the slow component,τ2,
graphite before and after ablation are smaller than rGO.Fig. 6shows that the decay times are only a few hundreds of fs for graphite and rGO. Therefore, at these pump/probe wavelengths the ultrafast response is suitable for developing the femtosecond optical switches.
Transient absorption spectroscopy confirmed the ultrafast excitation of original graphite, ablated graphite, and rGO. The carrier relaxation occurred between 260 and 309 fs for all the samples. RGO shows TA intensity about 6.7%, while both graphite samples showed 3.5%. Although rGO shows higher absorption intensity than both graphite samples, much cheaper graphite is also useful for the future application of optical switching. In future, another material can be used with gra-phite as a composite material to achieve enhanced TA intensity. It will be the better way to achieve optical switching application while saving the cost of the material.
4. Conclusion
Graphite was laser-ablated for 240 min and we have compared the results of original graphite and ablated graphite through different characterization techniques. XRD and Raman spectroscopy showed the peak intensities decreased after laser ablation. SEM image displayed the overlapping layered structure. Reduced graphene oxide (rGO) was synthesized by modified Hummers' method and reduced it by thermal reduction method. UV–Vis spectrum confirmed the peaks of graphite and rGO at 274 nm and 267 nm respectively. Femtosecond transient absorption spectroscopy confirmed the ultrafast excitation and relaxa-tion of both graphite (non-ablated and laser-ablated) and rGO. The carrier relaxation occurred between 260 and 309 fs for all samples. Due to this ultrafast response these materials are useful for the future ap-plications of the optical switching. Though thefitting parameters shows faster decay and highest absorption intensity of rGO than graphite, much cheaper graphite can also be useful for the application of optical switching.
This research did not receive any specific grant from funding agencies in the public, commercial, or not-for-profit sectors.
Fig. 5. Transient absorption spectra of graphite powder (a) wavelength dependence and (b) Pumpfluence dependence.
Scheme 1. Energy scheme for graphite for the optical transitions of excitation (at 400 nm) and probe (at 850 nm).
Fig. 6. Comparison of transient absorption spectra of original graphite, ablated graphite and rGO.
Declaration of interests
None.
References
[1] S.G. Lebedev, Field-effect switching in nano-graphite films, J. Phys. Chem. Solids 75 (2014) 1029–1032.
[2] M. Breusing, C. Ropers, T. Elsaesser, Ultrafast carrier dynamics in graphite, Phys. Rev. Lett. 102 (2009) 086809.
[3] K.S. Novoselov, A.K. Geim, S.V. Morozov, D. Jiang, Y. Zhang, S.V. Dubonos, I.V. Grigorieva, A.A. Firsov, Electric Field effect in atomically thin carbon films, Science 306 (2004) 666–669.
[4] N. Liaros, S. Couris, E. Koudoumas, P.A. Loukakos, Ultrafast processes in graphene oxide during femtosecond laser excitation, J. Phys. Chem. C 120 (2016) 4104–4111. [5] P.B. Pawar, S. Shukla, S. Saxena, Graphene oxide - polyvinyl alcohol nanocomposite
based electrode material for supercapacitors, J. Power Sources 321 (2016) 102–105.
[6] Q. He, S. Wu, S. Gao, X. Cao, Z. Yin, H. Li, P. Chen, H. Zhang, Transparent,flexible, all-reduced graphene oxide thinfilm transistors, ACS Nano 5 (2011) 5038–5044. [7] N. Liaros, P. Aloukos, A. Kolokithas-Ntoukas, A. Bakandritsos, T. Szabo, R. Zboril,
S. Couris, Nonlinear optical properties and broadband optical power limiting action of graphene oxide colloids, J. Phys. Chem. C 117 (2013) 6842–6850.
[8] S. Borini, R. White, D. Wei, M. Astley, S. Haque, E. Spigone, N. Harris, J. Kivioja, T. Ryhanen, Ultrafast graphene oxide humidity sensors, ACS Nano 7 (2013) 11166–11173.
[9] S. Roy, C. Yadav, Femtosecond all-optical parallel logic gates based on tunable saturable to reverse saturable absorption in graphene-oxide thinfilms, Appl. Phys. Lett. 103 (2013) 241113.
[10] J.P. Yang, M.M. Kappes, H. Hippler, A.N. Unterreiner, Femtosecond transient ab-sorption spectroscopy of single-walled carbon nanotubes and their ultrafast optical switching behaviour, Solid State Phenom. 121–123 (2007) 905–908.
[11] X. Zhang, B. Sun, J.M. Hodgkiss, R.H. Friend, Tunable ultrafast optical switching via
waveguided gold nanowires, Adv. Mater. 20 (2008) 4455–4459.
[12] Y. Wang, X. Zhang, X. Fang, Ultrafast optical heating induced polarization-depen-dent optical switching in gold nanowires, Appl. Sci. 7 (2017) 46.
[13] L. Shahriary, A.A. Athawale, Graphene oxide synthesized by using modified hum-mers approach, Int. J. Renew. Energy Environ. Eng. 2 (2014) 58–63.
[14] T. Asahi, A. Furube, H. Fukumura, M. Ichikawa, H. Masuhara, Development of a femtosecond diffuse reflectance spectroscopic system, evaluation of its temporal resolution, and applications to organic powder systems, Rev. Sci. Instrum. 69 (1998) 2.
[15] F. Kazemizadeh, R. Malekfar, P. Parvin, Pulsed laser ablation synthesis of carbon nanoparticles in vacuum, J. Phys. Chem. Solids 104 (2017) 252–256. [16] A. Yamaguchi, M. Kanazawa, P. Koinkar, A. Furube, S.B. Kondawar, K. Murai,
T. Moriga, Production of boron nitride nanostructures using nanosecond laser ab-lation in acetone, Int. J. Mod. Phys. B 32 (2018) 1840073.
[17] M. Kanazawa, P. Koinkar, A. Furube, D. Gavhane, M.A. More, Enhancement infield emission of MoS2nanosheets prepared in water using laser ablation method, Int. J.
Mod. Phys. B 32 (2018) 1840064.
[18] T. Smausz, B. Kondasz, T. Gera, T. Ajtai, N. Utry, M. Pinter, G. Kiss-Albert, J. Budai, Z. Bozoki, G. Szabo, B. Hopp, Determination of UV–visible–NIR absorption coeffi-cient of graphite bulk using direct and indirect methods, Appl. Phys. A 123 (2017) 633.
[19] K.H. Hung, C.H. Chan, H.W. Wang, Flexible TCO-free counter electrode for dye-sensitized solar cells using graphene nanosheets from a Ti-Ti(III) acid solution, Renew. Energy 66 (2014) 150–158.
[20] H. Saleem, M. Haneef, H.Y. Abbasi, Synthesis route of reduced graphene oxide via thermal reduction of chemically exfoliated graphene oxide, Mater. Chem. Phys. 204 (2018) 1–7.
[21] L.M. Malard, K.F. Mak, A.H.C. Neto, N.M.R. Peres, T.F. Heinz, Observation of intra-and inter-bintra-and transitions in the transient optical response of graphene, New J. Phys. 15 (2013) 015009.
[22] F. Carbone, G. Aubock, A. Cannizzo, F. Van Mourik, R.R. Nair, A.K. Geim, K.S. Novoselov, M. Chergui, Femtosecond carrier dynamics in bulk graphite and graphene paper, Chem. Phys. Lett. 504 (2011) 37–40.
Table 1
Fitting parameters of TA decay of original graphite, ablated graphite and reduced graphene oxide.
A1 τ1 (ps) A2 τ2 (ps) C % Abs.
Original graphite 1.935 ± 0.181 0.287 ± 0.0293 1.594 ± 0.189 1.122 ± 0.088 0.093 3.5
Ablated graphite 1.504 ± 0.639 0.309 ± 0.12 1.946 ± 0.666 1.019 ± 0.199 0.158 3.5