単結晶氷の摩擦電気
18
0
0
全文
(2) Jounal of Hokkaido University of Education (Section 11 A) Vol. 29, No. 2 February 1979. »ia»l¥±''N? (% 2 SliA) ® 29 ^ ^ 2.Jg- Bgft 54 ^ 2 J!. Frictional Electrification of Single Ice Crystals. Hisashi SHIO Physics Laboratory, Iwamizawa College, Hokkaido University of Education. Iwamizawa 068. jfe m m: WB^cDjmM »S%t^Jell?R4m'-N?^S. Abstract The effects of the crystallographic characteristics of the surface of a specimen with special regards to the frictional charging phenomenon have been investigated. Single crystal ice plates. cut from samples from the Mendenhall Glacier ice of Alaska were used and the frictional electrification was measured at ambient temperatures from —2° to —2PC in a cold room. As a result, the following new facts, which can not be completely explained by Latham et al's and Jaccard's theories, were revealed.. 1. In the case of an asymmetrical rubbing between paris of faces differently orientated with respect to crystal axes, the rubbed face of the prism plane was invariably positively electrified against that of the basal plane, regardless of the temperature difference between the pairs of the rubbed faces. However, at about — 6 °C the electric potential of the prism plane against the basal plane was greatly reduced and became so little as to be neglected. Moreover, as regards the asymmetrical rubbing between pairs of faces identically orientated with respect to crystal axes,. the electric potential of the rubbed face with a cold spot against that of a hot spot was reversed from positive to negative at —6°C or thereabouts as the ambientTemperature rose. The above. tendency is taken to be the same as that found for the artificial ice formed with polycrystallization of which the size of grains is about 5 mm in diameter on an average as bescribed in a. previous paper (Magono and Shio: 1966). The absolute magnitude of the potential was about 3 volts, which was two orders higher than the results calculated by theories over a wide temperature range except in the vicinity of —6°C.. It was concluded that the sign of charge did not deped upon the temperature difference, but the difference in hardness between the two rubbed faces of the specimens on the basis of the recrystallization effect of the rubbed face.. 1. Introduction It is considered that some solid precipitation particles (ice crystal, snow, graupel) in thundercloudes are charged by collision and repeated rubbing in the ascending stream. Therefore,. (35).
(3) H. SHIO. the basic studies of frictional electrification of ice on the basis of experiments are important to list possible mechanisms for the generation of static charge in thunderclouds. Generally speaking, in substances other than ice, frictional electrification has been much. studied by many researchers for a long time. For example, Coehn (1917) postulated the following law: when two kinds of nonconductors are rubbed together, the nonconductor with a higher. dielectric constant has a stronger tendency to be positively charged by rubbing and the potential difference is proportional to the difference of dielectric constant between the' two substances.. Shaw and Hanstock (1930) found that when two identical nonconductors, whether ebonite, or celluloid, or silk, are rubbed together, i) the charging may be attributed to the differential strain on the surfaces caused by rubbing, ii) the more strained surface is the more negative, iii) the. recovery from the strain effects caused by rubbing can be completely attained by the heat treatment. Peterson (1949) investigated the charge acquired by silica powder after sliding over the face of a piezoelectric quarts crystal under strain. He found that the charge is slightly affected by varying the strain. Hart, Huang and Schnitzler (1975) recently found that a carbon spray, containing particles as well as gas, produces an electric current when it impinges on a metal surface, and they proposed a correlation between the current and the work functions of the metals.. Regarding the ice, Yoshida (1944) first conducted experiments by asymmetrical rubbing of two ice sheets frozen on copper rods. He reported that fixed ice sheets with a hot spot (a. constant rubbing point) was negatively electrified against the other with a cold spot (variable rubbing points). According to these experiments he concluded that the charging was caused by. the temperature difference between the pairs of rubbed faces. Recently Latham (1963) independently investigated electrification by sliding a cube of ice down on an ice sheet coated on an inclined metal, and obtained the same results as Yoshida. On the other hand Latham and Mason. (1961 a) proposed a theory of thermoelectricity of ice, in which they showed that the thermoelectric potential, neglecting the roles of Bjerrum defects and the electrode contact potentials, may be written as V = 2AT mV, where V is the potential difference, and AT is the temperature difference between both opposite faces on a block of ice. Moreover they reported that this theory qualitatively agreed very well with the results of their experiments. More recently Jac-. card (1963) set forth a complete theory of the thermoelectric effect in pure ice and in HF doped ice, based on his four-carrier model namely, (Bjerrum defects, ionic defects). However, with regard to pure ice, the potential difference obtained from Jaccard's theory is similar to that obtained from Mason's theory.. Magono and Takahashi (1963) found that when cloud droplets collided with hot riming rods the rods were negatively electrified at temperatures below —10°C, but at temperatures above. —10°C the hot riming rods were positively electrified. Recently, Takahashi (1969) pointed out the effect of dislocation on the surface potential at various temperatures. Magono and Shio (1966) found that when pairs of artifical ice rods were asymmetrically rubbed together for a long time, the rubbed face with a hot spot was recrystallized from a'single crystal to a polycrystalline state.. Then the rubbed face with a hot spot showed a change in charge from negative to positive against the other face with a cold spot. Moreover Shio and Magono (1972) pointed out the effect of the. (36).
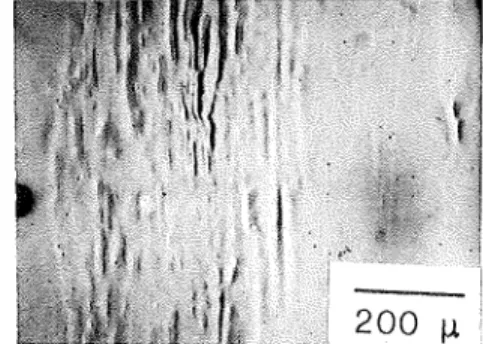
(4) Frictional Electrification of Single Ice Crystals. concentration of cell boundaries on the rubbed face to the charging processes. In this paper, in an. attempt to determine more fully the effects of the crystallographic characteristics on the charging mechanism, by using a single crystal ice rod with a rectangular solid, of which the four side surfaces constituted two prism planes and two basal planes respectively, the author made frictional experiments as below.. 200 n Fig. 1. Photomicrograph of pairs of surfaces identically orientated with respect to crystal axes before rubbing. Left: Basal plane. Right: Prism plane.. 2. Experimental methods 2 . 1 Preparation of ice specimens In these experiments single crystal ice plates cut from ice specimens of the Mendenhall. Glacier ice were used. Fig. 1 shows the basal plane (left) and the prism plane (right) of the ice specimen before rubbing. The shape of every ice specimen is a rectangular solid about 12 cm in length and 4 cm2 in area at the cross section, and one side surface is adhered to electrode consisting of a brass plate. In order to use the same specimens in many experiments, the rubbed faces of ice rods used in previous experiments were washed with 1°C distilled water, and were refrozen at about —5°C ambient temperatures.. 2 . 2 Rubbing treatment between pairs of ice specimens As shown in Fig. 2, one side of the pairs of ice rods is grounded, and held perpendicularly over the other which is connected to an electrometer. It is clear that when pairs of ice rods are asymmetrically rubbed together; a rubbed rod, as if it were being sawn by another rod, is always. rubbed in the neighbourhood of a single spot, another rod being moved like a saw has its rubbed area distributed along a narrow ribbon. Hence the rubbed face with a single spot is more heated. than the rubbed face with a narrow ribbon since the energy spent on both rods is identical with each other. In other words, as shown in the upper picture of Fig. 2 when an upper rod is moved. parallel to the axial direction of a lower rod left to right over the lower rod with a sawing motion, the temperature of the rubbed face of the upper rod may be warmer than that of the lower rod. On the other hand, contray to this, as shown in the lower picture of Fig. 2 when an upper rod is moved perpendicularly to the axial direction of a lower rod, the temperature gradient produced. (37).
(5) H. SHIO. between the rubbed faces of the ice rods is opposite in direction to that described in the upper picture. In this paper the rubbed face. with a narrow ribbon is called a cold spot and the rubbed face with a single spot is called a hot spot, the ice rod with a cold spot is called a col-. der ice and the other ice rod with a hot spot is called a wanner ice.. The load applied on the contact face of the lower ice rod was kept at 90g by poising with a. WARMER. TCE^. <^H. ^. water, after many measurements the weight of the specimen decreased less than about lOg as a result of melting. However the load on the con-. COLDER. (SH. tact face was kept at an almost constant value. by adjusting the position of the weight. As shown in the following chapter, since in these experiments it was observed that at the end of rubbing the shape of the contact face formed a circle with a radius of about 1mm, the load unit. COLDER ICE. SMALL AREA (HOT SPOT). LARGER AREA (COLD SPOT). weight. Because the same specimens were. used repeatedly after washing with 1°C distilled. A. A. /WARMER. ICE. p^.. SMALL AREA. LARGER AREA (COLD SPOT). (HOT SPOT). Fig. 2 Asymmetric rubbing of crossed rods.. area is approximately 12 g/mm2. However for a few seconds from the rubbing its value should be slightly larger because the area of the contact face is smaller, than at the end of rubbing. The combinations for pairs of ice rods are as follows: the one is a combination in which an asymmetric rubbing makes the contact face with the prism plane into a hot spot; in other words, this combination means the charging phenomenon of the prism plane with a hot spot against the basal plane with a cold spot. The other is a reverse combination with respect to the temperature gradient between pairs of contact faces as compared with the above method. 3. Results. The upper picture of Fig. 3 shows the electric potential of the prism plane with a hot spot against the basal plane with a cold spot by the lapse of rubbing time at an ambient temperature of —17°C. In this case, the rubbed face with the prism plane was warmer than that of the basal plane while the asymmetric rubbing was carried out, however, during the first few seconds of. rubbing the former was positively electrified against the latter and its electric potential increased with the lapse of rubbing time, reaching a maximum at 60 sec from the beginning of rubbing. Moreover, by an excess increase of rubbing, it began to decrease and approached zero at 360 sec. After a short interruption of rubbing for about 111 sec, when the same faces were rubbed together again, a reverse phenomenon appeared at an early period of rubbing. Namely, the prism plane. with a hot spot became negatively electrified against the other plane as indicated in the second. (38).
(6) Frictional Electrification of Single Ice Crystals PRISM PLANE, WARMER ICE (against basal plane, colder ice). SEC. PRISM PLANE, COLDER ICE (against _basal plane, warmer ice). 270 SEC. Fig. 3. Charging curves are for two kinds of faces differently orientated with respect to crystal axes in a cold range. Upper graph: Prism plane with hot spot/Basal plane with cold spot. Lower graph: Prism plane with cold spot/Basal plane with hot spot.. 200 ^ Fig. 4. Photomicrographs of pairs of rubbed faces differently orientated with respect to crystal axes in a cold range. Left: Basal plane with cold spot. Right: Prism plane with hot spot.. curve of the upper picture. In order to understand the mechanism of this phenomenon, the changes of pairs of the rubbed faces were observed under a polarizing microscope at the end of rubbing as indicated by an arrow in the figure. These results are shown in Fig. 4. In two sheets of photographs we can observe an interesting feature as follows. ( i ) As shown in the left. photograph the rubbed face of the basal plane with a cold spot is changed from the single crystal to the cellular pattern and abundant minute polycrystallines recrystallized with characteristic anisotropy. ( ii) Whereas, as seen in the right photograph, the prism plane with a hot spot is. not recrystallized into polycrystalline without the small amount of cellular pattern although its rubbed face is warmer than the rubbed face of the basal plane. Accordingly, it can be considered. that the reverse phenomenon is related to the change of the rubbed face of the basal plane with a cold spot into polycrystalline as pointed out in the previous paper (Shio and Magono : 1972). In order to further understand the correlation as described above, the experiments were repeated. (39).
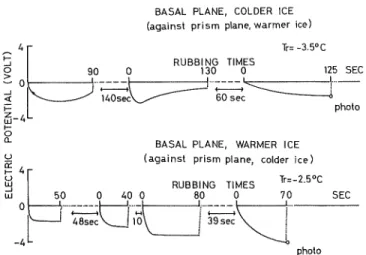
(7) H.SHIO. under a reverse combination with respect to temperature difference as against the preceding experiments. Namely, in these experiments the rubbed face of the prism plane becomes colder. than that of the basal plane with the lapse of rubbing time. The result obtained at ambient temperature of —17°C is shown in the lower picture of Fig, 3. After the first rubbing treatment,. the rubbing was stopped for 110 sec which was sufficiently long to allow for the refreezing of the liquid layer on the rubbed face with a hot spot, even when a part of its surface was partially melted due to the frictional heat. Moreover, when the rubbing was continued again with the same contact faces as the first rubbing treatment, the electric potential of the prism plane with a cold spot was reversed from positive to negative against the other plane at 130 sec from the beginning of the second rubbing. After the electric potential was reversed, these rubbed faces were studied under a polarizing microscope in order to observe the crystallogenic change on the. faces. The left photograph in Fig. 5 shows the rubbed face of the basal plane with a hot spot. We can observe that the basal plane was changed from a single crystal to a large quantity of. polycrystalline, whereas, as the right photograph shows in Fig. 5, it appears that the rubbed face of the prism plane with a cold had its characteristics of crystallization unchanged and took on a pattern of uniform fine streaks parallel to the shifting direction. In order to investigate the charging phenomenon in a warm range, many experiments were repeated. As a result, the following facts were obtained. The upper picture of Fig. 6 shows the. electric potential of the basal plane with a cold spot against the prism plane with a hot spot at an ambient temperature of —3.2°C. In the figure the rubbing treatment was repeated three times by making use of the same contact faces as before. The total rubbing times amounted to about 330 sec, which was sufficient to bring about a reverse phenomenon in the case of the rubbing by using pairs of contact faces identically orientated with respect to crystal axes. However, the basal. plane with a cold spot was always negatively electrified against the other during the rubbing, and its electric potential was about —1.2 volts at 10 sec from the beginning of rubbing In order to understand the reason why the reverse phenomenon did not manifest itself in these experiments, at the end of rubbing shown by an arrow in the upper picture, the pairs of rubbed faces were observed respectively under a polarizing microscope. As shown in the left photograph in Fig. 7,. it was observed that the rubbed face of the basal plane with a cold spot had not changed to. Fig. 5. Photomicrographs of rubbed faces differently orientated with respect to crystal axes in a cold range. Left: Basal plane with hot spot. Right: Prism plane with cold spot.. (40).
(8) Frictional Electrification of Single Ice Crystals BASAL PLANE, COLDER ICE (against prism plane, warmer ice) Tr=-3.5°C. 0 _J. 90 0. 0. RUBBING TIMES. 125 SEC. 130 0". <. photo. g-A h-. 0. a-. u ec. 'y. BASAL PLANE, WARMER ICE (against prism plane, colder ice). ^r. RUBBING TIMES "-"''••. 1°(. 80 0 70. -A>-. SEC. photo. Fig. 6. Charging curves are for two kinds of faces differently orientated with respect to crystal axes in a warm range.. 200 u Fig. 7. Photomicrographs of pairs of rubbed faces differently orientated with respect to crystal axes in a warm range. Left: Basal plane with cold spot. Right: Prism plane with hot spot.. polycrystalline, although a few blotches appear on the rubbed face. Whereas, as shown in the. right photograph of Fig. 7, the rubbed face of the prism plane with a hot spot is recrystallized into polycrystalline of which the average grain size corresponds to No. 5 in grain size number. In other words, the rubbed face of the prism plane which recrystallized into polycrystalline retains evidence of its past history in the electrical nature of the rubbed face. On the other hand, in reverse conditions regarding the temperature gradient between pairs of rubbed faces as compared with the above experiments, the experiments were carried out repea-. tedly. The lower picture in Fig. 6 shows the electric potential of the basal plane with a hot spot against the prism plane with a cold spot at an ambient temperature of —2.5°C. In this case, the reverse phenomenon did not appear though the charging process, even when pairs of ice specimens were rubbed together for a long time sufficient for bringing about the reverse phenomenon. in the case of rubbing by using pairs of contact faces identically orientated with respect to crystal axes. In other words the basal plane with a hot spot was always negatively electrified against the. (41).
(9) H. SHIO. other during rubbing. In regard to the relation between the sign of charge and the crystallographic anisotropy, these results were quantitatively of the same properties as those obtained. when the rubbed face of the basal plane was colder than that of the prism plane. At the end of rubbing (indicated by an arrow in the lower picture) the pairs of rubbed faces were observed under a polarizing microscope respectively. As shown in the left photograph of Fig. 8 although. the rubbed face of the basal plane became warmer than that of the prism plane by the asymmetric rubbing, and the shape of a hot spot is a circle with a radius of about 500 /um, the basal plane with a hot spot was not changed in to characteristics of crystallization except for a few central portions of its face. Whereas, as shown in the right photograph of Fig. 8, it may be observed that the. rubbed face of the prism plane with a cold spot was recrystallized from a single crystal to polycrystalline along the rubbing direction. Its grain size number is No. 5, which is analogous the. prism plane with a hot spot as shown in the left photograph of Fig. 8. According to the two results described above, in the warm range the recrystallization takes place in a reverse order with respect to two varieties of planes as compared with the cold range. Moreover, experiments of the same kind were repeated about 30 times in the middle range (around —5°C). As a result, the charging curves regarding the prism/basal show a minimal electric potential at —6°C, regardless of the temperature difference between the pairs of contact faces.. ^-^^^w. (•y.y^-r •)»'?.v..'^''. /,.,^^.;-.<'"..;v. i 20°!JL Fig. 8. Photomicrographs of rubbed faces differently orientated with respect to crystal axes in a warm range. Left: Basal plane with hot spot. Right: Prism plane with cold spot.. 4 . Measurement of temperature rise of the rubbed faces 4 . 1 Experimental apparatus and method of measurements. Regarding the frictional electrification, the basic problem is to the reasons why charge carriers move from one specimen to the other. The electrical properties (conductivity, dielectric relaxation time, dielectric constant, and thermoelectric power) are generally expressed as functions of the mobility and concentration of ionic defects and Bjerrum defects. And such characteristics are dependent upon the temperature of the specimen except for the mobility of ionic. defects which is believed to be temperature independent (tunnel effect). Hence in order to. (42).
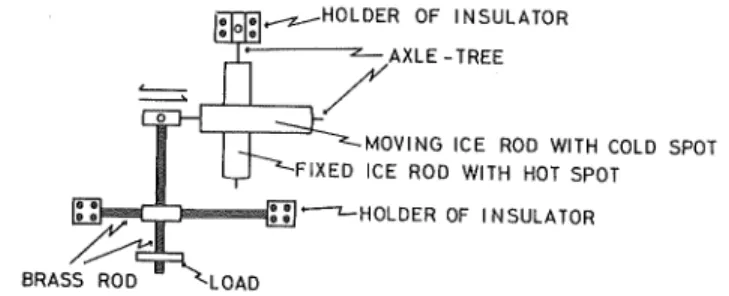
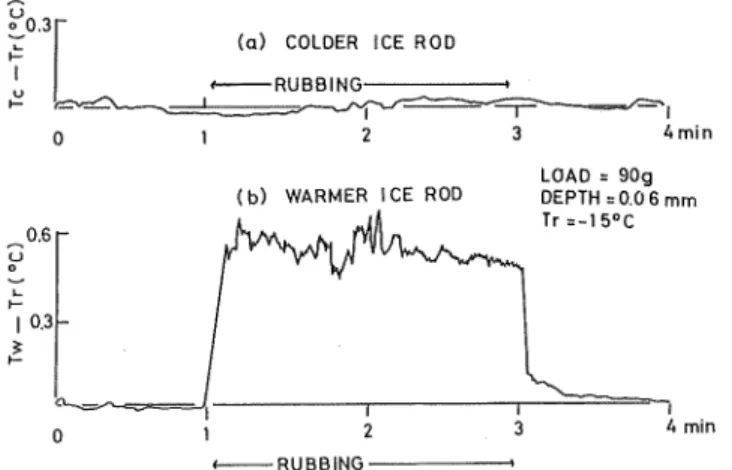
(10) Prictionat Electrification of Single Ice Crystals. HOLDER OF INSULATOR '.AXLE-TREE. •MOVING ICE ROD WITH COLD SPOT •FIXED ICE ROD WITH HOT SPOT -HOLDER OF INSULATOR BRASS ROD ~ ~<~LOAD. Fig. 9. Apparatus for investigating temperature difference between pairs of rubbed faces. understand the frictional electrification mechanism, it is very important to obtain exact measurements of the temperatures of the rubbed faces. However, the local temperature of the rubbed face has not been measured until very recently, excepting Latham (1963). Therefore in. this chapter the temperature rise on the rubbed face during rubbing is described in detail. At the beginning of experiments the ice specimens were produced from pure water in which the air bubbles were removed by boiling. As a result the specimens hardly contained any cracks.and were transparent ice. The orientation of the surface of the ice rod, being polycrystalline of which the average size of grains is about 5 mm in diameter, is generally perpendicular to C axis. The size of the specimen with a column shape is 3 cm in diameter and approximately 12 cm in length. The apparatus is shown in Fig. 9. The ice rods are fixed individually on insulators by a brass rod plated with nickel to be used as the axle-tree of the specimen. The methods of rubbing are the same as described before. The contact face can be situted directly above a sensitive point of thermocouple by rotating the axle-tree around the axis. The load applied on. the contact face of the lower ice rod by the upper movable ice rod and the metal weight can be changed from 80 to 150 g. In such an experiment, a very small rise of temperature of the contact face which is less than 1 mm in diameter should be measured, accordingly we paid special attention to the following points: In order to prevent an electric leakage phenomenon from the distribution wire connected to a thermocouple and to make the temperature of the thermocouple. close to that of the rubbed face, the distributing wires were shielded with glass tubes covered by aluminium foil and grounded, and a thin thermocouple with a radius of 50 m//m was used.. 4 . 2 Results and considerations.. The upper picture (a) in Fig. 10 shows the temperature rise (Tc—Tr) at a point 0.06 mm in depth from a cold spot against the rubbing time. The temperature rise (Tw—Tr) on the warmer ice side is shown in the lower picture (b) of the same figure. These experimental results were obtained at an ambient temperature of —15°C, and the rubbing of the ice rod was begun at 1 min and finished at 3 min on the horizontal time axis. Comparing the two curves, it is obvious that the temperature at 0.06 mm in depth from the cold spot was not affected very much during rubbing, but that of the hot spot was affected considerably. Moreover, with regard to the colder ice, even when the thermocouple was exposed to the rubbed face no particular temperature rise of the cold spot was recognized during rubbing. In other words, the temperature of a cold spot may. (43).
(11) H. SHIO. '0.3. (a) COLDER ICE ROD -RUBBING4min LOAD s 90g DEPTH =0.0 6 mm. (b) WARMER ICE ROD. Trs-15°C. •RUBBING. Fig. 10. Variation of difference between temperature at a depth of 0.06 mm from the rubbing face and ambient temperature versus rubbing time.. be almost the same as the ambient temperature. AMBIENT TEMPERATURE^) ^ In the case of warmer ice, the temperature rise. I. appears rapidly with the increase of rubbing times for a few seconds from the beginning of rubbing, whereas after the above periods the temperature rise becomes unform, and then the temperature of a hot spot becomes steady except. -Td. u 0. SJATT? 45°. </'. HJ. Tr. a 3. temperature rise at a certain depth varies in. Id. I-. of accuracy. For the above purpose, the author. attempted the following method as described in. §i. •<7-Tw3. LJ I. ^. 1§. s^t.Tw2s. Q-. M. /^"~f ^\._._._._.-p. /. /_. -Ti. UJ in ec's. -"0. Q.. proportion to that of a hot spot.. the temperature of a hot spot with a high degree. ATm. <. for the first periods of a few seconds because the. the contact faces. Thus it is necessary to know. TN. t3. Q: UJ. Most of the charged carries are generated on. 0>. ^. /TWI. Ly1ATt. /•' * I. ATm ai. I-. &Tm. JL. 0. 0 -To -(Ti-Td) -Ti. AMBIENT TEMPERATURE (°C). Fig. 11. Effect of ambient temperature on the temperature at a constant depth from the hot spot.. Fig. 11. In this figure the horizontal axis shows. the ambient temperature, the vertical axes on the left side and on the right side show the temperature and the temperature rise (AT) at a constant depth from a hot spot respectively.. The scale of the vertical axis of the left side is marked with the same intervals as that of the horizontal axis. Thus, when the contact faces are not rubbed together the temperature at a constant depth from the contact face against the ambient temperature is shown by a solid-line. (Tr) which is bevelled at 45 degrees to the horizontal axis. ( i )If the temperature of a hot spot becomes 0°C at the ambient temperature warmer than —To"C, a point of a constant depth from a spot, regardless of the change of the ambient temperature above —To"C, is held at constant temperature (~Td) as shown by twi-line with a solid line in this figure, hence the temperature. (44).
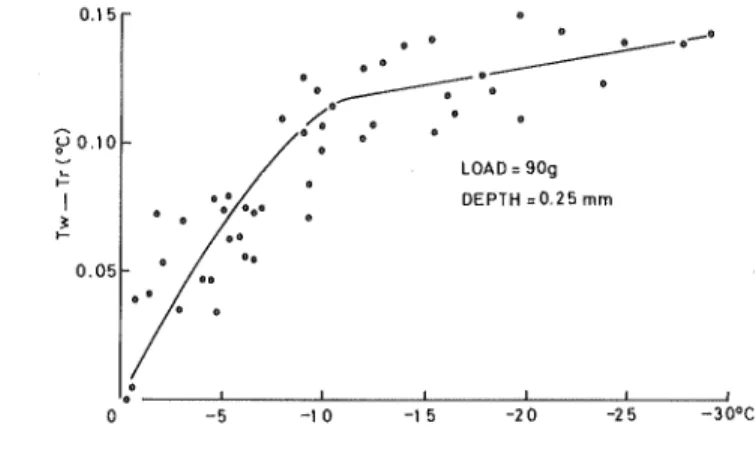
(12) Frictional EIectrification of Single Ice Crystals. rise (ATI) increases as the ambient temperature falls, as shown by LM with a dot-dash-line. (ii) In the ambient temperature colder than —T°C, if the temperature of a hot spot falls below 0°C and the temperature at a constant depth from a hot spot is only under the influence of the ambient temperature, the temperature at a constant depth from a hot spot is shown by Tw2-line with a. solid-line parallel to Tr-line, and the temperature rise will hold constant (ATm), regardless of the ambient temperature as shown by MP with a dot-dash-line. According to a simple theory pro-. posed by Bowden and Tabor (1954), even if the velocity of sliding and the load are constant, the temperature rise of a hot spot is inversely proportional to the thermal conductivity of the specimen and directly proportional to the coefficient of friction. About a specimen of ice, Nye and. Cheeseman (1975) have publised that in a velocity range from 0.2 to 10 m/s the magnitude of the coefficient of friction at an ambient temperature of —14°C is about 2 times that at —4°C, while. the thermal conductivity is not changed compared with the coefficient of friction (Raecliffe: 1962). Accordingly, the temperature at a constant depth from a hot spot depends not only on the ambient temperature but on the coefficient of friction. As a result, the temperature at a constant depth from a hot spot is shown by Twa-line with a solid-line, which has a smaller incline than that of Twz-line. Therefore, the temperature rise is shown by MQ line, the slope of which. is greater than that of MP line and smaller than that of LM line. The experimental results based on the above method are shown in Fig. 12. The vertical axis means the temperature rise at a point 0.25 mm in depth from a hot spot. The horizontal axis is the ambient temperature. In this figure it is obvious that the experimental results are represented by the line which is bent at the ambient temperature of about —10°C, as pointed out before. In other words, at the ambient temperatures from —10 to —30°C as the ambient temperature falls, the temperature rise increases as a line shown by a gentle slope, whereas at the ambient temperatures above —10°C the temperature rise increases rapidly with the ambient temperature. As a result, it may be considered that a certain amount of the total calorific by rubbing, which is constant regardless of the ambient temperatures, is used to make a hot layer of. y o.io. LOAD = 90g DEPTH =0.25 mm. 0.05. -25. -10. -30°C. Fig. 12. Variation of difference between temperature at a depth of 0.25 mm from the hot spot and ambient temperature versus changing of ambient temperature.. (45).
(13) H. SHIO. 0°C thickeness at the ambient temperatures above —lO^C or thereabouts because the difference between the temperature of a hot spot and the ambient temperature decreases rapidly from —10 to 0°C as the ambient temperature rises, and at the ambient temperatures below —10°C the difference increases only alightly as the ambhent temperature drops. Moreover, the temperature of a hot spot was estimated by using another idea as follows. On. the basis of Bowden and Tabor's formula (1954), when the load per contact face is changed from Wi to Wz, the temperature at the constant depth from a hot spot may vary from Tu,i to Tuo, and then the temperature difference (Tun—Taa) by a change of the load is (T»i-T^)=L(W//2-W21/2) were L = ^Vg(p,n^)l/2/4JK == const, and p. is the coefficient of friction, V the velocity, g the acceleration of gravity, p,,, the yield pressure, J the mechanical equivalent of heat, K the thermal conductivity. Provided Wi>Wz, Twi—Tua should also hold a positive value larger than zero. However, if its value is zero, it may be considered that the temperature of a hot spot becomes 0°C. under conditions that a hot spot is weighed not only by a heavier load (Wi) but also by a lighter load (W2). The experimental results based on this idea are shown in Fig. 13. In the figure the vertical axis indicates the temperature difference at a point 0.14 mm in depth from a hot spot when the load is 84 and 147g, respectively. At an ambient temperature range warmer than —6°C several experimental data show negative signs by some unknown factors (for example, regarding these factors, we may point out the difference of defacement based on the difference in the hardness of the surfaces of the specimens). Accordingly, it may be said that at the ambient temperatures above —6°C the temperature of a hot spot becomes 0°C under a load above 84g per contact face. On the basis of these two results as described above, in the cases of the experiments described in the previous chapter, where the load of 90g is added to the contact faces, it is reasonable to assume that the temperature difference between a hot spot and a cold spot may be about 8 deg at the ambient temperatures below —8°C or thereabouts and at the ambient temperatures above —8°C the higher the ambient temperature is, the smaller the difference is.. 0.25 0.20 0.1 5. u. 0.10. 9 ••. 0. ••. 0. ••• 0. 0. _, 0.05. h-. 9 9"6 0. 00. I 0 B® —^ Q •-^ -0. -0.05 -0.10. DEPTH =0.1A mm. •' ''•.'.. 9. 6. -10. -1 5. -20. -25°C. Tr. 0 0. Fig. 13. At a point of 0.14 mm in depth from the hot spot, the difference of temperatures when the load is changed from 84 to 197 g versus changing of ambient temperature.. (46).
(14) Frictional Electrification of Single Ice Crystals. Table 1. Signs of charging of ice specimens. i) Asymmetric rubbing between pairs of rubbed faces identically orientated with respect to crystal axes. Ambient temperature (°C ). Combination. -21--10. nearly— 6. +. 0. Prism plane. with cold spot. -3--1.2. (against) Prism plane. 0. with hot spot Basal plane. +. with cold spot. +. (poly). 0. (against) Basal plane. 0. with hot spot. +. (poly). ii) Asymmetric rubbing between pairs of rubbed faces differently orientated with respect to crystal axes. Ambient temperature (°C ) Combination. -21--10. nearly— 6. +"-^-. 0. Prism plane. with cold spot (against) Basal plane. (poly). with hot spot Prism plane. with hot spot. +^-. 0. -^ -)-. 0. (poly). with cold spot. (poly). 0. (against) Basal plane. -3--1.2. +. (poly). 5. Discussion 5 . 1 Relation between the charging and the temperature difference. In order to clearly arrange the relation between the charging phenomenon of ice by asymmetric rubbing and the temperature gradient theory (Latham and Mason: 1961 a), the thermoelectric power built between the pairs of rubbed faces was calculated by using the experimental results described in the previous chapters. Namely, in the author's case, the thermoelectric power is the amount of the potential difference divided by the temperature differerence between the pairs of rubbed faces at 10 sec from the beginning of rubbing. These results are shown in. Fig. 14. In this figure the thermoelectric power of the prism plane against the basal plane is shown by a solid line with a small circle, while that of the basal plane against the prism plane is shown by a solid line with a small black circle. Two curves are asymmetric with respect to the horizontal axis. It is considered that the temperature difference has little or no influence on the charging process because the curve of the basal plane is always described in a negative range.. (47).
(15) H. SHIO. -15 -20._ . -23. OOM TEMPERATURE(°C). Fig. 14. Thermoelectric power versus ambient temperature. Solid line with white small circle: Prism plane/Basal plane. Solid line with black small circle: Basal plane/Prism plane. Dotdash line: Pairs of prism planes. Broken line: Pairs of basal planes.. On the other hand, for the purpose of reference standards the experimental results about the pairs. of faces identically orientated with respect to the crystal axes is described in this figure. At —6°C or thereabouts the magnitude of the thermoelectric power becomes nearly zero with electrical properties which are common in the case of the rubbing between pairs of faces differently orientated with respect to the crystal axes, and in the case of faces "identically orientated with respect to the crystal axes. This seems to suggest that the charge carriers are the difference between an ambient temperature below —6°C and an ambient temperature above —6°C. In the case of faces differently orientated with respect to the crystal axes at an ambient temperature excepting about —6°C these curves suggest that the prism plane is always charged positive against the basal plane, regardless of the temperature gradient. An important characteristic. stated above is too complicated to explain briefly on the basis of the theories suggested by Lathem et al (1961 a), Jaccard (1963), and Takahashi (1966). In the case of pairs of faces identically orientated with respect to the crystal axes, as the ambient temperature rises above —6°C the sign of thermoelectric power changes from positive into negative. What is obvious when comparing a curve of pairs of prism planes and that of basal planes is that at an ambient temperature. of —lO'C the thermoelectric power with the prism planes was larger than that with the basal planes. However, at ambient temperatures above —6°C this tendency was reversed. The resuits described above show a very similar tendency qualitatively when compared with Takahashi's results. However, at ambient temperatures above —10°C the magnitude of thermoelect-. ric power plotted by using the temperature difference built by the asymmetric rubbing was about 100 mV/°C, which was 100 times that of Takahashi's experimental results made by a different method. Accordingly it will be seen that the charging mechanism of the thermoelecric power obtained by asymmetric rubbing is quite different from that suggested by Takahashi. In the two types of results described above, it may be generally recognized that the temperature difference. (48).
(16) Frictional Electrification of Single Ice Crystals. is not the primary factor, but merely a secondary factor to the charging phenomenon brought. about by rubbing because the prism/basal charging was very large as compared with the charging by using two similar crystal faces.. 5 . 2 Relation between the charging and the crystallographic characteristics of the surface. In order to select the leading role in frictional electrification, experimental results are summarized in Table 1. From the table, it can be seen that the sign of charge is dependent on the difference of properties between pairs of rubbed faces in the order of main causes as follows: i ) Whether the new grains were recrystallized on the rubbed faces or not, ii) the presence or absence of the crystallographic anisotropy, and iii) the temperature difference. The charge. separation of ice is generally based on the formation and migration of three different types of point defects, namely, the ionic defects, the Bjerrum defects which consist respectively of doubly occupied bonds (D) and empty bonds (L), and Bjerrum defects with an interstitial molecule (DI and LI). It may be considered that the above three factors have some effects upon the formation and. migration of these point defects. It is generally recognized that the rubbed face is easily deformed plastically by the frictional force, being similar to the shearing stress which is stronger than the substance elasticity limit. Recently, Mae and Higashi (1973) considered that in order to explain the effect of plastical deformation to the dielectric relaxation of ice the dislocation should be separated into the dislocation-jog charged negatively and Hg0+. Using the above suggestion,. a part of the author's results may be explained qualitatively in the following way: i ) About the rubbing between pairs of contact faces identically orientated with respect to the crystal axes, as. a hot spot may be deformed plastically to a higher degree than a cold spot, a hot spot may be degenerated into an abnormal layer in which an excess dislocation consists, a part of this dislocation may be separated into a dislocation-jog charged negatively and HgO'1'; and HaO'*' may be moved more readily from a hot spot to a cold spot than the dislocation-jog due to the greater. mobility of Ha0+ as against that of the dislocation-jog. As a result a cold spot is positively electrified against a hot spot. ii) About the rubbing between pairs of contact faces differently orientated with respect to the crystal axes, at an ambient temperature below —10°C a basal plane. may be easily deformed plastically in contrast to the prism plane by rubbing, with a similar reason described above; the charge carriers are more intensely originated at a basal plane deformed. plastically than at a prism plane being the normal layer. As a result a prism plane is positively electrified against a basal plane. However, if a number of new crystals or grains grow at the. expens of the old ones deformed plastically, the movement of dislocation would be hindered by the grain boundaries of polycrystalline, and a lot of dislocation can be accumulated around the grain. boundaries. It is estimated that the piled-up groups of dislocation are formed at the grain boundaries by an activation energy lower than that of cross-slip, the charged jogs can not be formed around the grain boundaries where the absence of cross-slip is, since the jogs are commonly formed by the local cross-slip of screw segments during plastic deformation. As a result the interstitial water molecules or vacancies are originated spontaneously by interacting with the groups of dislocations piled-up around the grain boundaries. Onsager and Runnels (1963) pointed out a connection between the formation and migration of the Bjerrum defects and the diffusion of. (49).
(17) H. SHIO. interstitial water molecules or vacancies on the ice lattice, and they discussed how the formation and migration of vacanicies may facilitate the formation of the Bjerrum defects. As a result, it may be generally assumed that the excess Bjerrum defects, the excess DI and LI defects are generated in the abnormal layer of the interior of the rubbed face recrystallized into polycrystalline. These defects may be diffused from the abnormal layer into the other normal layer with a. single crystal. Jones and Glen (1969) found that the ice specimen which contained excess L defects by doping with HF was softer than the pure ice specimen, and the ice specimen containing excess D defects by doping with NHg appeared to be harder than the pure ice specimen.. They attributed the softening to the formation and the migration of excess L defects, and suggested that the excess D defects did not cause a softening effect because D defects were nonmobilized by dislocations. Accordingly, the excess L and LI defects are more migratory than. the excess D and DI defects nonmobilized by dislocation in nature. Hence it follows that the rubbed face with a single crystal, which rapidly acquired more excess L and LI defects of negative charge carrier than excess D and DI defects of positive charge carrier from the recrystallized face, are charged negatively, while the recrystallized face, in which a lot of excess D defects remained, is charged positively. On the basis of the above concept, not only the charging in a warm range but the reversal phenomenon in a cold range may be well explained. At an ambient temperature of nearly —6°C, it can be considered that the electric potential drops abruptly due to the influence of two kinds of charging mechansim with reversal charactenstics.. Acknowledgements The author wishes to thank Professor C. Magono for his many helpful discussions and suggestions during this work.. References Bowden.F.P., and D.Tabor, 1954: The friction and lubrication of solids. I, Clarendon Press, Oxford. 1-391. Coehn.A., and U.Raydt, 1909: Uber die quantitative gultigkeit des Ladungs-gesetzes fur Dielektrika. Ann. Physik., 30, 777-804. Evans.D.D.B., J.F.,Nye and K.J.Cheeseman, 1976: The kinetic friction of ice. Proc. Rmv. Soc.. A. 347. 497-512. Glen.J.W., 1968: The effect of hydrogen disorder on dislocation movement and plastic defonnation of ice. Phys. Kondens. Materie., 7, 43-51. Granicher.H., 1963: Properties and lattice imperfection of ice crystals and the behaviour of HaO-HF solid solutions. Phys. Kondens. Materie.. I. 1—12. HartJ., Y.M.Huang and D.T.Schnitzler, 1975: The frictional charging of metals by a cargon dioxide spray. Brit.j.Appl. Phys., 8, 1941-1947. Jaccard.C., 1963: Thermoelectric effect in ice crystals. Phy. Kondens. Materie., 1, 143—151. Jones.S.J., and SJ.Glen, 1969: The inechanical properties of impure ice. Phil. Mag., 19, 13-24. Latham,.!., and B.J.Mason, 1961 a: Electric charge transfer associated with temperature gradients in ice. Proc. Roy. Soc., Land, A, 260, 523-536. LathamJ., 1963: Electrification produced by the asymmetric rubbing of ice on ice. Brit. J. Appl. Phy., 14, 488— 490.. (50).
(18) Frictional Electrification of Single Ice Crystals Mae,S., and A.Higashi, 1973: Effects of plastic deformation on the dielectric properties of ice. Cryst. Lattice Defects., 4, 295-308. Magono,C., and H.Shio, 1966: Frictional electrification of ice and change in its contact surface. Physics of Snow and Ice, 1, 137-150. Magono.C., and T.Takahashi, 1963: Experimental studies on the mechanism of electrification of graupel pellets. J. Meteor. Soc., Jap., 14, 147-210. Onsager.L., and L.K.Runnels, 1963: Mechanism for self-diffusion in ice. Proc. Nat. Acad. Sci., U.S. 50, 208-210. Orowan.E., 1940: Problems of plastic gliding. Proc. Phys. Soc.,Lond, 52, 8-22. Peterson,W., 1949: The influence of piezo-electrification on tribo-electrification. Phys. Rev., 76, 1882—1883. Rarcliffe,E.H., 1962: The thermal conductivity of ice. Brit. J. Appl. Phys., 1197-1203. Shaw.M.A., and R.F.Hanstock, 1930 a: on surface strain and relaxation of like solids. Proc. R. Soc., A, 128, 474— 487. Shio.H., and C.Magono, 1971: Frictional etectrification of polycrystatline and single ice crystals. J. Meteor. Soc.Jap., 50, 159-165. Takahashi.T., 1966: Thermoelectric effect in ice. J. Atoms, soi., 23, 74-77. Takahashi.T., 1969: Electric potential of a rubbed ice surface. J. Atmos. Sci., 26. 1256-1269. Yosida.Z., 1944: On the change generation by friction and destruction of ice, and thunder generation. Teion Kagaku., 1, 149-187.. (51).
(19)
図


+7


関連したドキュメント
Keywords: continuous time random walk, Brownian motion, collision time, skew Young tableaux, tandem queue.. AMS 2000 Subject Classification: Primary:
Related to this, we examine the modular theory for positive projections from a von Neumann algebra onto a Jordan image of another von Neumann alge- bra, and use such projections
Answering a question of de la Harpe and Bridson in the Kourovka Notebook, we build the explicit embeddings of the additive group of rational numbers Q in a finitely generated group
We show that for a uniform co-Lipschitz mapping of the plane, the cardinality of the preimage of a point may be estimated in terms of the characteristic constants of the mapping,
Then it follows immediately from a suitable version of “Hensel’s Lemma” [cf., e.g., the argument of [4], Lemma 2.1] that S may be obtained, as the notation suggests, as the m A
Applications of msets in Logic Programming languages is found to over- come “computational inefficiency” inherent in otherwise situation, especially in solving a sweep of
Our method of proof can also be used to recover the rational homotopy of L K(2) S 0 as well as the chromatic splitting conjecture at primes p > 3 [16]; we only need to use the
Shi, “The essential norm of a composition operator on the Bloch space in polydiscs,” Chinese Journal of Contemporary Mathematics, vol. Chen, “Weighted composition operators from Fp,
