論 文 の 内 容 の 要 旨
論文題目 Identification of a novel p53 target, COL17A1, that inhibits breast cancer cell
migration and invasion
(乳がんの浸潤転移を抑制する新規p53下流遺伝子COL17A1の同定)
氏 名 ヨードスラーン ワラーリー
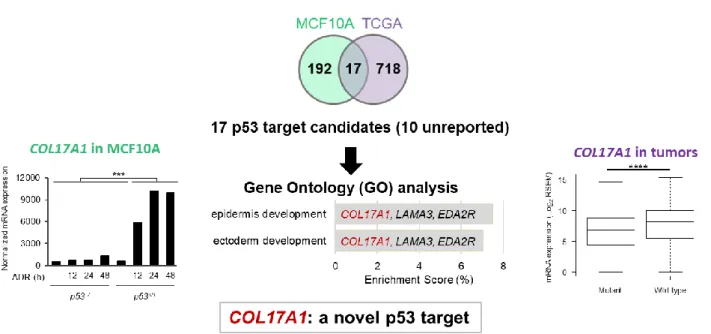
p53 mutation is a marker of poor prognosis in breast cancers. To identify downstream targets of p53, we screened two transcriptome datasets, including cDNA microarrays of MCF10A breast epithelial cells with wild-type p53 (p53+/+) or p53-null
background (p53−/−), and RNA sequence analysis of breast invasive carcinoma (Figure 1). MCF10A p53+/+ and p53−/− cells
were treated with 0.5 μg/ml of doxorubicin (Adriamycin®, ADR). Total RNA was isolated at 12, 24, and 48 hours after ADR
treatment and then subjected to cDNA microarray analysis. We identified 209 genes that were up-regulated more than 3-fold (P < 0.05) at 12, 24, or 48 hours after ADR treatment in MCF10A p53+/+ cells compared to MCF10A p53+/+ cells without ADR
treatment or MCF10A p53−/− cells at any timepoint. Second, we used the data obtained from a breast invasive carcinoma cohort
(BRCA), TCGA. We selected 735 genes that were up-regulated more than two-fold (P < 0.05) in breast cancer tissues with wild-type p53 compared to those with mutant p53 (Figure 1). The 17 overlapping genes from the two analyses were further investigated for enriched biological process using Gene Ontology (GO) enrichment analysis. Epidermis development and ectoderm development, which COL17A1 participates, were the most and second most significantly up-regulated GO terms by wild-type p53 (Figure 1). The COL17A1 results from the screening are shown in Figure 1.
Figure 1. The p53 targets were screened using MCF10A microarray and invasive breast carcinoma (TCGA). A Venn diagram shows the number of genes from the analyses. GO biological processes of the 17-overlapping genes with P < 0.05 and enrichment score > 5% are shown in the bar chart with indicated participating genes. Graphs show the results of COL17A1 mRNA expression from the two analyses. Two-tailed Student’s t-test; ***P < 0.001, ****P < 0.00024 (0.05/209).
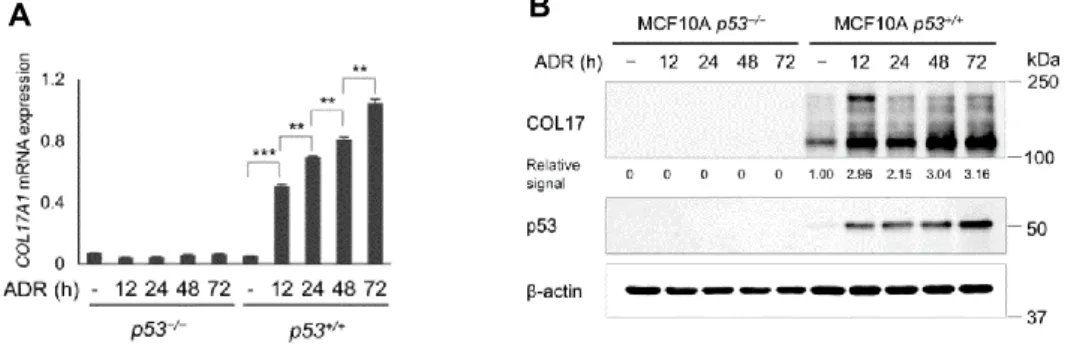
Next, we verified the induction of mRNA and protein expression of COL17A1 in MCF10A p53+/+ cells at several
points of time after ADR treatment (Figure 2A and B). The qPCR and western blot analyses supported the screening results that COL17A1 expression was regulated by p53.
Figure 2. A. The relative mRNA expression of COL17A1 in MCF10A p53+/+ or p53−/− cells, with or without ADR; times (hours)
indicate period after ADR treatment. B. Western blot analyses of COL17 (protein of COL17A1) and p53 in cells treated as in Figure A. Two-tailed Student’s t-test; *P < 0.05, **P < 0.01, ***P < 0.001.
We further investigated the relationship between COL17A1 and p53 using p53 wild-type breast cancer cells and mouse breast tissues. Consistent with p53 expression, COL17A1 mRNA and protein expression levels were significantly induced by ADR, and this induction was diminished by sip53 in HBC4 cells (Figure 3A). We detected both the 180-kDa full-length form of COL17 and its 120- kDa extracellular C-terminal domain (ectodomain) in the cell lysates, whereas only the 120-kDa form was detected in the media. In the mouse experiment, 10-week-old p53+/+ and p53−/− mice were exposed to 10 Gy X-ray
irradiation. The COL17A1 mRNA and protein levels were significantly induced by X-ray in p53+/+ but not p53−/− mice (Figure
3B-C).
Figure 3. A. The mRNA and protein level of COL17A1 at 48 hours after ADR in HBC4 cells transfected with siRNA of EGFP or p53, with or without ADR treatment; n = 3. B. The relative mRNA expression of Col17a1 in mouse mammary tissues of p53−/− or p53+/+ mice at 24
hours after X-ray; with or without X-ray; n = 3. C. Immunohistochemistry of mammary tissues staining with anti-COL17; n = 3 mice per group. Images were obtained at 10× magnification. Two-tailed Student’s t-test; *P < 0.05, **P < 0.01, ***P < 0.001.
To examine whether COL17A1 is a direct target of p53, we surveyed the genomic sequence of the COL17A1 and found two putative p53 binding sites, BS1 and BS2, within the first intron (Figure 4A). The luciferase activity of the BS construct
A
B
B
C
A
was markedly enhanced by co-transfection with wild-type p53 but not with mutant p53 (p53R175H) (Figure 4B). Mutation of each binding site, MT1 and MT2, significantly reduced the luciferase activity compared to that of BS. When two binding sites had been mutated (MT1+2), the luciferase activity was entirely drop to the control level (Figure 4B), suggesting the complete deletion of p53 binding. ChIP assay using HBC4 cells with or without ADR treatment, after precipitation with an anti-p53 antibody, a DNA fragment containing p53 binding sites was quantified by qPCR using COL17A1 BS primers. The results indicated that the endogenous wild-type p53 significantly binds stronger to COL17A1 in ADR-treated cells compared to non-treated cells (Figure 4C).
Figure 4. A. Genomic COL17A1 indicates potential p53 binding sites (BS1, BS2) in the BS construct. TSS, transcription start site. B. Luciferase assay of the BS construct, the mutated constructs, and the empty vector (pGL4.24) co-transfected with control vector (pcDNA3.1), wild-type p53, or mutant p53. C. ChIP assay of HBC4 cells, IP with the indicated antibodies followed by qPCR. Two-tailed Student’s t-test; *P < 0.05, **P < 0.01, ***P < 0.001.
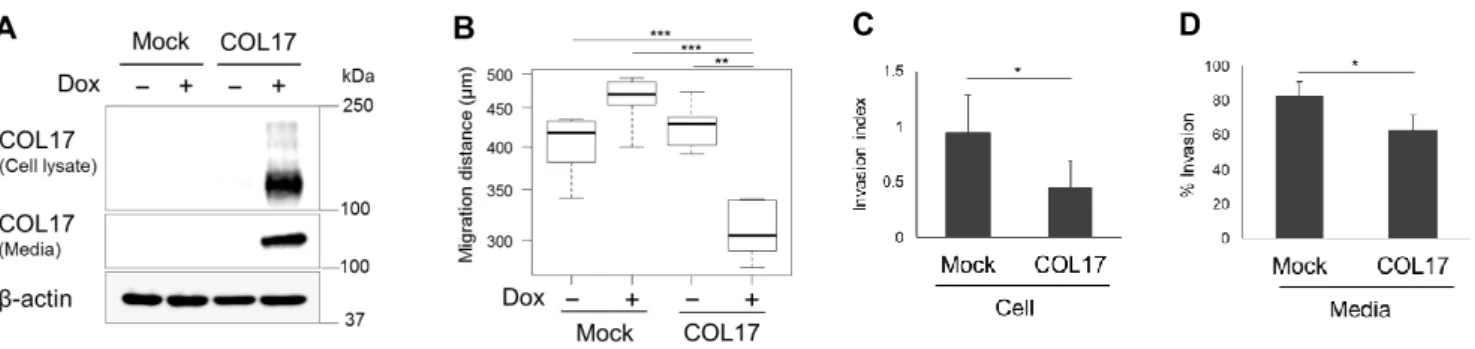
Regarding the known function of COL17A1 protein (COL17) as a cell-matrix adhesion molecule, we examined its role in tumor metastasis using a highly invasive MDA-MB-231 cell line expressing mutant p53. We generated MDA-MB-231 cell stably expressing COL17 in the presence of doxycycline (Dox+) and control cells (mock) using the tetracycline-regulated lentiviral expression system (Figure 5A). The COL17-expressing cells exhibited significantly decreased migration (Figure 5B) and invasion (Figure 5C) in vitro compared to the non-producing cells. The secreted ectodomain form of COL17 also suppressed the invasion of adjacent cells demonstrated by the invasion assay of parental MDA-MB-231 cells with conditioned media harvested from the stable cell culture dishes (Figure 5D).
Figure 5. MDA-MB-231 cell line stably overexpressing COL17 and mock cells were not treated (Dox−) or treated with 1 μg/mL of doxycycline (Dox+) for 48 hours before analysis. A. Western blot of the cell lysates and media extract blotting with anti-Collagen XVII. B. Scratch assay of stable cells migrating for 24 hours. Box plot shows the average of migration distance; n= 6. C. Invasion assay of stable cells analyzed at 24 hours after plating. The invasion index displays a proportion of the % invasion for the Dox+/Dox− condition. D. Media assay using parental MDA-MB-231 cells plated with conditioned media harvested from the stable COL17 or mock cell culture dishes. The parental cells invasive ability was displayed as the % invasion through the Matrigel over the control. Two-tailed Student’s t-test; *P < 0.05, **P < 0.01, ***P < 0.001.
BS1 BS2
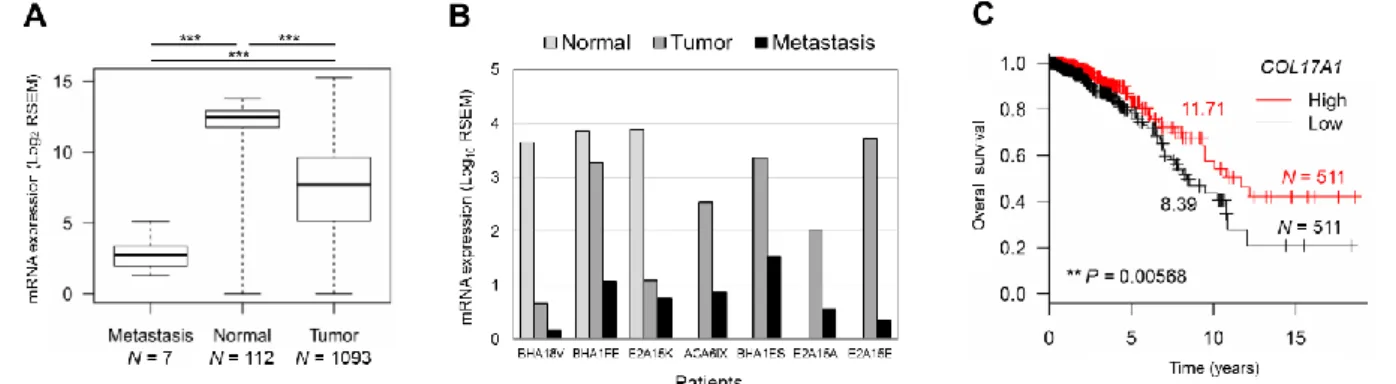
We also analyzed the relation of COL17A1 expression and tumor progression in breast cancer patients using TCGA data. The COL17A1 expression was decreased in metastatic tumors compared to primary tumors and normal tissues (Figure 6A), even from the same patients (Figure 6B). Moreover, high COL17A1 expression was associated with longer survival of patients with invasive breast carcinoma (Figure 6C). In summary, we elucidate the role of COL17A1 as a breast tumor metastasis suppressor by inhibition of cancer cell migration and invasion leading to better prognosis.
Figure 6. A and B. The mRNA expression of COL17A1 in metastatic, normal, and tumor tissues from all patients (A) and from the seven patients with metastasis (B). C. Kaplan-Meier survival curve of patients with high (red) and low (black) expression of COL17A1 compared to median expression. Number, median survival time (years). N, number of patients. P-value was assessed by log–rank test.
In conclusion, we revealed that COL17A1 is a novel p53 transcriptional target in breast tissues that inhibits cell migration and invasion and is associated with better prognosis.