Corresponding author: Tomomitsu Matono, MD, PhD [email protected]
Received 2018 November 30 Accepted 2018 December 25
Abbreviations: Apo, apolipoprotein; ALT, alanine aminotransfer-ase; ATF, activating transcription factor; AP-1, activator protein-1; Chop, C/EBP homologous protein; C-jun, jun proto-oncogene; Col1a1, collagen pro-alpha-1 type I chain; CYP2E1, cytochrome P450 2E1; DAPI, 4’,6-diamidino-2-phenylindole; eIF2α, eukary-otic initiation factor 2α; ER, endoplasmic reticulum; FLS mice, fatty liver Shionogi mice; FLS-ob/ob mice, fatty liver Shionogi ob/ob mice; JNK, c-Jun NH2-terminal kinase; NAFLD, nonal-coholic fatty liver disease; NASH, nonalnonal-coholic steatohepatitis; n.s., not significant; NUPR1, nuclear protein-1; PCR, polymerase chain reaction; PERK, pancreatic ER kinase; PPAR-α, peroxi-some proliferator-activated receptor α; SREBP, sterol regulatory element binding protein; TG, triglycerides; TGF-β1, transforming growth factor-β1; TIMP-1, tissue inhibitor of metalloproteinases-1; TNF-α, tumor necrotic factor-α1; TUNEL, terminal deoxynucle-otidyl transferase dUTP nick end labeling; UPR, unfolded protein response
Gene Expression Analysis of the Activating Factor 3/Nuclear Protein 1 Axis in a
Non-alcoholic Steatohepatitis Mouse Model
Ran Nagahara,* Tomomitsu Matono,* Takaaki Sugihara,* Yukako Matsuki,* Masafumi Yamane,* Toshiaki Okamoto,* Kenichi Miyoshi,* Takakazu Nagahara,* Jun-ichi Okano,* Masahiko Koda* and Hajime Isomoto*
*Division of Medicine and Clinical Science, Department of Multidisciplinary Internal Medicine, School of Medicine, Tottori University Faculty of Medicine, Yonago 683-8504, Japan
ABSTRACT
Background Nonalcoholic fatty liver disease/steato-hepatitis (NAFLD/NASH) is a chronic liver disease related to metabolic syndrome that can progress to liver cirrhosis. The involvement of the endoplasmic reticulum (ER) stress response in NAFLD progression and the roles played by activating factor 3 (ATF3) and the downstream nuclear protein 1 (NUPR1) are poorly understood. The aim of this study was to determine the gene expression profiles around the ATF3/NUPR1 axis in relation to the development of NAFLD using novel mouse models.
Methods Fatty liver Shionogi (FLS) mice (n = 12) as a NAFLD model and FLS-ob/ob mice (n = 28) as a NASH model were fed a standard diet. The FLS mice were sacrificed at 24 weeks of age as a control, whereas the FLS-ob/ob mice were sacrificed at 24, 36, and 48 weeks of age. Hepatic steatosis, inflammation, and fibrosis were evaluated by biochemical, histological, and gene expression analyses. The expression levels of the ER-stress related genes Jun proto-oncogene (C-jun), Atf3, Nupr1, and C/EBP homologous protein (Chop) were measured in liver tissue. Apoptosis was evaluated by terminal deoxynucleotidyl transferase dUTP nick end
labeling (TUNEL) staining.
Results Control mice demonstrated hepatic steatosis alone without apparent fibrosis. On the other hand, FLS-ob/ob mice showed severe steatohepatitis at both 24 and 36 weeks of age and severe fibrosis at both 36 and 48 weeks of age. The expression levels of Atf3, Nupr-1, and C-jun significantly increased from 24 to 48 weeks of age in FLS-ob/ob mice compared with control mice. The expression level of Chop was already high in FLS mice and maintained similar levels in FLS-ob/ob mice; the expression level was consistent with the percentage of TUNEL-positive cells.
Conclusion The ATF3/NUPR1 axis plays a pivotal role in NASH progression in association with C-jun and Chop and appears to induce apoptosis from early steato-sis in the NASH model mice.
Key words endoplasmic reticulum stress; mouse model; nonalcoholic fatty liver disease; nonalcoholic steatohepatitis
Nonalcoholic fatty liver disease (NAFLD) has emerged as a common public health problem in recent decades. The prevalence of NAFLD ranges from 30% to 46% in Western countries1 and is increasing in the Asia-Pacific
region.2 Although the underlying mechanisms leading
to the development of NAFLD have been discovered through the efforts of researchers, they are not fully understood.3, 4
The mechanism of endoplasmic reticulum (ER) stress was unveiled by Kazutoshi Mori and Peter Walter in the 1990s.5, 6 ER stress is activated to regulate protein
synthesis and restore homeostatic equilibrium when the cell is stressed due to the accumulation of unfolded or misfolded proteins. However, delayed or insufficient re-sponses to ER stress turn physiological mechanisms into pathological consequences, including fat accumulation, insulin resistance, inflammation, and apoptosis. Through their remarkable contributions to this field, many re-searchers have elucidated that ER stress induces various types of diseases.7 Some studies have also demonstrated
a pivotal role in both the development of steatosis and the progression to steatohepatitis.8, 9 Therefore,
under-standing of the role of ER stress in the pathogenesis of NAFLD has become a topic of intense investigation.10
Under a chronic imbalance between energy supply and demand in fatty liver, toxic lipids activate cellular stress pathways. The accumulation of unfolded or mis-folded proteins in the ER usually triggers an adaptive response aimed at resolving ER stress, the unfolded pro-tein response (UPR). The UPR is mediated by at least three different stress-sensing pathways, including pan-creatic ER kinase (PERK), inositol-requiring enzyme 1, and activating transcription factor 6 (ATF6).11
Among the ATF family members, ATF4 is down-stream of PERK and eukaryotic initiation factor 2 alpha.12 ATF3 is also a downstream target of ATF4 and
acts as a hub of the cellular adaptive-response network.13
ATF4 activates the transcription factor nuclear protein 1 (NUPR1) (also known as p8/Com-1), which regulates the expression of metabolic stress-responsive genes, especially those involved in DNA repair and cell cycle regulation.14 Previous studies have indicated that ATF3
is highly expressed when the cells are exposed to stress signals.13, 15NUPR1 is also considered one of the
down-stream genes of ATF3.16 The encoding gene, Nupr1, is
overexpressed in the liver of NAFLD model mice on microarray analysis.17 However, the role of the ATF3/
NUPR1 axis in NFLD progression is not known.
We have previously reported that the fatty liver Shionogi (FLS) mouse and FLS-ob/ob mouse are good models for NASH study.18 FLS mice show
hypertri-glyceridemia from birth and develop chronic fatty liver (hepatic steatosis) without obesity under normal conditions. The hypertriglyceridemia and the fatty liver in the FLS mice is assumed to be caused by a decreased level of Apo-CII and increased level of Apo-CIII in plasma.19 In addition, FLS-ob/ob mice show
hyperpha-gia, obesity, hyperlipidemia, and diabetes mellitus and have histologically proven severe liver steatosis and fibrosis. Interestingly, FLS mice and FLS-ob/ob mice also develop liver cancer at 36 and 48 weeks of age.18, 20
NUPR1 has been reported to be related to liver cancer as well.21, 22 Determination of the role of NUPR1 in NAFLD
progression could additionally shed light on carcinogene-sis in NASH. For these reasons, we focused on the role of the ATF3/NUPR1 axis in ER stress.
In this study, we aimed to determine the gene ex-pression profiles around the ATF3/NUPR1 axis during the development of NAFLD using these novel mouse NAFLD/NASH models.
MATERIALS AND METHODS Animals
Male FLS (n = 12) and FLS-ob/ob (n = 28) mice were obtained from Shionogi Research Laboratories (Shiga, Japan). The animals were housed in a room maintained at a controlled temperature of 24 ± 2 °C under a 12-h light-dark cycle. Animals were allowed ad libitum access to standard pellet chow and water. All experi-ments were carried out in accordance with the Animal Experimentation Guidelines of Tottori University. At 24, 36, and 48 weeks, the animals were killed under pentobarbital anesthesia and blood was collected from the right ventricle. The animal numbers in the various experimental groups were as follows: 12 in the 24-week-old FLS mouse group, 9 in the 24-week-24-week-old FLS-ob/ob mouse group, 10 in the 36-week-old FLS-ob/ob mouse group, and 9 in the 48-week-old FLS-ob/ob mouse group. FLS mice of the 24-week-old group were defined as the control simple steatosis model. Plasma samples were frozen and stored at –80 °C. The liver and visceral fat were also collected, weighed, immediately frozen in liquid nitrogen, and stored at –80 °C. Liver specimens were fixed in 10% buffered formalin and embedded in paraffin for histological analysis.
Biochemical analyses
Blood samples were immediately separated via cen-trifugation at 2000 × g for 15 min and stored at –80 °C until further assay. Serum samples were analyzed to determine the levels of alanine aminotransferase (ALT), triglyceride (TG), and total cholesterol.
Histological analysis
Sections (4 μm thick) of formalin-fixed, paraffin-embedded liver were stained with Sirius red and hema-toxylin and eosin. The areas of hepatic fibrosis and of lipid droplets were measured in five randomly selected fields/section (magnification ×100) for each specimen using Win ROOF version 5.71 (Mitsutani Co., Tokyo, Japan).
Terminal deoxynucleotidyl transferase dUTP nick end labeling staining
A fluorescent terminal deoxynucleotidyl transferase dUTP nick end labeling (TUNEL) assay (In Situ Cell Death Detection Kit; Roche, Basel, Switzerland) was used on tissue sections. Sections were paraformaldehyde-fixed and hydrated. We randomly selected five repre-sentative slides from each group. The TUNEL assay was then performed according to the manufacturer’s protocol. Staining for negative controls was performed without enzyme on the slides of control mice and
FLS-ob/ob mice at 24 weeks of age. Slides were mounted with ProLong Antifade (Invitrogen–Molecular Probes, Carlsbad, CA) containing 4’,6-diamidino-2-phenylindole (DAPI). The slides were analyzed using a fluorescent microscope (BZ-X710; Keyence, Osaka, Japan). Dead cells were quantified by counting TUNEL-positive nu-clei in 10 random microscopic fields (×20).
Hepatic cholesterol content analysis
Snap-frozen liver (50 mg) was homogenized and ex-tracted using a chloroform-methanol (2:1 v/v) mixture. Then, the organic phase was dried and solubilized in 2-propanol containing 10% Triton X-100. Total choles-terol was determined using commercial enzymatic kits (Cholesterol E-test; Wako Pure Chemical Industries, Osaka, Japan).
RNA extraction and reverse transcription
Tissue samples were homogenized, and total RNA was extracted using an RNeasy Mini Kit (Qiagen, Hilden, Germany). RNA concentration was determined by the absorbance at 260 nm, and the RNA quality was verified by electrophoresis on ethidium bromide-stained 1% aga-rose gels. Total RNA (~2 μg) was then reverse-transcribed in a final volume of 11.5 μL containing 4 μL of 5× standard buffer, 2 μL of 0.1 M dithiothreitol, 1 μL of SuperScript II RNase H reverse transcriptase (Invitrogen), 2 μL of 10 M dNTPs (Promega, Madison, WI), 1 μL of 50 pmol/μL Random Primer (Promega), 0.5 μL of 100 pmol/μL Oligo (dt)15 Primer (Promega), and 1 μL of 40 U/μL ribonuclease inhibitor (Wako Pure Chemical Industries). Samples were then incubated at 37 °C for 60 min and 95 °C for 5 min and cooled to 4 °C for 5 min. Table 1. The primer lists used for Real time PCR
Primer sequence (5’–3’)
Gene GenBank Accession no. Forward Reverse
Tgfb1 NM_011577 TGGAGCAACATGTGGAACTC GTCAGCAGCCGGTTACCA
Col1a1 NM_007742 ACCTAAGGGTACCGCTGGA TCCAGCTTCT CCATCTTTGC
Timp1 NM_001044384 GCAAAGAGCTTTCTCAAAGACC AGGGATAGATAAACAGGGAAACACT
Tnfa NM_013693 CTGTAGCCCACGTCGTAGC TTGAGATCCATGCCGTTG
Srebp1 NM_011480 TCAAGCAGGAGAACCTGACC TCATGCCCTCCATAGACACA
Ppara NM_011144 CTGAGACCCTCGGGGAAC AAACGTCAGTTCACAGGGAAG
C-jun NM_010591 CCAGAAGATGGTGTGGTGTTT CTGACCCTCTCCCCTTGC
Atf3 NM_007498 GCAAAGCAGGATCCCACTAAT CCACCCCACCTATCAAGGTA
Nupr1 NM_019738 GAAGCTGCTGACCAAGTTCC GTGTGGTGTCTGTGGTCTGG
Chop NM_007837 GCGACAGAGCCAGAATAACA GATGCACTTCCTTCTGGAACA
β-actin NM_007393 GGATGCAGAAGGAGATTACTGC CCACCGATCCACACAGAGTA
Atf3, activating factor 3; Chop, C/EBP homologous protein; C-jun, jun proto-oncogene; Col1a1, collagen pro-alpha-1 type I chain; Nupr1, nuclear protein transcription regulator 1; Ppara, peroxisome proliferator-activated receptor-alpha; Srebp1, sterol regulatory element bind-ing protein 1; Tgfb1, transforming growth factor beta 1; Timp1, tissue inhibitor of metalloproteinases-1; Tnfa, tumor necrosis factor-alpha.
Table 2. Physiological and biochemical parameters in the all groups
FLS-ob/ob Control (n = 12) 24 W (n = 9) 36 W (n = 10) 48 W (n = 9) Body weight (g) 44.28 ± 2.58** 58.92 ± 3.84*†† ‡‡ 66.25 ± 2.96*** 70.24 ± 5.24 *** Liver weight (g) 2.68 ± 0.56** 7.88 ± 1.23* 9.02 ± 1.52*‡‡ 7.15 ± 1.65 *†† LW (g)/BW (g) 0.075 ± 0.01** 0.133 ± 0.015*‡‡ 0.136 ± 0.019 *‡‡ 0.101 ± 0.02***†† Fat weight (g) 1.42 ± 0.09** 2.28 ± 0.23*†† ‡‡ 1.98 ± 0.17*‡‡ 1.67 ± 0.34***†† Serum TG (mg/g) 166.08 ± 46.98 195.56 ± 59.55 192.60 ± 39.54‡‡ 161.63 ± 25.03†† Serum chol (mg/g) 114.58 ± 25.65** 300.22 ± 35.63*†† ‡‡ 248.50 ± 38.08*‡‡ 193.50 ± 37.09***††
Serum ALT (IU/L) 71.58 ± 48.75** 290.25±115.61* 226.10 ± 51.42* 227.25 ± 48.66*
Liver TG (mg/g) 353.05 ± 67.72**‡‡ 425.93 ± 125.41*†† ‡‡ 371.38 ± 46.38**‡‡ 250.44 ± 72.02**††
Liver chol (mg/g) 119.49 ± 25.82 111.08 ± 36.54 138.04 ± 32.53 114.63 ± 30.49
Data are expressed as the mean ± standard deviation. *P < 0.05 vs 24-week-old FLS mice, **P < 0.05 vs 24-week-old FLS-ob/ob mice, ††P < 0.05 vs 36-week-old FLS-ob/ob mice, ‡‡P < 0.05 vs 48-week-old FLS-ob/ob mice. ALT, alanine aminotransferase; BW, body weight; chol, cholesterol; FLS, fatty liver Shionogi; LW, liver weight; TG, triglyceride; W, weeks.
Quantitative polymerase chain reaction
Quantitative polymerase chain reaction (PCR) was performed in a final volume of 10 mL containing 250 nM of universal Probe Library probe (Roche), 900 nM of forward primer, 900 nM of reverse primer, 5 mL of EXPRESS qPCR Supermix with Premixed
Rox (Invitrogen), and 2 mL of cDNA. A real-time RT-PCR analysis was performed with a 7900HT Fast Real-Time PCR System with SDS2.3 software (Applied Biosystems, Carlsbad, CA). Thermal cycle conditions were as follows: hold at 95 °C for 20 s, then 45 repeated cycles of 95 °C for 1 s and 60 °C for 20. All results were
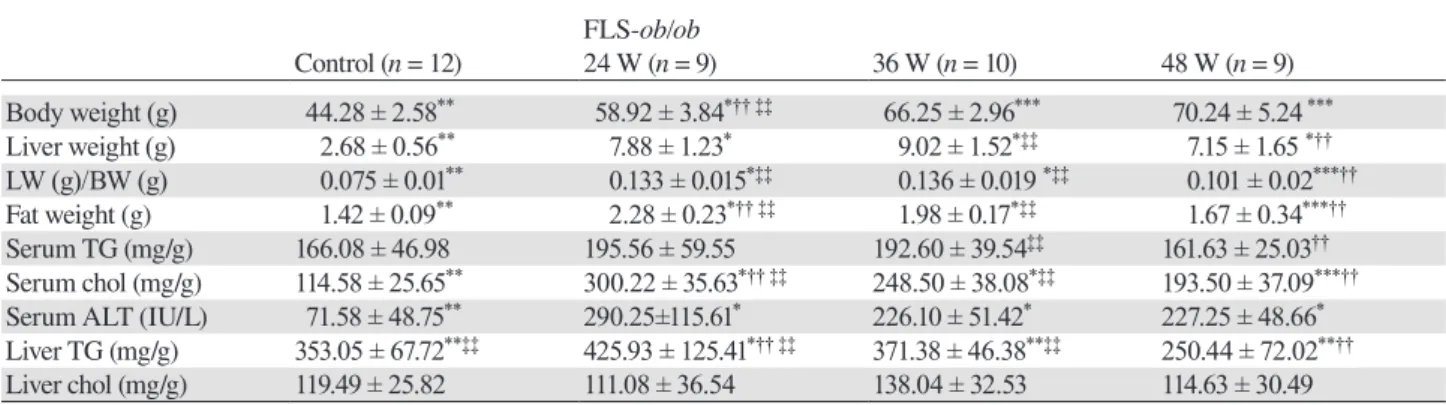
A
(%)
Lipid droplet area (%)
CNT 24W 36W 48W 10 20 30 40 50
*
*
* †
FLS-ob/obB
C
D
E.
Fig.1
F
G
H
I
Fibrosis area (%)
J.
(%) 0 10 20 30* †
* †
CNT 24W 36W 48W FLS-ob/obFig. 1. Histological analysis. Hematoxylin and eosin (H&E) staining was used to analyze the area of lipid droplets as vacuoles. Sirius
red staining was used to analyze the area of fibrosis. (A) Control liver stained with H&E; (B) 24-week-old FLS-ob/ob liver stained with H&E; (C) 36-week-old FLS-ob/ob liver stained with H&E; (D) 48-week-old FLS-ob/ob liver stained with H&E; (E) the ratio of the lipid droplet area; (F) control liver stained with Sirius red; (G) 24-week-old FLS-ob/ob liver stained with Sirius red; (H) 36-week-old
FLS-ob/ob liver stained with Sirius red; (I) 48-week-old FLS-ob/ob liver stained with Sirius red; (J) the ratio of the fibrosis area. *P < 0.05
compared with control, †P < 0.05 compared with 24-week-old FLS-ob/ob mice. CNT, control mice; FLS, fatty liver shionogi; W, weeks. Scale bar = 100 μm.
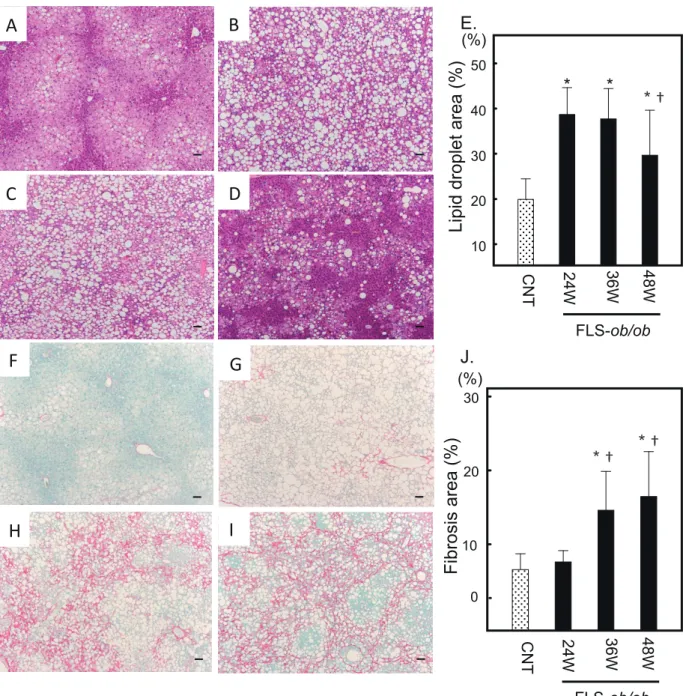
C.
D.
B.
Fig.2
A.
0 1 2 3 4 5 Tnfafold change of mRNA
expression
* †
* †
CNT 24W 36W 48W FLS-ob/ob 0.5 1.0 1.5 2.0*
Tgfb1fold change of mRNA
expression
* †
* †
CNT 24W 36W 48W FLS-ob/ob 0 1 2 3 4*
*
*
Col1a1fold change of mRNA
expression
CNT 24W 36W 48W
FLS-ob/ob Timp-1
fold change of mRNA
expression 0 1 2 3 4
*
*
CNT 24W 36W 48W FLS-ob/ob* †
Fig. 2. Hepatic gene expression levels of Tnfa, Tgfb1, Col1a1, and Timp-1 in FLS mice and FLS-ob/ob mice. (A) Gene expression of Tnfa; (B) gene expression of Tgfb1, (C) gene expression of Col1a1; (D) gene expression of Timp-1. *P < 0.05 compared with control, †P < 0.05 compared with 24-week-old FLS-ob/ob mice. CNT, control mice; Col1a1, collagen pro-alpha-1 type I chain; FLS, fatty liver shionogi; Tgfb1, transforming growth factor beta 1; Timp-1, tissue inhibitor of metalloproteinases-1; Tnfa, tumor necrosis factor-alpha; W, weeks.
standardized to the levels of β-actin. The primers used for PCR were listed in Table 1.
Statistical analysis
The Mann-Whitney test was used to assess the statistical significance of differences between two groups. All statistical tests were performed using StatFlex (Windows ver. 6.0; Artech, Osaka, Japan). All values are expressed
as the mean ± standard deviation. Values of P less than 0.05 were considered significant.
RESULTS
FLS-ob/ob mice mimic the human NASH pheno-type
FLS-ob/ob mice gained body weight between 24 and
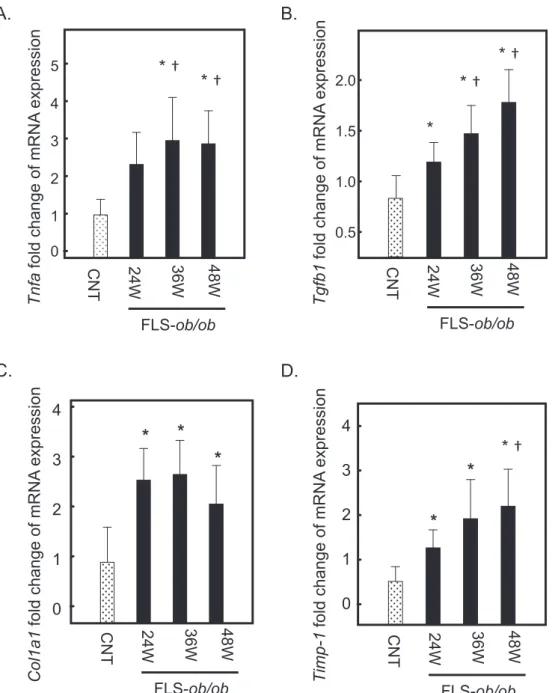
Fig.3
B.
A.
Atf3
fold change of mRNA
expression 0 1 2 3 4
*
*
* †
CNT 24W 36W 48W FLS-ob/ob C-junfold change of mRNA
expression CNT 24W 36W 48W 0.5 1.0 1.5 2.0
* †
* †
FLS-ob/obC.
0 1 2 3*
*
*
Nupr1fold change of mRNA
expression
CNT 24W 36W 48W
FLS-ob/ob
D.
Chop
fold change of mRNA
expression 0.4 0.6 0.8 1.0 1.2 CNT 24W 36W 48W FLS-ob/ob
n.s.
Fig. 3. Hepatic gene expression levels of C-jun, Atf3, Nupr1, and Chop in FLS mice and FLS-ob/ob mice. (A) Gene expression of C-jun; (B) gene expression of Atf3; (C) gene expression of Nupr1; (D) gene expression of Chop. *P < 0.05 compared with control, †P < 0.05 compared with 24-week-old FLS-ob/ob mice. Atf3, activating transcription factor; Chop, C/EBP homologous protein; C-jun, jun proto-oncogene; CNT, control mice; FLS, fatty liver shionogi; n.s., not significant; Nupr1, nuclear protein-1; W, weeks.
weight, and the liver to body weight ratio also signifi-cantly increased in the FLS-ob/ob mice compared with the FLS mice. These findings are consistent with the hepatic TG content but not with the cholesterol content. Serum ALT and cholesterol levels were also significant-ly elevated in the FLS-ob/ob mice compared with the FLS mice. Serum cholesterol and TG levels were lower in FLS-ob/ob mice at 48 weeks of age than at 36 weeks of age (Table 2).
Histological examinations of liver sections also
demon-strated significant steatosis at 24 and 36 weeks of age in the
FLS-ob/ob mice compared with control mice (Figs. 1A–C).
However, consistent with the serum lipid markers, steatosis was decreased at 48 weeks of age (Fig. 1D). The ratios of the lipid droplet areas in control, FLS-ob/ob mice at 24, 36, 48 weeks of age were 19.9 ± 4.6%, 38.7 ± 5.9%, 37.7 ± 6.7% and 29.7 ± 9.9%, respectively (Fig. 1E). Sirius red staining revealed that hepatic fibrosis significantly and progressively increased over time in FLS-ob/ob mice compared with control mice (Figs. 1F–G). At 48 weeks of age, the liver
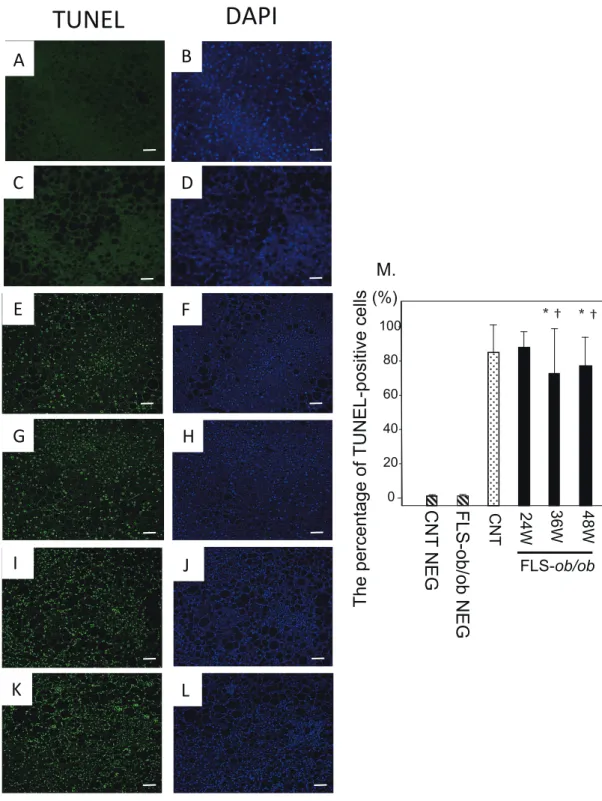
Fig. 4. TUNEL staining. Representative images of TUNEL staining in liver specimens from control and NASH model mice with
quantifi cation of TUNEL-positive cells. (A) Negative control liver stained with TUNEL; (B) Negative control liver stained with DAPI; (C) Negative control FLS-ob/ob mice liver stained with TUNEL; (D) Negative control FLS-ob/ob mice liver stained with DAPI; (E) Control mice liver stained with TUNEL; (F) Control mice liver stained with DAPI; (G) 24-week-old FLS-ob/ob liver stained with TUNEL; (H) 4-week-old FLS-ob/ob liver stained with DAPI; (I) 36-week-old FLS-ob/ob liver stained with TUNEL; (J) 36-week-old
FLS-ob/ob liver stained with DAPI; (K) 48-week-old FLS-ob/ob liver stained with TUNEL; (L) 48-week-old FLS-ob/ob liver stained
with TUNEL; (M) The percentage of TUNEL-positive cells. *P < 0.05 compared with control, †P < 0.05 compared with 24-week-old
FLS-ob/ob mice. CNT, control mice; DAPI, 4’,6-diamidino-2-phenylindole; FLS, fatty liver shionogi; NEG, negative control; TUNEL,
terminal deoxynucleotidyl transferase dUTP nick end labeling; W, weeks. Scale bar = 50 μm.
Fig.4
M.
TUNEL
DAPI
A
C
E
G
B
D
F
H
I
J
K
L
0 20 40 60 80 100FLS-ob
/ob
NEG
(%) CNT 24W 36W 48W FLS-ob/obCNT
NEG
* † * †The
percentage
of
TUNEL-positive cells
Fig.5
A.
B.
1 2 3*
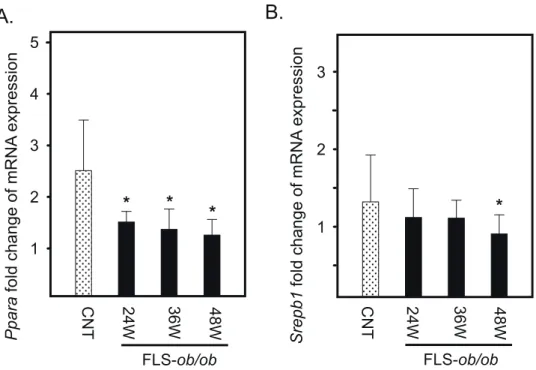
Srepb1 fold change of mRNA expression CNT 24W 36W 48W FLS-ob/ob 1 2 3 4 5*
*
*
Pparafold change of mRNA
expression CNT 24W 36W 48W FLS-ob/ob ER Toxic lipid accumulation ER Stress PERK eIF2a ATF4 ATF3 NUPR1 TNF-α TGF-β1 Collagen-1 TIMP-1 Fibrosis CHOP Positive feedback Apoptosis JNK c-Jun inflammation P P NAFLD NASH regulate SREBP-1c AP-1? dimerization PPARα ATF6 ?
Fig. 5. Hepatic gene expression levels of Ppara and Srebp1 in FLS mice and FLS-ob/ob mice. (A) Gene expression of Ppara; (B) gene expression of Srebp1. *P < 0.05. CNT, control mice; FLS, fatty liver shionogi; Ppara, peroxisome proliferator-activated receptor α; Srebp1, sterol regulatory element binding protein 1; W, weeks
Fig. 6. Schematic of gene expression around the ATF3/NUPR1 axis. Excess toxic lipid induces inflammation through TNF-α, excessive ER
stress is transduced through the ATF3 and NUPR-1 axis, and the excessive ER stress response ameliorates the protective effect of PPAR-α. For this reason, apoptosis and accelerated fibrosis are evident in the NASH mouse model. AP-1, activator protein-1; ATF, activating transcrip-tion factor; Chop, C/EBP homologous protein; c-Jun, jun proto-oncogene; eIF2α, eukaryotic initiation factor 2α; ER, endoplasmic reticulum; JNK, c-Jun NH2-terminal kinase; NAFLD, nonalcoholic fatty liver disease; NASH, nonalcoholic steatohepatitis; NUPR-1, nuclear protein-1; PERK, pancreatic ER kinase; PPAR-α, peroxisome proliferator-activated receptor-alpha; SREBP, sterol regulatory element binding protein;
histology of the FLS-ob/ob mice showed cirrhosis (Fig. 1I). The area ratios of fibrosis in control, FLS-ob/ob mice at 24, 36, 48 weeks of age were 2.5 ± 0.5%, 3.6 ± 0.9%, 8.5 ± 3.4%, 10.2 ± 4.5%, respectively (Fig. 1J).
Inflammation- and fibrosis-associated gene ex-pression is increased in the NASH model
The gene expression levels of tumor necrosis factor-alpha (Tnfa) significantly increased at 24 and 48 weeks of age in FLS-ob/ob mice compared with control mice (Fig. 2A). In response to inflammatory signaling, the expression levels of transforming growth factor beta 1
(Tgfb1) and collagen pro-alpha-1 type I chain (Col1a1),
considered the strongest profibrogenic cytokines, and tissue inhibitor of metalloproteinases (Timp-1), which is related to the progression of fibrosis, also increased significantly and progressively at 24, 36, and 48 weeks compared with FLS mice (Figs. 2B–D).
Jun proto-oncogene (C-jun), Nupr1 and Atf3 ex-pression increases according to NASH progres-sion
C-jun expression also increased at 36 and 48 weeks of age in FLS-ob/ob mice (Fig. 3A). The expression levels
of Nupr-1 and Atf3, which are ER stress-associated
genes, were significantly increased at 24, 36 and 48 weeks of age in FLS-ob/ob mice compared with control mice, respectively (Figs. 3B and C). The expression level of C/EBP homologous protein (Chop) was already high in the control mice and maintained the same expression levels in FLS-ob/ob mice (Fig. 3D).
Apoptosis appears from the early stage of NAFLD and persists in NASH mice
The percentage of TUNEL-positive cells divided by DAPI-positive cells was already high in control mice, and it remained at similar levels in FLS-ob/ob mice (Fig. 4M).
Lipid metabolism-associated genes are decreased in the NASH model
Peroxisome proliferator-activated receptor-alpha (Ppara) expression decreased at 24 and 48 weeks of age in the
FLS-ob/ob mice (Fig. 5A). In addition, sterol regulatory
element-binding transcription factor 1 (Srebp1) expres-sion was significantly decreased in FLS-ob/ob mice only at 48 weeks of age (Fig. 5B).
DISCUSSION
In this study, we showed that the expression levels of genes participating in the ATF3/NUPR1 axis were progressively elevated and suggested to induce apoptosis
from an early phase of steatosis in the NASH model mice.
As we expected, FLS-ob/ob mice biochemically and histologically showed significant steatohepatitis and fibrosis compared with control mice. The gene expres-sion of Tnfa significantly increased according to NASH progression. The proinflammatory cytokine TNF-α is considered an important mediator of insulin resistance in obesity.23 TNF-α activates the transcription of
inflam-matory genes via nuclear factor kappa B and activator protein-1 (AP-1) and also increases the expression of
Tgfb1 and Timp1 in hepatocytes.24, 25 These results are
also consistent with our findings.
Atf3, Nupr1, and C-jun were highly expressed in our NASH model mice. A variety of subunits, includ-ing c-Jun, ATF2, and ATF3, dimerize with AP-1.26
Investigation of vascular endothelial cells has revealed that TNF-α-mediated induction of ATF3 mRNA is regulated by the c-Jun NH2-terminal kinase (JNK).27
JNK regulates gene expression through the phosphor-ylation and activation of a downstream transcription factor c-Jun. Research into systemic sclerosis showed that ATF3 plays a role in fibrosis through the regulation of TGF-β signaling.28 These gene expressions imply that
TNF-α, ATF3, and c-Jun are closely linked and may dimerize with AP-1 and that they can also activate in-flammatory and profibrotic gene transcription in NASH model mice.
NUPR1, a small 82-amino acid polypeptide, was first described as a gene strongly induced in pancreatic acinar cells during the acute phase of pancreatitis.29
It is involved in the stress response and in cancer pro-gression.30 In the liver, NUPR1 has been shown to be
an important element in the hepatocyte stress response after hepatic injury by CCl4.31 The authors indicated that the activation of NUPR1 allows rapid downregulation of CYP2E1 expression and consequently the extent of the liver injury. Therefore, NUPR1 seems to protect against such liver damage. However, its role in NAFLD/NASH is still not known. NUPR1 is also a positive feedback regulator of ATF4-dependent transcription.32 This means
that NUPR1 additionally controls the target genes of ATF4, including CHOP. CHOP induces apoptosis as a component of the terminal UPR. In our study, the gene expression of Chop was already high in control mice and was at similar levels in NASH model mice. The TUNEL staining results seemed consistent with the Chop expres-sion. Cells lacking ATF4 do not appear to express ATF3 or CHOP.33 We can speculate that ATF4 which exists
at the upstream is necessary for the expression of the ATF3/NUPR1 axis and CHOP, and that these proteins interact. The apoptotic signal induced by CHOP through
ATF4 in relation to the ATF3/NUPR1 axis seems to participate in the very early phase of NAFLD. However, another study using whole-body and tissue-specific ATF4-knockout mice demonstrated that ATF6 could also up-regulate CHOP expression independent of the PERK pathway.34 It remains a matter of speculation
because we did not evaluate ATF6, but ATF6 might also be involved in Chop expression in such an early phase.
In this study, we also analyzed the gene expression levels of the transcription factors involved in lipid metab-olism regulation, Ppara and Srebp1. Ppara and Srebp1 encode PPAR-α and sterol regulatory element-binding protein (SREBP)-1c, respectively. The expression levels
of Ppara were significantly decreased in the NASH
model. PPAR-α expression is enriched in hepatocytes, and it acts as a protective transcription factor in the liver, decreasing hepatocyte apoptosis in the acute liver failure mice model, particularly through the regula-tion of ER stress.35 It is also considered a therapeutic
target.36 Therefore, the suppression of PPAR-α by ER
stress diminishes its protective effect and may promote NASH. On the other hand, ER stress induces cleavage of SREBP-1c and insulin resistance.37 Results from a
previ-ous human study suggest that hepatic overexpression of TNF-α is associated with downregulation of SREBP-1c and the development of burnt-out NASH.38 In the present
study, the encoding gene Srebp1 was also significantly decreased in the NASH model. Additionally, it has been reported that Srebp1 levels are lower in FLS mice than in B6 mice at 48 weeks of age.39 Therefore, it can also be
speculated that SREBP-1c plays a role in the early stage of NAFLD and not in NASH.
Taking all gene expression results together, it is assumed that, in the early stage of NAFLD, excess toxic lipid generated by SREBP-1c induces inflammation through TNF-α and ER stress mediated through the ATF3 and NUPR-1 axis and that an excessive ER stress response ameliorates the protective effect of PPAR-α. This explains the apoptosis and accelerated fibrosis evi-dent in the NASH mouse model (Fig. 6).
Our study has two main limitations. First, we only evaluated gene expressions and therefore could not discuss the phosphorylation status of each protein asso-ciated with the ATF3/NUPR1 axis. Second, we did not use a knockout system for Atf3 and Nupr1 and therefore could not precisely unravel the connection among each factor around the axis. Further study is necessary to determine the contribution of the ATF3/NUPR1 axis to NASH progression and carcinogenesis.
In conclusion, we showed that the ATF3/NUPR1 axis plays a pivotal role, in association with Tnfa, C-jun, Ppara, Srebp1, and Chop, in NASH progression.
Acknowledgments: We would like to thank Eiji Nanba from the Division of Functional Genomics, Research Center for Bioscience and Technology at Tottori University for his expert technical assis-tance.
This study was supported by a JSPS KAKENHI Grant-in-Aid for Young Scientists (B), Grant Number JP16K19343.
The authors declare no conflict of interest. REFERENCES
1 Vernon G, Baranova A, Younossi ZM. Systematic review: the epidemiology and natural history of non–alcoholic fatty liver disease and non-alcoholic steatohepatitis in adults. Aliment Pharmacol Ther. 2011;34:274-85. PMID: 21623852.
2 Liu CJ. Prevalence and risk factors for non-alcoholic fatty liv-er disease in Asian people who are not obese. J Gastroentliv-erol Hepatol. 2012;27:1555-60. PMID: 22741595.
3 Berlanga A, Guiu-Jurado E, Porras JA, Auguet T. Molecular pathways in non-alcoholic fatty liver disease. Clin Exp Gastroenterol. 2014;7:221-39. PMID: 25045276.
4 Buzzetti E, Pinzani M, Tsochatzis EA. The multiple-hit pathogenesis of non-alcoholic fatty liver disease (NAFLD). Metabolism. 2016;65:1038-48. PMID: 26823198.
5 Williams CL. Kazutoshi Mori and Peter Walter receive the 2014 Albert Lasker Basic Medical Research Award. J Clin Invest. 2014;124:4138-42. PMID: 25196044.
6 Mori K, Nagata S. The unfolded protein response: the dawn of a new field. Proc Jpn Acad Ser B Phys Biol Sci. 2015;91:469-80. PMID: 26560836.
7 Yoshida H, Yoshida CH. ER stress and diseases. FEBS J. 2007;274:630-58. PMID: 17288551.
8 Pagliassotti MJ, Kim PY, Estrada AL, Stewart CM, Gentile CL. Endoplasmic Reticulum Stress in Obesity and Obesity-Related Disorders: An Expanded View. Metabolism. 2016;65:1238-46. PMID: 27506731.
9 Malhi H, Kaufman RJ. Endoplasmic reticulum stress in liver disease. J Hepatol. 2011;54:795-809. PMID: 21145844. 10 Lebeaupin C, Vallée D, Hazari Y, Hetz C, Chevet E,
Bailly-Maitre B. Endoplasmic reticulum stress signalling and the pathogenesis of non-alcoholic fatty liver disease. J Hepatol. 2018;69:927-947. PMID: 29940269.
11 Zhang XQ, Xu CF, Yu CH, Chen WX, Li YM. Role of endo-plasmic reticulum stress in the pathogenesis of nonalcoholic fatty liver disease. World J Gastroenterol. 2014;20:1768. PMID: 24587654.
12 Harding HP, Novoa I, Zhang Y, Zeng H, Wek R, Schapira M, et al. Regulated Translation Initiation Controls Stress-Induced Gene Expression in Mammalian Cells. Mol Cell. 2000;6:1099-108. PMID: 11106749.
13 Hai T, Wolford CC, Chang Y-S. ATF3, a hub of the cellular adaptive-response network, in the pathogenesis of diseases: is modulation of inflammation a unifying component? Gene Expr. 2010;15:1-11. PMID: 21061913.
14 Pakos-Zebrucka K, Koryga I, Mnich K, Ljujic M, Samali A, Gorman AM. The integrated stress response. EMBO Rep. 2016;17:1374-95. PMID: 27629041.
15 Hai T, Wolfgang CD, Marsee DK, Allen AE, Sivaprasad U. ATF3 and stress responses. Gene Expr. 1999;7:321-35. PMID: 10440233.
16 Chen G, Liu C, Xue Y, Mao X, Xu K, Liu C. Molecular mechanism of pancreatic b-cell adaptive proliferation: studies
during pregnancy in rats and in vitro. Endocrine. 2011;39:118-27. PMID: 21069579.
17 Wang C, Tao Q, Wang X, Wang X, Zhang X. Impact of high-fat diet on liver genes expression profiles in mice model of nonalcoholic fatty liver disease. Environ Toxicol Pharmacol. 2016;45:52-62. PMID: 27262986.
18 Sugihara T, Koda M, Kishina M, Kato J, Tokunaga S, Matono T, et al. Fatty liver Shionogi- ob/ob mouse: A new candidate for a non-alcoholic steatohepatitis model. Hepatol Res. 2013;43:547-56. PMID: 23057725.
19 Takahashi M, Saibara T, Nemoto Y, Ono M, Akisawa N, Iwasaki S, et al. A Novel Type Hypertriglyceridemia Observed in FLS Mice. Lipids. 2003;38:687-92. PMID: 14506831. 20 Soga M, Kishimoto Y, Kawamura Y, Inagaki S, Makino S,
Saibara T. Spontaneous development of hepatocellular car-cinomas in the FLS mice with hereditary fatty liver. Cancer Lett. 2003;196:43-8. PMID: 12860288.
21 Lee YK, Jee BA, Kwon SM, Yoon YS, Xu WG, Wang HJ, et al. Identification of a Mitochondrial Defect Gene Signature Reveals NUPR1 as a Key Regulator of Liver Cancer Progression. 2015;62:1174-89. PMID: 26173068.
22 Emma MR, Iovanna JL, Bachvarov D, Puleio R, Loria GR, Augello G, et al. NUPR1, a new target in liver cancer: im-plication in controlling cell growth, migration, invasion and sorafenib resistance. Cell Death Dis. 2016;7:e2269. PMID: 27336713.
23 Hotamisligil GS, Uysal KT, Wiesbrock SM, Marino MW. Protection from obesity-induced insulin resistance in mice lacking TNF-α function. Nature. 1997;389:610-4. PMID: 9335502.
24 Locksley RM, Killeen N, Lenardo MJ. The TNF and TNF Receptor Review Superfamilies: Integrating Mammalian Biology. Cell. 2001:23;104:487-501. PMID: 11239407. 25 Kakino S, Ohki T, Nakayama H, Yuan X, Otabe S, Hashinaga
T, et al. Pivotal Role of TNF-α in the Development and Progression of Nonalcoholic Fatty Liver Disease in a Murine Model. Horm Metab Res. 2018;50:80-7. PMID: 28922680. 26 Van Dam H, Castellazzi M. Distinct roles of Jun : Fos and
Jun : ATF dimers in oncogenesis. Oncogene. 2001;20:2453-64. PMID: 11402340.
27 Inoue K, Zama T, Kamimoto T, Aoki R, Ikeda Y, Kimura H, et al. TNFα-induced ATF3 expression is bidirectionally reg-ulated by the JNK and ERK pathways in vascular endothelial cells. Genes Cells. 2004;9:59-70. PMID: 14723708.
28 Mallano T, Palumbo-Zerr K, Zerr P, Ramming A, Zeller B, Beyer C, et al. Activating transcription factor 3 regulates canonical TGFβ signalling in systemic sclerosis. Ann Rheum Dis. 2016;75:586-92. PMID: 25589515.
29 Mallo G V, Fiedler F, Calvo EL, Ortiz EM, Vasseur S, Keim
V, et al. Cloning and expression of the rat p8 cDNA, a new gene activated in pancreas during the acute phase of pancre-atitis, pancreatic development, and regeneration, and which promotes cellular growth. J Biol Chem. 1997;272:32360-9. PMID: 9405444.
30 Goruppi S, Iovanna JL. Stress-inducible protein p8 is involved in several physiological and pathological processes. J Biol Chem. 2010;285:1577-81. PMID: 19926786.
31 Taïeb D, Malicet C, Garcia S, Rocchi P, Arnaud C, Dagorn J-C, et al. Inactivation of stress protein p8 increases murine carbon tetrachloride hepatotoxicity via preserved CYP2E1 activity. Hepatology. 2005;42:176-82. PMID: 15962327. 32 Jin H-O, Seo S-K, Woo S-H, Choe T-B, Hong S-I, Kim J-I, et
al. Nuclear Protein 1 Induced by ATF4 in Response to Various Stressors Acts as a Positive Regulator on the Transcriptional Activation of ATF4. IUBMB Life. 2009;61:1153-8. PMID: 19946894.
33 Jiang H-Y, Wek SA, McGrath BC, Lu D, Hai T, Harding HP, et al. Activating transcription factor 3 is integral to the eukary-otic initiation factor 2 kinase stress response. Mol Cell Biol. 2004;24:1365-77. PMID: 14729979.
34 Fusakio ME, Willy JA, Wang Y, Mirek ET, Al Baghdadi RJT, Adams CM, et al. Transcription factor ATF4 directs basal and stress-induced gene expression in the unfolded protein response and cholesterol metabolism in the liver. Mol Biol Cell. 2016; 27:1536-51. PMID: 26960794.
35 Zhang L, Ren F, Zhang X, Wang X, Shi H, Zhou L, et al. Peroxisome proliferator-activated receptor alpha acts as a mediator of endoplasmic reticulum stress-induced hepatocyte apoptosis in acute liver failure. Dis Model Mech. 2016;9:799-809. PMID: 27482818.
36 Honda Y, Kessoku T, Ogawa Y, Tomeno W, Imajo K, Fujita K, et al. Pemafibrate, a novel selective peroxisome proliferator-activated receptor alpha modulator, improves the pathogenesis in a rodent model of nonalcoholic steatohepatitis. Sci Rep. 2017;7:42477. PMID: 28195199.
37 Ferr P, Foufelle F. Hepatic steatosis: a role for de novo lipo-genesis and the transcription factor SREBP–1c. Diabetes Obes Metab. 2010;12:83-92. PMID: 21029304.
38 Nagaya T, Tanaka N, Suzuki T, Sano K, Horiuchi A, Komatsu M, et al. Down-regulation of SREBP–1c is associated with the development of burned-out NASH. J Hepatol. 2010;53:724-31. PMID: 20655124.
39 Shindo N, Fujisawa T, Sugimoto K, Nojima K, Oze-Fukai A, Yoshikawa Y, et al. Involvement of microsomal triglyceride transfer protein in nonalcoholic steatohepatitis in novel spontaneous mouse model. J Hepatol. 2010;52:903-12. PMID: 20392512.